Abstract
Our objective was to determine whether overexpression and underexpression of human heme oxygenase (HHO)-1 could be controlled on a long-term basis by introduction of the HO-1 gene in sense (S) and antisense (AS) orientation with an appropriate vector into endothelial cells. Retroviral vector (LXSN) containing viral long terminal repeat promoter-driven human HO-1 S (LSN-HHO-1) and LXSN vectors containing HHO-1 promoter (HOP)-controlled HHO-1 S and AS (LSN-HOP-HHO-1 and LSN-HOP-HHO-1-AS) sequences were constructed and used to transfect rat lung microvessel endothelial cells (RLMV cells) and human dermal microvessel endothelial cells (HMEC-1 cells). RLMV cells transduced with HHO-1 S expressed human HO-1 mRNA and HO-1 protein associated with elevation in total HO activity compared with nontransduced cells. Vector-mediated expression of HHO-1 S or AS under control of HOP resulted in effective production of HO-1 or blocked induction of endogenous human HO-1 in HMEC-1 cells, respectively. Overexpression of HO-1 AS was associated with a long-term decrease (45%) of endogenous HO-1 protein and an increase (167%) in unmetabolized exogenous heme in HMEC-1 cells. Carbon monoxide (CO) production in HO-1 S- or AS-transduced HMEC-1 cells after heme treatment was increased (159%) or decreased (50%), respectively, compared with nontransduced cells. HO-2 protein levels did not change. These findings demonstrate that HHO-1 S and AS retroviral constructs are functional in enhancing and reducing HO activity, respectively, and thus can be used to regulate cellular heme levels, the activity of heme-dependent enzymes, and the rate of heme catabolism to CO and bilirubin.
Cellular levels of heme are regulated by the rates of its synthesis and degradation. Heme catabolism occurs by oxidative cleavage of the α-methene bridge of the tetrapyrrole, eventually leading to the formation of equimolar amounts of biliverdin and CO and the release of the contained iron atom (1, 2). Biliverdin is then rapidly reduced to form bilirubin (3, 4). The heme oxygenase (HO) system controls the rate-limiting step in heme catabolism (5). To date, three HO isoforms (HO-1, HO-2, and HO-3) have been identified that catalyze this reaction (6–8). HO-1 is a 32-kDa heat shock protein (9–11) that is inducible by numerous noxious stimuli (12–17). HO-2 is a constitutively synthesized 36-kDa protein that is abundant in brain and testis (6). HO-3 is related to HO-2, but is the product of a different gene, and its ability to catalyze heme degradation is much less than that of HO-1 (18).
Overexpression of HO-1 can lead to hyperbilirubinemia in humans with certain hepatic disorders, especially patients in whom bilirubin disposition is impaired for developmental or genetic reasons, i.e., in newborns and in patients with the Crigler–Najjar type I syndrome. Pharmacological agents such as the inhibitor of HO, tin mesoporphyrin, can inhibit HO activity significantly and have been shown to be highly effective in single dose in controlling hyperbilirubinemia in newborns and other patients (19–23). However, such agents can exert only transient control of the activity of HO-1. Further, the long-term overexpression or underexpression of human HO-1 (HHO-1) would have considerable experimental value in elucidating the role of the enzyme in physiological and pathological processes.
The objective of this study was to examine the feasibility of using the retrovirus-mediated transfer of an HHO-1 sense (S) and antisense (AS) orientation sequence under the control of the HHO-1 promoter to regulate endogenous HO-1 expression and function and thus permit development of a gene transfer technology to regulate the rate of heme catabolism over the long term.
Our data demonstrate that selective delivery of the HHO-1 gene in AS orientation into human endothelial cells results in an attenuation of HHO-1 protein leading to a decrease in the rate of catabolism of cellular heme and that this effect is brought about without altering endogenous HO-2 protein. Thus, by the use of the retroviral HO-1 AS methodology it is possible to envisage prolonged down-regulation of the rate of heme catabolism to its degradation product bilirubin in clinical or experimental circumstances where this might prove useful.
Materials and Methods
Cell Culture Conditions.
The amphotropic retroviral packaging cell line PA317 (American Type Culture Collection) or PT67 (CLONTECH) was used for the generation of replication-deficient recombinant retroviruses. PA317 and PT67 cells were grown in DMEM (GIBCO/BRL, Grand Island, NY) supplemented with 10% heat-inactivated FBS. NIH 3T3 fibroblasts were cultured in DMEM with 10% calf serum. Human dermal microvessel endothelial cells (HMEC-1 cells) were a kind gift of Michael Dillon (National Center for Infectious Diseases, Atlanta, GA) and grown in MCDB131 medium (GIBCO/BRL) supplemented with 10% FBS, 10 ng/ml epidermal growth factor (EGF; Sigma), and 1 μg/ml hydrocortisone (Sigma). Rat lung microvessel endothelial cells (RLMV cells) were cultured in MCDB131 medium with 10% FBS, 10 ng/ml EGF, 1 μl/ml hydrocortisone, 0.1 mg/ml ENDO GRO (Vec Technologies, Rensselaer, NY), and 90 μg/ml heparin (Sigma). All cells were incubated at 37°C in a 5% CO2/95% air humidified atmosphere, and maintained at subconfluency by passaging with trypsin/EDTA (GIBCO/BRL).
Development of Recombinant Retroviral Vectors.
The HHO-1-expressing replication-deficient retrovirus vector LSN-HHO-1 (long terminal repeat promoter-driven HHO-1-S) was constructed as follows: a 987-bp HindIII–HindIII HHO-1 cDNA fragment was released from plasmid pRC-CMV-HHO-1 (4) and inserted at the HindIII site of pGEM-7zf(+) vector (Promega). After confirmation of HO-1 insert orientation with ApaI digestion, the transcription-orientational clones were selected and designated pGEM-HHO-1. LSN-HHO-1 was constructed by cloning the HHO-1 cDNA fragment from pGEM-HHO-1 at the EcoRI–BamHI sites of retroviral vector LXSN.
The retroviral vectors LSN-HOP-HHO-1 and LSN-HOP-HHO-1-AS were constructed as follows: (i) a 1,519-bp (+19 to −1,500) HHO-1 transcriptional-regulated sequence (HOP) was released from the plasmid A-CAT (30) and inserted at the XhoI and HindIII sites of the plasmid pGEM-7zf(+) (Promega). The resulting plasmid was designated pGEM-HOP. (ii) The retroviral vector LSN-HOP was constructed by cloning the XhoI–EcoRI HOP sequence of the pGEM-HOP at the EcoRI and XhoI sites of the retroviral vector LXSN. (iii) The 987-bp (−63 to + 924 bp) HindIII HHO-1 cDNA fragment from the pRc-CMV-HHO-1 was end blunted and was inserted at the end-blunted BamHI site of the LSN-HOP. After clone selection, the transcription-oriented construct was designated as LSN-HOP-HHO-1 and the opposite transcription-oriented construct was designated as LSN-HOP-HHO-1-AS.
Production of Retroviral Constructs.
PA317/PT67 retroviral packaging cells were transfected with retroviral vectors (LSN-HHO-1, LSN-HOP-HHO-1, LSN-HOP-HHO-1-AS, LSN-HOP, or LXSN) separately by using Lipofectamine reagent (GIBCO/BRL). Individual G418-resistant clones were selected as described (24). For each isolated clone, the viral titer was determined by infection of NIH 3T3 fibroblasts (25). The clones of packaging cell lines (PA317/LSN-HHO-1, PT67/LSN-HOP-HHO-1, PT67/LSN-HOP-HHO-1-AS, PA317/LXSN, and PT67/LSN-HOP) with viral titers of 0.12 to 1.5 × 10⁷ colony-forming unit (cfu) per ml were used in the experiments described below. By using the supernatants of the above retroviral packaging cells, we infected RLMV and HMEC-1 endothelial cells. After selection with G418, stable transfected cell lines, RLMV expressing HHO-1 and HMEC-1 expressing HHO-1 S or AS, were obtained.
Measurement of HO Activity and CO Levels.
Microsomal HO activity was assayed by the method of Abraham et al. (26), in which bilirubin, the product of HO degradation, was extracted with chloroform and its concentration was determined spectrophotometrically by using the difference between absorbance at wavelength 460 nm and that at 530 nm with an absorption coefficient of 40 mM−1⋅cm−1 (27).
The analyses of CO were performed by using an HP-5989A mass spectrometer interfaced to an HP-5890 gas chromatograph. CO separation from other gases was carried out on a GS-Molesieve capillary column (30 m; 0.53 mm inside diameter; J & W Scientific, Folsom, CA) kept at 40°C. Helium was used as the carrier gas with a linear velocity of 0.3 m/s. CO eluted at 3.6 min and was fully separated from N2, O2, H2O, and CO2. The mass spectrometer parameters were as follows: ion source temperature, 120°C; electron energy, 31 eV; transfer line temperature, 120°C. Aliquots (100 μl) of the headspace gas of either standard solutions or experimental samples were injected by using a gas-tight syringe into the spitless injector having a temperature of 120°C. Abundance of ions at m/z 28, 29, and 31 corresponding to 12C16O, 13C16O, and 13C18O, respectively, was acquired by means of selected ion monitoring. For the measurement of CO concentration, the sample in 1 ml of solution was prepared in an amber glass vial (2 ml), and then capped tightly with a Teflon/silicone septum. One microliter of the [13C]carbon monoxide saturated solution (1 mM) was added to the sample, resulting in the internal standard concentration of 1 μM. After sample equilibration, 100 μl of the headspace gas was taken from the vial and injected into the gas chromatograph. The amount of CO in cell culture samples was calculated from standard curves constructed with abundance of ions m/z 28 and m/z 29 or m/z 31 as previously described (28). Both standard curves were linear over the range 0.05–5.0 μmol/liter, and both yielded comparable results when used for determining the concentration of endogenous CO (28).
Microsomal Heme Determination.
Microsomal heme was determined as the pyridine hemochromogen by using the reduced minus oxidized difference in absorbance at 400 and 600 nm with an absorption coefficient of 32.4 mM−1⋅cm−1 (29).
Northern Blotting.
Total RNA was extracted from cells by Trizol reagents (GIBCO-BRL). Ten micrograms of total RNA was electrophoresed on gels containing 1% agarose and 1 M formaldehyde, transferred to nylon membrane, and hybridized with 32P-labeled probes. The probe used for HHO-1 was the 987-bp HindIII fragment prepared in the plasmid pGEM-HHO-1. The probe for glyceraldehyde-3-phosphate dehydrogenase (G3PDH) was purchased from CLONTECH. Autoradiography was performed for various lengths of time at −80°C by using XAR-5 film (Eastman Kodak) with Lightning Plus intensifying screens (DuPont). The relative amounts of HO-1 and G3PDH mRNA were determined by scanning the blots and using the NIH IMAGE software program. The density of G3PDH mRNA was used for normalization of the data.
Reverse Transcription (RT)-PCR and PCR analysis.
RT was carried out by using the Advantage RT-for-PCR Kit (CLONTECH). Poly(dT)n was used as RT primer. Specific primers for amplifying HHO-1, neomycin-resistance (neor) and LXSN vector gene fragments are listed in Table 1. PCR was performed by using a Taq PCR kit (Roche Diagnostics). For each RT-PCR, a sample without reverse transcriptase was processed in parallel and served as a negative control. Cycling parameters for amplifying RT products were as follows: 95°C, 1 min; 60°C, 1 min; 72°C, 1–3 min, for 30 cycles, and then extended at 72°C for another 5 min. After amplification, PCR products were electrophoresed on 1.2% agarose gel, stained with ethidium bromide, and visualized under UV light.
Table 1.
Synthetic primers for PCR or RT-PCR
| Amplified DNA fragment | Primer sequence | Symbol |
|---|---|---|
| neor gene | S: 5′-AAGATGGATTGCACGCAGG-3′ | P3 |
| (313 bp) | AS: 5′-GCAAGGTGAGATGACAGGAG-3′ | P4 |
| HHO-1 cDNA | S: 5′-CAGGCAGAGAATGCTGAGTTC-3′ | P5 |
| (515 bp) | AS: 5′-GATGTTGAGCAGGAACGCAGT-3′ | P6 |
| LXSN vector sequence | S: 5′-CCCGGGAACCTCCTCGTTCGACC-3′ | P1 |
| (139 bp) | AS: 5′-GAGCCTGGGGACTTTCCACACCC-3′ | P2 |
Genomic DNA was extracted from cells by using the DNeasy Tissue Kit (Qiagen Valencia, CA). Different combinations of primers (Table 1) were used to amplify the integrated DNA fragments by means of Expand High Fidelity PCR System (Roche). Cycling parameters are described as above.
Western Blotting.
Cells were harvested by using cell lysis buffer as described (24). The lysate was collected for Western blot analysis. Protein levels were visualized by immunoblotting with antibodies against human HO-1, total immunoreaction HO-1 (rat and human), or HO-2 (StressGen Biotechnologies, Victoria, Canada). Briefly, 30 μg of lysate supernatant was separated by SDS/PAGE and transferred to a nitrocellulose membrane (Amersham Pharmacia) by using a semidry transfer apparatus (Bio-Rad). The membranes were incubated with 5% milk in 10 mM Tris⋅HCl (pH 7.4) 150 mM NaCl, 0.05% Tween 20 (TBST) buffer at 4°C overnight. After washing with TBST, the membranes were incubated with a 1:2,000 dilution of anti-HO-1 or anti-HO-2 antibodies for 1 h at room temperature with constant shaking. Then the filters were washed and subsequently probed with horseradish peroxidase-conjugated donkey anti-rabbit IgG (Amersham Pharmacia) at a dilution of 1:2,000. Chemiluminescence detection was performed with the Amersham Pharmacia ECL detection kit according to the manufacturer's instructions.
Statistical Analysis.
The data are presented as mean ± SD for the number of experiments. Statistical significance (P < 0.05) between the experimental groups was determined by Fisher methods of analysis of multiple comparisons. For comparison between treatment groups, the Null hypothesis was tested by a single factor ANOVA for multiple groups or unpaired t test for two groups.
Results
Development of Retrovirus-Mediated Expression of Human HO-1 S and AS.
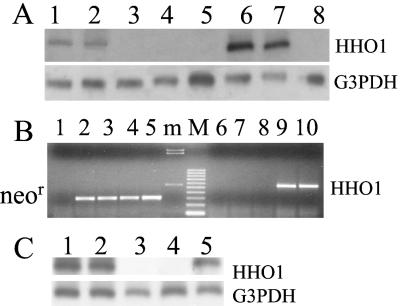
PA317 retroviral packaging cells were stably transfected with retroviral vector LSN-HHO-1 and control retroviral vector LXSN. G418-resistant clones (PA317/HHO-1 and PA317/LXSN) were isolated and tested for their ability to produce retrovirus in culture medium. The results showed that the highest retroviral titers could reach 1.4 × 10⁶ and 1.2 ×10⁶ cfu/ml in PA317/HHO-1 and PA317/LXSN cell clones, respectively. The neor gene was expressed in both PA317/HHO-1 and PA317/LXSN cells, whereas only HHO-1 gene expression was detected in PA317/HHO-1 cells as confirmed by RT-PCR and Northern blotting (Fig. 1 A and B).
Figure 1.
(A) Northern blot analysis of RNA obtained from PA317 and NIH 3T3 cells nontransduced or transduced with retroviral vector LSN-HHO-1 or LXSN. Lanes 1 and 2, PA317/HHO-1 cells; lane 3, control PA317 retroviral packaging cells; lane 4, PA317/LXSN cells; lane 5, NIH 3T3/LXSN cells; lanes 6 and 7, NIH 3T3/HHO-1 cells; lane 8, control NIH 3T3 cells. (B) Reverse transcription (RT)-PCR analysis of PT67 retroviral packaging cells transduced with different retroviral vectors. Lanes 1 and 6, PT67 cells; lanes 2 and 7, PT67/LXSN cells; lanes 3 and 8, PT67/LSN-HOP cells; lanes 4 and 9, PT67/LSN-HOP-HHO-1 cells; Lanes 5 and 10, PT67/LSN-HOP-HHO-1-AS cells. m, HindIII-digested λ DNA marker; M, 100-bp DNA ruler; neor, RT-PCR products of neomycin-resistance gene; HO-1, human HO-1 RT-PCR products. (C) Detection of human (h)HO-1 and G3PDH transcripts by Northern blot analysis in RLMV cells transduced with retroviral vectors LSN-HHO-1 or LXSN. Lanes 1, 2, and 5, RLMV cells transduced with LSN-HHO-1; lane 3, control RLMV cells; lane 4, RLMV cells transduced with LXSN.
To develop HO-1 promoter-controlled HHO-1 S and AS, we used a genetically modified packaging cell line (PT67 cells) to produce a higher titer of retrovirus. PT67 retroviral packaging cells were transfected with retroviral vectors (LSN-HOP-HHO-1 and LSN-HOP-HHO-1-AS) and control retroviral vectors (LXSN and LSN-HOP). G418-resistant clones (PT67/HOP-HHO-1, PT67/HOP-HHO-1-AS, PT67/LXSN, and PT67/HOP) were isolated and tested for their potential to produce retrovirus in culture medium. The results showed that the use of the PT67 packaging cell line yielded higher retroviral titers, reaching 2.1–15 × 106 cfu/ml. The neor gene was expressed in PT67/HOP-HHO-1 (S and AS) and control cells (PT67/LXSN and PT67/HOP). Nontransduced PT67 packaging cells did not yield RT-PCR products with either neor or HHO-1 primers. PT67 packaging cells transduced with retrovirus vectors containing HHO-1 S and AS resulted in generation of RT-PCR products when HHO-1 primers corresponding to the expected size of HHO-1 gene (Fig. 1B) were used. G418-resistant clones were used in experiments for infecting RLMV and HMEC-1 cells.
Functional Expression of LSN-HHO-1-Directed HHO-1 Transcripts in NIH 3T3 Fibroblasts and Rat Endothelial Cells.
We used the supernatants of PA317/HHO-1 and PA317/LXSN retroviral packaging cells to infect NIH 3T3 and RLMV cells. After selection with G418, G418-resistant cell clones (NIH 3T3/HHO-1, NIH 3T3/LXSN, RLMV/HHO-1 and RLMV/LXSN) were tested for their ability to express HHO-1 mRNA. As seen in Fig. 1A, Northern blot analysis showed that the HHO-1 mRNA was expressed in the HHO-1-transduced NIH 3T3 cells (lanes 6 and 7). In contrast, NIH 3T3 (lane 8) cell line and cells transduced with empty virus (lanes 4 and 5) did not yield a signal for HHO-1.
The expression of HHO-1 mRNA in rat endothelial cells infected with retrovirus (LSN-HHO-1 or LXSN) was also assessed by RT-PCR and Northern blot analysis. As shown in Fig. 1C, Northern blot analysis revealed that endothelial cells infected with LSN-HHO-1 retrovirus expressed HHO-1 mRNA at a detectable level (lanes 1, 2, and 5); but in endothelial cells uninfected or infected with control LXSN retrovirus alone (lanes 3 and 4), no HHO-1 mRNA was detected. These analyses demonstrated that the HHO-1 mRNA was efficiently expressed in NIH 3T3 and endothelial cells after infection with the LSN-HHO-1 retroviral supernatant.
Enhancement of HO Activity in Cells Infected with LSN-HHO-1 Retroviral Supernatant.
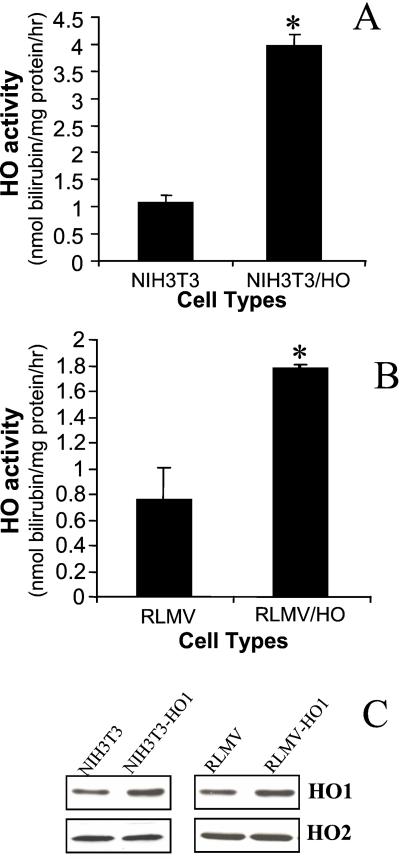
Efficacy of HHO-1 gene transfer in rat endothelial cells was evaluated by comparing the levels of total HO activity in uninfected and retrovirus-infected endothelial cells. This cell line was chosen because of its relevance to vascular gene therapy (24). As seen in Fig. 2, total HO activity in rat endothelial cells expressing the HHO-1 gene was increased by 2.3-fold, as compared with control endothelial cells (P < 0.05). In control LXSN-infected endothelial cells, immunoreactive HO-1 protein (rat HO-1 and human HO-1) and overall HO activity were similar to uninfected cells (data not shown). These findings indicate that LSN-HHO-1 infection generated increased levels of HO-1 activity in infected cells compared with uninfected cells. However, the expression of HO-1 gene in HHO-1 transduced NIH 3T3 cell line was higher than in endothelial cells (Fig. 2 A and B). Moreover, Western blot analysis showed no differences in HO-2 protein levels, further indicating that overexpression of HO-1 by gene transfer did not modulate HO-2 expression. In contrast, HO-1 protein in cells transduced with human HO-1 gene was markedly increased (Fig. 2C).
Figure 2.
HO activity and HO protein expression in RLMV cells and NIH 3T3 fibroblasts nontransduced or transduced with retroviral vector LSN-HHO-1. (A and B) HO activity (nmol of bilirubin per mg protein per h) is expressed as mean ± SD of three experiments. *, P < 0.05 vs. control cells. (C) Western blot analysis of NIH 3T3 and RLMV cells nontransduced or transduced with LSN-HHO-1 (NIH 3T3/HO-1 and RLMV/HO-1). Immunoreactive antibody against HO-1 protein was used to detect total HO-1 protein expression.
Integration of Retroviral-Mediated HHO-1 S and AS in HMEC-1 Cells.
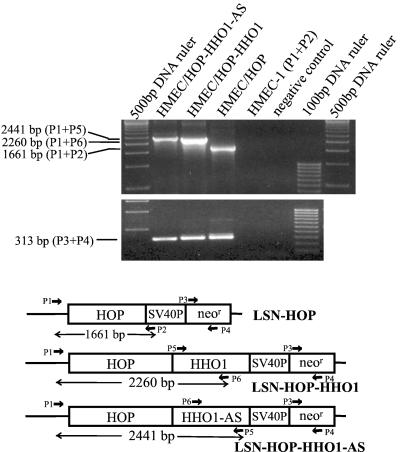
We then used HMEC-1 cells to evaluate the integration of retroviral-mediated HHO-1 (S or AS) cells transduced with variable retroviral vectors. Cellular genomic DNA fragment was amplified by PCR with different combinations of primers. As shown in Table 1 and Fig. 3, a 2,260-bp DNA fragment containing chimeric sequences (partial retroviral vector, HOP, and partial HHO-1) was amplified from HMEC-1 cells transduced with LSN-HOP-HHO-1 (HMEC/HOP-HHO-1) when primers P1 and P6 were used. Similarly, a 2,441-bp DNA fragment containing the sequences of partial vector, HOP, and partial HHO-1-AS were detected in cells transduced with LSN-HOP-HHO-1-AS (HMEC/HOP-HHO-1-AS) when primers P1 and P5 were used. In HMEC-1 cells transduced with LSN-HOP (HMEC/HOP), a 1,661-bp DNA fragment was detected with primers P1 and P2. neor genes were detected in all of the above three cells. However, there was no signal found in control HMEC-1 cells when primers P1 and P2 were used. These results indicated that HHO-1 S and AS were integrated cellular genomic DNA in transduced cells.
Figure 3.
PCR analysis of the genomic DNA extracted from HMEC-1 cells nontransduced or transduced with various retroviral vectors. Different combinations of primers were used to amplify HHO-1, neor, or chimeric vector/HHO-1 DNA fragments. P1 and P2, primers for amplifying LXSN vector sequence; P3 and P4, primers for neor gene; P5 and P6, primers for HHO-1 DNA fragment. The combination of P1 and P5 for HHO-1-AS-transduced HMEC-1 cells (HMEC/HOP-HHO-1-AS) detected a 2,441-bp signal that contains partial vector sequence, HOP, and a partial HHO-1-AS DNA fragment. Similarly, a 2,260-bp PCR product containing partial vector sequence, HOP, and a partial HHO-1 gene fragment was amplified from HHO-1-transduced cells (HMEC/HOP-HHO-1) when primers P1 and P6 were used. The primers P1 and P2 amplified a 1,661-bp PCR product from control vector (LSN-HOP)-transduced HMEC-1 cells (HMEC/HOP). The 313-bp neor DNA fragments were detected in all three kinds of cells mentioned above by using primers P3 and P4.
Effect of Retroviral-Mediated HHO-1 S and AS Transfer on Endogenous HHO-1 Protein.
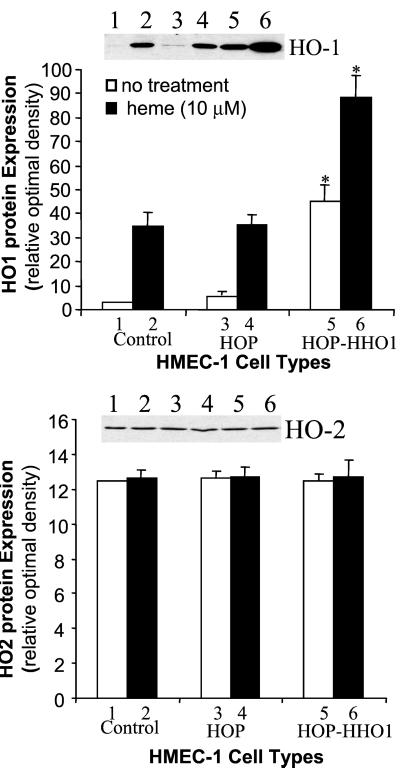
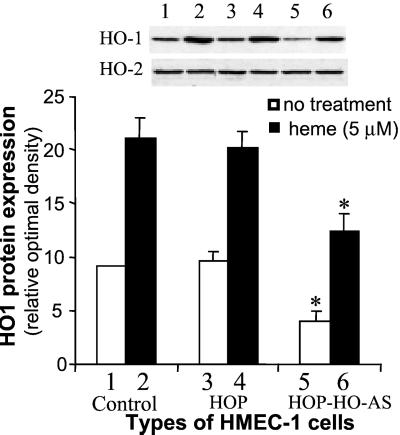
Based on the above results, experiments were carried out to examine the effect of retrovirus vector in delivery of HO-1 under control of the human HO-1 promoter. We selected a +19 to −1,500 human HO-1 promoter in which heme response elements are present (30). Cells transduced with control vector (LSN-HOP) and cells transduced with HHO-1 promoter-driven HHO-1 gene (S and AS) were examined by Western blot analysis. The results of three representative experiments are shown in Figs. 4 and 5. Western blot analysis revealed that the HO-1 protein expression was increased by 14.2-fold in HMEC-1 cells transduced with HOP-driven HHO-1-S as compared with control HMEC-1 cells. The addition of heme (10 μM, 24 h) further increased HO-1 expression by 2-fold. The result in Fig. 5 showed that HHO-1 AS substantially inhibited HHO-1 protein expression in both heme-induced and noninduced cells. Addition of heme (5 μM, 24 h) increased the levels of HO-1 protein by 2-fold in both the nontransduced cells and the cells transduced with control retroviral vector (LSN-HOP). In contrast, endothelial cells transduced with retrovirus-mediated HHO-1 AS displayed diminished levels of HO-1 protein by 55% and 45% in both nontreated cells and in cells treated with heme for 24 h, respectively. There were no changes in HO-2 protein levels in cells nontransduced or transduced with retroviral-mediated HHO-1 S and AS.
Figure 4.
Western blot analysis of HMEC-1 cells nontransduced or transduced with retroviral vector LSN-HOP (HOP) or LSN-HOP-HHO-1 (HOP-hHO-1). Some cells were treated with heme (10 μM) for 24 h. The HHO-1 protein expression in nontreated or heme-treated HHO-1-transduced cells (HOP-hHO-1) was increased by 14.2-fold and 2.6-fold, respectively, compared with their corresponding control HMEC-1 cells (*, P < 0.05). However, there was no significant difference in HO-2 protein expression among three groups of HMEC-1 cells.
Figure 5.
Western blot analysis of HMEC-1 cells nontransduced or transduced with retroviral vector LSN-HOP (HOP) or LSN-HOP-HHO-1-AS (HOP-HO-AS). HOP, human HO-1 promoter. Some cells were treated with heme (5 μM) for 24 h. The HHO-1 protein expression in nontreated or heme-treated HHO-1-AS transduced cells (HOP-HHO-1-AS) was decreased by 55% and 45%, respectively, as compared with their corresponding control cells. *, P < 0.05.
Effect of Retrovirus HHO-1 S and AS on the Rate of Cellular Heme Catabolism and CO Production.
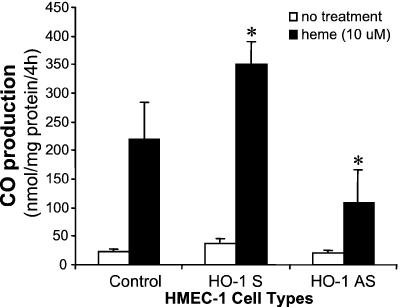
To further ascertain the metabolic characteristics of the cells expressing HHO-1 S and AS, we assessed the levels of nonmetabolized heme after exogenous heme addition in HHO-1-S- and -AS-transduced HMEC-1 cells. Cells were cultured in the presence of 10 μM heme for 24 h; heme content was then determined. As seen in Table 2, in cells transduced with HHO-1-AS, heme content was increased to 265 ± 92 pmol/mg of protein as compared with 159 ± 78 pmol/mg of protein in control cells. Control cells were able to catabolize heme at a higher rate than HHO-1-AS-transduced cells, reflecting the decrease in HO activity after HO-1-AS expression. In contrast, HMEC-1 cells transduced with HHO-1-S expressed a 5.6-fold increase in HO activity and a decrease in cellular heme content by 65% as compared with cells transduced with HHO-1-AS. These results further indicate that the exogenous heme was degraded primarily by HO-1 but not HO-2 because the rate of heme catabolism was diminished significantly in the HHO-1-transduced cells without change in HO-2 protein content. As HO is the sole enzyme involved in physiologic heme degradation and the generation of CO, we measured the levels of CO in HMEC-1 endothelial cells transduced with human HO-1 S and HO-1 AS. CO production in cells transduced with HHO-1 S and AS after exposure to heme was 350 ± 39 and 109 ± 58 nmol/mg of protein per 4 h, respectively, as compared with the control HMEC-1 cells (220 ± 64 nmol/mg of protein per 4 h; Fig. 6). The levels of CO generated in cells transduced with HHO-1 S and AS were significantly different (P < 0.05). These results conform to the decrease in heme degradation observed after HO-1 AS gene delivery.
Table 2.
Effect of retroviral HHO-1-S and -AS transfer on heme content and HO activity in HMEC-1 cells
| Cell type | Heme content, pmol/mg microsomal protein | HO activity, nmol/mg/per 30 min |
|---|---|---|
| HMEC-1 | 159 ± 78 | 0.54 ± 0.08 |
| HMEC-1/HHO-1-AS | 265 ± 92* | 0.30 ± 0.12* |
| HMEC-1/HHO-1-S | 92 ± 63* | 1.69 ± 0.13* |
HMEC-1 cells nontransduced or transduced with HOP-driven HHO-1-S (HMEC-1/HHO-1-S) and HOP-driven HHO-1-AS (HMEC-1/HHO-1-AS) were treated with heme (10 μM) for 24 h. Heme content and HO activity were measured as described in Materials and Methods.
, P < 0.05 vs. nontransduced HMEC-1 cells. Values are expressed as means ± SD of three experiments.
Figure 6.
CO production in HMEC-1 cells nontransduced or transduced with HO-1 S (LSN-HOP-HHO-1) or HO-1 AS (LSN-HOP-HHO-1-AS). Measurement of CO production is described in Materials and Methods. CO production is expressed as means ± SD of four experiments. *, P < 0.05 vs. control HMEC-1 cells.
Discussion
We describe in the present report the construction of a functional retroviral delivery system for transducing animal and human endothelial cells with the HHO-1 gene in S and AS orientation. Cells transduced with the retroviral-HHO-1 construct in S orientation displayed enhanced heme oxidation activity resulting in a significant decrease in the amount of unmetabolized residual heme in cell cultures to which this natural substrate of HO was added. Employing a microassay procedure for quantitating CO, it was determined that production of CO was significantly enhanced consistent with an increased rate of heme catabolism in the HHO-1-transduced cells. In contrast, the delivery of the retroviral-HHO-1 AS construct to the cultured human cells led to a substantial decline in HO protein expression and HO activity reflected in a decreased rate of catabolism of exogenous heme by the transduced cells and a decrease in CO production. This effect was demonstrated in 11 sequential cell passages and can be presumed to be “permanent.” The results, taken as a whole, indicate that it is possible to up-regulate and down-regulate human HO-1 expression in cells for long periods of time with retroviral HHO-1 S and AS gene constructs.
The availability of a HHO-1 gene delivery system carrying S or AS nucleotide sequences offers many possibilities for experimental examination of the relation of HHO activity to various physiological processes. For example, the administration of HO-1 inducers is known to lower blood pressure and enhance tissue growth in spontaneously hypertensive rats (31), whereas the administration of HO-1 inhibitors produces systemic vasoconstriction (32–34). These effects have been correlated with the levels of cellular heme and one of the end products of heme catabolism, CO. An important role for HO in the control of vascular tone and blood pressure and in the regulation of growth is indicated by these findings. However, the use of metal inducers, heme, and metalloporphyrins to manipulate HO activity is far from specifically targeting HO. These agents can affect processes unrelated to HO expression and activity, such as guanylate cyclase and nitric oxide production, which, by themselves, can contribute to the effects seen in response to these agents. To this end, we and others have embarked on developing means that specifically target the expression and activity of HO in an isoform and site specific manner. We have constructed an adenoviral-HO-1 gene vector carrying human HO-1 and demonstrated its efficiency in increasing HO-1 gene expression and HO activity in vitro (35) and in vivo (36, 37). The effect, however, is short-lasting (2 to 4 weeks). In contrast, retroviral gene transfer offers long lasting expression of the gene being carried (31, 38). The availability of retroviral vectors expressing HHO-1 S and AS thus offers a means to assess the long-term consequences on physiological processes of sustained alterations in human HO activity.
The use of a retroviral HHO-1 AS gene construct to down-regulate bilirubin production in patients with the Crigler–Najjar type I syndrome may ultimately be possible and would offer, at the clinical level, a potential therapeutic approach to this lethal hereditary liver disease. In this disorder, the absence of bilirubin-conjugating ability results in sustained high plasma levels of bilirubin in a clinical context characterized by abrupt, severe exacerbations of hyperbilirubinemia which may lead to intractable neurological damage or death. It has been possible, with the use of inhibitors of HO such as tin mesoporphyrin, to produce moderately sustained declines in plasma bilirubin levels in these patients but this effect is inevitably transient (39). HO inhibitors used to interdict bilirubin production simultaneously lead to bilary excretion of heme, so that toxic tissue accumulations of heme do not occur (40). The availability of a clinically effective retroviral HHO-1 AS gene construct would open the potential of a longer term management modality for this hereditary disorder that could prove therapeutically useful pending the ultimate development of a gene-transfer technique for enhancing bilirubin-conjugating ability in these patients.
Acknowledgments
This work was supported by National Institutes of Health Grants RO1 DK56601 and PO1 HL34300, and by American Heart Association Grant 50948T.
Abbreviations
- HO
heme oxygenase
- HOP
HO-1 transcriptional-regulatory sequence
- HHO-1
human HO-1
- S
sense
- AS
antisense
- HMEC-1 cells
human dermal microvessel endothelial cells
- RLMV cells
rat lung microvessel endothelial cells
- LSN-HHO-1
long terminal repeat promoter-driven HHO-1 sense
- RT
reverse transcription
- neor
neomycin resistance
- G3PDH
glyceraldehyde-3-phosphate dehydrogenase
References
- 1.Tenhunen R, Marver H S, Schmid R. J Lab Clin Med. 1970;75:410–412. [PubMed] [Google Scholar]
- 2.Yoshida T, Kikuchi G. J Biol Chem. 1978;253:4224–4229. [PubMed] [Google Scholar]
- 3.Yoshinaga T, Sassa S, Kappas A. J Biol Chem. 1982;257:7786–7793. [PubMed] [Google Scholar]
- 4.Abraham N G, Drummond G S, Lutton J D, Kappas A. Cell Physiol Biochem. 1996;6:129–168. [Google Scholar]
- 5.Yoshinaga T, Sassa S, Kappas A. J Biol Chem. 1982;257:7778–7785. [PubMed] [Google Scholar]
- 6.McCoubrey W K, Jr, Ewing J F, Maines M D. Arch Biochem Biophys. 1992;295:13–20. doi: 10.1016/0003-9861(92)90481-b. [DOI] [PubMed] [Google Scholar]
- 7.Maines M D. FASEB J. 1988;2:2557–2568. [PubMed] [Google Scholar]
- 8.Shibahara S, Yoshizawa M, Suzuki H, Takeda K, Meguro K, Endo K. J Biochem Tokyo. 1993;113:214–218. doi: 10.1093/oxfordjournals.jbchem.a124028. [DOI] [PubMed] [Google Scholar]
- 9.Dwyer B E, Nishimura R N, De Vellis J, Yoshida T. Glia. 1992;5:300–305. doi: 10.1002/glia.440050407. [DOI] [PubMed] [Google Scholar]
- 10.Shibahara S, Muller M, Taguchi H. J Biol Chem. 1987;262:12889–12892. [PubMed] [Google Scholar]
- 11.Mitani K, Fujita H, Sassa S, Kappas A. Biochem Biophys Res Commun. 1989;165:437–441. doi: 10.1016/0006-291x(89)91089-9. [DOI] [PubMed] [Google Scholar]
- 12.Maines M D, Kappas A. Proc Natl Acad Sci USA. 1974;71:4293–4297. doi: 10.1073/pnas.71.11.4293. [DOI] [PMC free article] [PubMed] [Google Scholar]
- 13.Choi A M K, Alam J. Am J Respir Cell Mol Biol. 1996;15:9–19. doi: 10.1165/ajrcmb.15.1.8679227. [DOI] [PubMed] [Google Scholar]
- 14.Lutton J D, da Silva J-L, Moqattash S, Brown A C, Levere R D, Abraham N G. J Cell Biochem. 1992;49:259–265. doi: 10.1002/jcb.240490308. [DOI] [PubMed] [Google Scholar]
- 15.Neil T K, Stoltz R A, Jiang S, Laniado-Schwartzman M, Dunn M W, Levere R D, Kappas A, Abraham N G. J Ocul Pharmacol Ther. 1995;11:455–468. doi: 10.1089/jop.1995.11.455. [DOI] [PubMed] [Google Scholar]
- 16.Dennery P A, Sridhar K J, Lee C S, Wong H E, Shokoohi V, Rodgers P A, Spitz D R. J Biol Chem. 1997;272:14937–14942. doi: 10.1074/jbc.272.23.14937. [DOI] [PubMed] [Google Scholar]
- 17.Lu T H, Lambrecht R W, Pepe J, Shan Y, Kim T, Bonkovsky H L. Gene. 1998;207:177–186. doi: 10.1016/s0378-1119(97)00623-9. [DOI] [PubMed] [Google Scholar]
- 18.McCoubrey W K, Jr, Huang T J, Maines M D. Eur J Biochem. 1997;247:725–732. doi: 10.1111/j.1432-1033.1997.00725.x. [DOI] [PubMed] [Google Scholar]
- 19.Kappas A, Drummond G. J Clin Invest. 1986;77:335–339. doi: 10.1172/JCI112309. [DOI] [PMC free article] [PubMed] [Google Scholar]
- 20.Kappas A, Drummond G S. Proceedings of the Fifth International Symposium on Microsomes and Drug Oxidations: Microsomes, Drug Oxidations, and Drug Toxicity, ed. Japan Scientific Societies Press. Tokyo: Wiley-Interscience; 1982. pp. 629–636. [Google Scholar]
- 21.Kappas A, Drummond G S, Henschke C, Petmezaki S, Valaes T. In: Proceedings of the 2nd World Congress of Perinatal Medicine. Cosmi E V, DiRenzo G C, editors. Rome: Parthenon; 1994. pp. 623–629. [Google Scholar]
- 22.Kappas A, Drummond G S, Henschke C, Valaes T. Pediatrics. 1995;95:468–474. [PubMed] [Google Scholar]
- 23.Kappas A, Drummond G S, Valaes J. Pediatrics. 2001;106:25–30. doi: 10.1542/peds.108.1.25. [DOI] [PubMed] [Google Scholar]
- 24.Yang L, Quan S, Abraham N G. Am J Physiol. 1999;277:L127–L133. doi: 10.1152/ajplung.1999.277.1.L127. [DOI] [PubMed] [Google Scholar]
- 25.Markowitz D S, Goff D S, Bank A. Virology. 1988;167:400–406. [PubMed] [Google Scholar]
- 26.Abraham N G, Lin J H, Dunn M W, Schwartzman M L. Invest Ophthalmol Vis Sci. 1987;28:1464–1472. [PubMed] [Google Scholar]
- 27.Chernick R J, Martasek P, Levere R D, Margreiter R, Abraham N G. Hepatology. 1989;10:365–369. doi: 10.1002/hep.1840100320. [DOI] [PubMed] [Google Scholar]
- 28.Zhang F, Kaide J-I, Wei Y, Jiang H, Yu C, Balazy M, Abraham N G, Wang W, Nasjletti W. Am J Physiol Heart Circ Physiol. 2001;281:H350–H358. doi: 10.1152/ajpheart.2001.281.1.H350. [DOI] [PubMed] [Google Scholar]
- 29.Fuhrop J H, Smith K M. In: Porphyrins and Metalloporphyrins. Smith K M, editor. New York: Elsevier Scientific; 1975. pp. 804–807. [Google Scholar]
- 30.Lavrovsky Y, Schwartzman M L, Levere R D, Kappas A, Abraham N G. Proc Natl Acad Sci USA. 1994;91:5987–5991. doi: 10.1073/pnas.91.13.5987. [DOI] [PMC free article] [PubMed] [Google Scholar]
- 31.Sabaawy H E, Zhang F, Nguyen X, Elhosseiny A, Nasjletti A, Schwartzman M, Dennery P, Kappas A, Abraham N. Hypertension. 2001;38:210–215. doi: 10.1161/01.hyp.38.2.210. [DOI] [PubMed] [Google Scholar]
- 32.Levere R D, Martasek P, Escalante B, Schwartzman M L, Abraham N G. J Clin Invest. 1990;86:213–219. doi: 10.1172/JCI114686. [DOI] [PMC free article] [PubMed] [Google Scholar]
- 33.Sacerdoti D, Escalante B, Abraham N G, McGiff J C, Levere R D, Schwartzman M L. Science. 1989;243:388–390. doi: 10.1126/science.2492116. [DOI] [PubMed] [Google Scholar]
- 34.Martasek P, Schwartzman M L, Goodman A I, Solangi K B, Levere R D, Abraham N G. J Am Soc Nephrol. 1991;2:1078–1084. doi: 10.1681/ASN.V261078. [DOI] [PubMed] [Google Scholar]
- 35.Abraham N G, da Silva J L, Lavrovsky Y, Stoltz R A, Kappas A, Dunn M W, Schwartzman M L. Invest Ophthalmol Vis Sci. 1995;36:2202–2210. [PubMed] [Google Scholar]
- 36.Abraham N G, Jiang S, Yang L, Zand B A, Laniado-Schwartzman M, Marji J, Drummond G S, Kappas A. J Pharmacol Exp Ther. 2000;293:494–500. [PubMed] [Google Scholar]
- 37.Abraham N G, da Silva J L, Dunn M W, Kigasawa K, Shibahara S. Int J Mol Med. 1998;1:657–663. doi: 10.3892/ijmm.1.4.657. [DOI] [PubMed] [Google Scholar]
- 38.Chertkov J L, Jiang S, Lutton J D, Harrison J, Levere R D, Tiefenthaler M, Abraham N G. Stem Cells (Dayton) 1993;11:218–227. doi: 10.1002/stem.5530110309. [DOI] [PubMed] [Google Scholar]
- 39.Galbraith R A, Drummond G S, Kappas A. Pediatrics. 1992;89:175–182. [PubMed] [Google Scholar]
- 40.Kappas A, Simionatto C S, Drummond G S, Sassa S, Anderson K E. Proc Natl Acad Sci USA. 1985;82:896–900. doi: 10.1073/pnas.82.3.896. [DOI] [PMC free article] [PubMed] [Google Scholar]


