

Abstract
The advent of hybrid scanners, combining complementary modalities, has revolutionized the application of advanced imaging technology to clinical practice and biomedical research. In this project, we investigated the melding of two complementary, functional imaging methods: positron emission tomography (PET) and electron paramagnetic resonance imaging (EPRI). PET radiotracers can provide important information about cellular parameters, such as glucose metabolism. While EPR probes can provide assessment of tissue microenvironment, measuring oxygenation and pH, for example. Therefore, a combined PET/EPRI scanner promises to provide new insights not attainable with current imagers by simultaneous acquisition of multiple components of tissue microenvironments. To explore the simultaneous acquisition of PET and EPR images, a prototype system was created by combining two existing scanners. Specifically, a silicon photomultiplier (SiPM)-based PET scanner ring designed as a portable scanner was combined with an EPRI scanner designed for the imaging of small animals. The ability of the system to obtain simultaneous images was assessed with a small phantom consisting of four cylinders containing both a PET tracer and EPR spin probe. The resulting images demonstrated the ability to obtain contemporaneous PET and EPR images without cross-modality interference. Given the promising results from this initial investigation, the next step in this project is the construction of the next generation pre-clinical PET/EPRI scanner for multi-parametric assessment of physiologically-important parameters of tissue microenvironments.
I. Introduction
Adaptation of advanced clinical imaging methods for use with small animals transformed translational research. No longer are large numbers of animals necessary to perform many biomedical experiments. Most small animal scanners combine an anatomical imaging modality (magnetic resonance imaging (MRI) or x-ray computed tomography (CT), for example) with a complementary functional imaging method (positron emission tomography (PET) or optical imaging, for example). In this investigation, we explored the combination of two complementary, functional imaging methods: PET and electron paramagnetic resonance imaging (EPRI).
PET utilizes administration of pico-molar concentrations of positron-emitting radiotracers and can be used to measure numerous physiologic parameters such as glycolysis rates (Wu et al 1995), DNA synthesis (Toyohara et al 2012) and cell replication rates (Wells et al 2002). EPRI enables interrogation of electron spins in free radicals that, when used in combination with paramagnetic probes, is an accurate method for quantifying components of tissue microenvironments (Khramtsov et al 2017). Among the most promising of these probes are triarylmethyl radicals that possess very good stability, long relaxation times and narrow line widths (enhancing sensitivity and spatial resolution) (Ardenkjaer-Larsen et al 1998). EPR probes can be used to investigate extracellular (Epel et al 2017a; Bobko et al 2017a and Marchand et al 2017) or intracellular (Driesschaert et al 2016) components of tissue microenvironments, such as pO2, pH, and phosphate concentration (Pi) (Khramtsov 2017 and Kishimoto et al 2017). These parameters are especially important because they characterize tissue microenvironments in cancer (Eckert et al 2016; Chano et al 2016; Khramtsov and Gillies 2014) and heart disease (Sekine et al 2014; Nadtochiy et al 2015 and Gorodetsky et al 2016).
Combination of PET and EPRI, could enable simultaneous measurement of important intra- and extracellular components of tissue microenvironments (glucose consumption rate, hypoxia and acidosis, for example). Thus, a pre-clinical PET/EPRI scanner has the potential to be a powerful tool for performing novel, in vivo investigations of biological systems, potentially leading to insights that can be translated into improved understanding of normal physiology, and methods for enhancing diagnosis and treatments of diseases. It is particularly important that the PET and EPRI data are acquired as temporally aligned as possible since the biochemical milieu of an animal is not static. Physiological parameters, such as glucose metabolism, pH, Pi and pO2 levels may vary over short time periods (minutes to tens of minutes (Ewald et al 2011; Constantinides et al 2011 and Bobko et al 2017b). Therefore, to ensure accurate, synchronized and unbiased measurements of interactions among components of physiology, it is important to perform simultaneous imaging to capture their correlated temporal evolution. Simultaneous scanning also facilitates accurate measurement of complex physiological responses to controlled administration of a chemical stimulus (Halpern et al 1996 and Bobko et al 2017b) that momentarily perturbs the animal’s biochemistry. Additionally, the combination of both systems into a single unit, simplifies the co-registration process, since both scanners share a coordinate system. Finally, simultaneous scanning increases the efficiency of the imaging process, which is important if many animals must be scanned in a short amount of time. In this investigation, we describe the creation and initial testing of a prototype pre-clinical PET/EPRI scanner.
II. Methods
Positron Emission Tomography Scanner
The PET scanner used in this study was constructed at West Virginia University as part of a continuing effort to produce images of the brains of ambulatory subjects (Bauer et al 2013). It consists of a ring of twelve detector modules (inner diameter= 21 cm). Each module contains a 32 × 32 array of polished LYSO detector elements (1.5 mm × 1.5 mm × 10 mm), separated by 0.07 mm thick ESR reflector (Proteus, Chagrin Falls, OH). The twelve scintillation blocks are individually coupled to 10 × 10 arrays of 3 mm × 3 mm (4.85 mm pitch) S10362-series MPPCs (multi-pixel photon counters) (Hamamatsu Photonics, Shizuoka, Japan). The MPPCs are readout with multiplexed, 4ch-readout electronics (AiT Instruments, Newport News VA). The forty-eight amplified analog signals are digitized with an FPGA-based, 64-channel data acquisition module (AiT Instruments, Newport News, VA) (Proffitt et al 2005 and Proffitt et al 2006). Digitization is initiated by a TTL signal generated by a sixteen channel, Mesytec MCFD-16 NIM module (Mesytec, Putzbrunn GmbH, Germany) (coincidence window= 10 ns) that determines coincidences between any two of the twelve detectors in the ring. Data acquisition is performed using Java programming language-based software (McKisson et al 2007) with a user interface created with the Kmax scientific programming package from Sparrow Corp. (Port Orange, FL).
For each coincident event, the identification of the detector elements struck by the annihilation photons are determined by performing center-of-mass calculations on the digitized light distributions detected by the MPPCs in conjunction with a previously measured calibration file mapping event position to detector element number (Bauer et al 2013). The amount of energy deposited by each photon in the scintillator is determined by converting the sum of the analog signals to energy with the aid of a pre-measured calibration table (Bauer et al 2013). The position and energy information is then stored in list mode format. These data are used to create three-dimensional maps of radiotracer distribution with the MLEM (Maximum-Likelihood Expectation-Maximization) iterative reconstruction algorithm (Smith et al 2004). The nominal image voxel size is 1.0 mm × 1.0 mm × 1.0 mm. The spatial resolution of the system is 2.2 mm (full width-at-half-maximum (FWHM) 5mm from center of scanner); peak detection sensitivity is 0.5% (Bauer et al 2013). The average timing resolution of the PET modules is 2.1 ns FWHM; note that the system does not have time-of-flight capabilities.
Electron Paramagnetic Resonance Imaging Scanner
The EPR imager was constructed at West Virginia University as part of an ongoing effort to explore and advance EPRI methodology. It utilizes the recently developed rapid scan (RS) EPR technique (RS-EPR) (Epel et al 2017b; Moser et al 2017; Tseytlin et al 2017; Biller et al 2015 and Elajaili et al 2015). RS-EPR improves signal-to-noise ratios of the measured spectra compared to the standard field-modulated, first-derivative method (Moser et al 2017; Biller et al 2015 and Mitchell et al 2013). Perhaps more importantly, it permits acquisition of many projections in a short amount of time. The RS-coil necessary to acquire these data consists of two, 100-turn coils of Litz wire (separated by 7 cm) wound on a 14 cm-diameter, 3D-printed Polylactic acid (PLA) hollow cylinder (wall thickness= 2 mm) to form a Helmholtz coil.
The EPRI configuration used for co-imaging with the PET system is similar to one previously described by Tseytlin, et al. (Tseytlin et al 2017). The EPRI resonator unit, shown in figure 1, is based on the design described by Hirata et al. (Hirata et al 2008). It consists of an RF surface loop (into which the sample is placed) connected to a distributed capacitor network containing two 50 Ohm coaxial cables and a coupling unit that matches the resonance structure to the 50 Ohm transmission line. The unit also contains a λ/2 balun. The constant magnetic field necessary to produce the EPR signals is supplied by a permanent dipole magnet (Ningbo Jansen NMR Technology, Co) (figure 1). It has a pole-to-pole gap of 12.5 cm and produces a magnetic field of ~268 G corresponding to ~750 MHz for an EPR spin probe with a g-factor of ~2. Elements of a Helmholtz coil are mounted on the magnet poles to facilitate fine tuning of the magnetic field up to ~293 G (820 MHz). Due to interference from cell phone signals (~750 MHz), a frequency of 800 MHz was chosen for our measurements. Three-dimensional locations of the spin probe were encoded via application of spatially varying magnetic fields supplied by three sets of gradient coils. The maximum magnetic field gradient used in imaging was 3 G/cm. The system is capable of sub-millimeter spatial resolution when narrow-line trityl spin probes are used.
Figure 1.

Photo of the surface coil resonator (RF surface loop and RF coupler) and phantom.
The imager was calibrated using standard procedures. Specifically, the rapid scan width was verified by measuring hyperfine lines of the trityl ‘Finland’ radical (Bowman et al 2005). The gradients were calibrated by imaging of point-like particles of lithium octa-n-butoxynaphthalocyanine (LiNC-Buo), which produce EPR signals, arrayed in a cubic grid separated by known distances along the x, y, and z axes (Pandian et al 2003). These procedures facilitated production of three-dimensional maps of pO2 and probe concentration based on the data acquired by the system.
The EPR spectra of the probe used in this investigation has two components, Gaussian and Lorentzian. The width of the Lorentzian component (EPRI-Lw) was extracted from the spectral data using a line fitting procedure (Khramtsov et al 2017); its value is related to the presence of oxygen, or other paramagnetic compounds. The integral of the EPR spectra intensity is related to probe concentration (EPRI-Conc). Four-dimensional images (three spatial axes and one spectral) of EPRI-Lw and EPRI-Conc were reconstructed using the iterative backprojection method (Komarov et al 2017). This technique requires more computational time than the standard filtered back-projection method (1–2 hours), but is less likely to produce image artifacts. The nominal EPRI image voxel size is 0.25 mm × 0.25 mm × 0.25 mm.
Multi-Modality Phantom
To explore the capabilities of the PET/ERPI scanner, a multi-modality phantom was designed and fabricated with a FormLabs (Somerville, MA USA) Form 2 3D printer. A digital model of the phantom is shown in figure 2. It has an outer diameter of 10.7 mm and contains four 254 μl cylinders (3 mm inner diameter; length= 36 mmm; center-to-center distance= 4.6 mm). The cylinders were filled with specially-formulated, PET-EPR imaging solution. Specifically, an oxygen reporting spin probe, per-deuterated ‘Finland’ triarylmethyl (trityl) radical (dFT) (Dhimitruka et al 2010), was used to produce EPR signals. Since it is difficult to accurately control oxygen concentration in the phantom, 1 mM of gadolinium contrast agent (Gd-DTPA, BioPAL, Worcester, MA USA) was added to 1 mM of dFT to emulate the presence of oxygen. Gadolinium shortens the relaxation times of the EPR probe by the same exchange interaction mechanism as oxygen. The PET radiotracer 18F-FDG was added to the EPR probe solution to create the dual-modality tracer.
Figure 2.
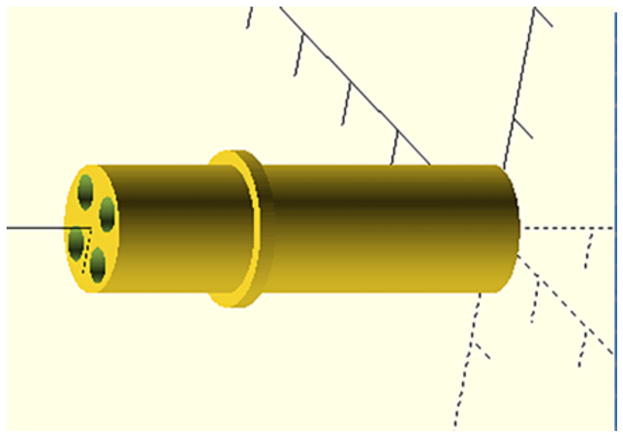
Mechanical drawing used to 3D-print the phantom.
Two variants of PET-EPRI imaging solution were created. One contained 1mM of dFT, 1 mM of Gd and 25 μCi of FDG (defined as the Gd+F− solution). The second contained 1 mM of dFT and 49 μCi of FDG (defined as the GdoF+ solution). This concentration of dFT is comparable to that measured in vivo (Epel et al 2014). Indigenous oxygen in the solutions was removed by adding glucose (10 mM, Sigma Aldrich, Cleveland, OH USA) and glucose oxidase (500 U/ml, Sigma Aldrich, Cleveland, OH USA). To make up the required volume of the samples (254 μl), appropriate amounts of 0.1 M Na-phosphate buffer (pH= 7.4) were added. The phantom was filled such that diagonally opposed cylinders contained the same solution type.
Dual-Modality Scanner
To create the prototype PET/EPRI scanner, the PET detector ring was placed in the center of the dipole magnet (to permit access to the center of the PET scanner, it was tilted by approximately 20°) (figure 3). The EPR system’s rapid scan (RS) coils were placed in the center of the PET ring. The EPR RF loop holding the phantom (see figure 1) was inserted into the center of the PET-RS-coil combination. The orientation of the RF field is parallel to the axis of the loop. PET and EPRI data were obtained simultaneously (3 min scans). Images were created as described above. Following the PET-EPRI scan, the phantom was placed in a 1 T small animal ICON® MRI scanner (Bruker, Billerica, MA USA) (T1 FLASH; TR= 41 ms; TE= 4.8 ms; flip angle= 30°; image voxel size= 0.25 mm × 0.25 mm × 2.4 mm). Prior to registration, the MR, PET and EPR images underwent rigid body rotation and scaling based on their relative orientations and image pixel sizes. Registration was performed by overlaying the transformed images utilizing the Photoshop® image processing software (San Jose, CA USA). Automated image registration software is currently under investigation for use in future generations of the scanner. While PET and EPRI can produce quantitative images, for this initial investigation we chose to only make qualitative comparisons between images from the modalities to simplify imaging processing. Thus, image intensities are utilized to represent relative radiotracer concentration, dFT probe concentration and simulated oxygen concentration.
Figure 3.

Picture of the complete PET-EPRI system (PET scanner combined with the EPR resonator shown in figure 1). The orientation of the magnetic field is shown.
III. Results
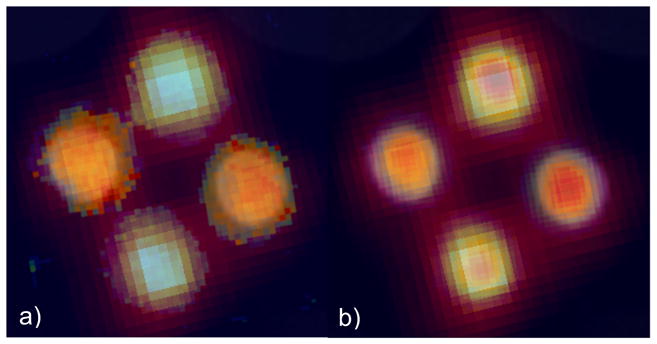
Figure 4(a) shows the T1-weigted MRI image of the phantom (the light gray semicircles at the top corners are images of two small vials of water included with the phantom to facilitate tuning of the MRI scanner). The PET image in figure 4(b) illustrates the differences in FDG concentration of the two solutions based on relative image intensity. Importantly, there are no photon attenuation artifacts apparent in the images. Figure 4(c) shows a map of the Lorentzian contribution to the EPR signal line width (EPRI-Lw), which is related to pO2 in the sample (line width is measured in milli-Gauss). The image in figure 4(d) is a map of the intensity integral of the EPR spectra related to the concentration of dFT in the solutions (EPRI-Conc). Figure 5 shows registered PET, EPR (both modes) and MR images.
Figure 4.

PET-EPR images of the multi-modality phantom: a) MRI image showing the presence and absence of Gd (Gd+ or Gdo), and the presence of high or low concentration of 18F (F+ or F−), b) PET image (image intensity is related to FDG concentration), c) EPR image of Lorentzian line width (EPRI-Lw) (image intensity is related to oxygen concentration simulated using Gd) and d) EPR image of dFT concentration (image intensity is related to dFT concentration).
Figure 5.
Registered images combining: a) MRI, PET and EPRI-Lw and b) MRI, PET and EPRI-Conc.
IV. Discussion
Combined PET and EPRI imaging has the potential to open new avenues of biomedical research. It could be used to explore various physiologically-important parameters of tissue microenvironments, potentially leading to novel insights into disease origins and progression. The results from our initial study of a prototype PET/EPRI scanner demonstrates the feasibility of performing simultaneous assessment of these parameters without any apparent cross-modality interference.
Figures 1, 2 and 3 show the PET/EPRI system and phantom used in this investigation. Unlike the PET-Overhauser-MRI system described by Yamamoto, et al., our PET scanner is based on solid state-SiPM detectors (Yamamoto et al 2016). Figures 4b–d illustrate the variety, and potential utility of images obtainable from a PET/EPRI scanner. Specifically, the PET image in figure 4(b) indicates the system’s ability to map areas of positron-emitter by correctly identify the relative concentrations of FDG present in the cylinders based on image intensity. The resolution of the image is somewhat compromised by the relatively low resolution of the PET scanner. The relative intensities of the spectral-line-width EPR images (EPRI-Lw) of the cylinders shown in figure 4(c) demonstrates the ability of the system to map oxygen concentration (simulated by the addition of Gd). Note that the cylinders that show the highest concentration of gadolinium (based on image intensity) correctly correspond to the cylinders with lowest FDG concentration (Gd+F−). This finding is compatible with MRI image (figure 4(a)). Specifically, the cylinders with higher MR signal correspond to the cylinders containing the gadolinium, which is an MR contrast agent. The probe-concentration-EPR image (EPRI-Conc) (figure 4(d)) shows, correctly, that there is little difference in probe concentration among the cylinders, based on their relative image intensities. The small intensity differences observed in this image are due to the non-uniformity in resonator loop sensitivity as a function of position inside the loop. Thus, the images in figure 4 illustrate the ability of the system to simultaneously interrogate different functional properties reported by an EPR probe, in conjunction with assessment of PET tracer uptake.
There are no artifacts present in the PET and EPR images. This finding is likely due to the low static magnetic field (~285 G), relatively low strength magnetic gradients (3 G/cm) and high frequency RF (800 MHz) used in EPRI, which are unlikely to result in interactions with the PET electronics or SiPMs. The lack of photon attenuation artifacts in the PET images is due to the small size of the phantom and use of thin, low-density materials used in the construction of the RS-coils (the only component of the EPRI scanner in the PET scanner’s field-of-view). Furthermore, there are no active elements of the PET scanner present inside the sensitive volume of the EPRI scanner, so the likelihood of PET-related effects on EPR images is significantly reduced. Finally, the ability to spatially, as well as temporally, correlate multiple parameters of tissue microenvironments, such as those assessed in this study is illustrated by the images shown in figure 5.
V. Conclusion
The findings from this initial investigation showed that the combination of PET and EPRI is possible. We demonstrated that simultaneous data acquisitions facilitated the localization of complementary intra- and extra-cellular probes. PET/EPRI, therefore, could potentially enable novel investigations exploring the dynamics of tissue microenvironments. The individual components of our initial prototype system both suffer from relatively low spatial resolution and detection sensitivity. Thus, the next step in our continuing effort to develop a pre-clinical PET/EPRI scanner is construction of a compact, EPR-compatible PET system based on a monolithic annulus of scintillator (Stolin et al 2017) possessing higher resolution and detection sensitivity than the current scanner. Additionally, a higher resolution, higher and more spatially-uniform sensitivity resonator will be created. Continued development of the system will also include application of established methods for quantifying and co-registering PET, EPR and MR images.
Acknowledgments
The authors thank Dr. B. Driesschaert for synthesis of the trityl radicals used in our measurements; and Drs. D. Komarov and H. Hirata for providing image reconstruction software. This work was supported by NIH/NIBIB R21 EB022775, NIH/GMS U54 GM104942, NIH U546 M104942, NIH P30 GM103503, NIH/NIMH R24MH106057, CA194013 and CA192064.
References
- Ardenkjaer-Larsen JH, Laursen I, Leunbach I, Ehnholm G, Wistrand LG, Petersson JS, Golman K. EPR and DNP properties of certain novel single electron contrast agents intended for oximetric imaging. J Magn Reson. 1998;133:1–12. doi: 10.1006/jmre.1998.1438. [DOI] [PubMed] [Google Scholar]
- Bauer C, Stolin A, Proffitt J, Martone P, Brefczynski-Lewis J, Lewis J, Hankiewicz J, Raylman R, Majewski S. Development of a Ring PET Insert for MRI. IEEE Nucl Sci Symp Conf Rec. 2013;9:101–8. [Google Scholar]
- Biller JR, Tseitlin M, Mitchell DG, Yu Z, Buchanan LA, Elajaili H, Rosen GM, Kao JP, Eaton SS, Eaton GR. Improved sensitivity for imaging spin trapped hydroxyl radical at 250 MHz. Chemphyschem: a European journal of chemical physics and physical chemistry. 2015;16:528–31. doi: 10.1002/cphc.201402835. [DOI] [PMC free article] [PubMed] [Google Scholar]
- Bobko AA, Eubank TD, Driesschaert B, Dhimitruka I, Evans J, Mohammad R, Tchekneva EE, Dikov MM, Khramtsov VV. Interstitial Inorganic Phosphate as a Tumor Microenvironment Marker for Tumor Progression. Sci Rep. 2017a;7:41233. doi: 10.1038/srep41233. [DOI] [PMC free article] [PubMed] [Google Scholar]
- Bobko AA, Evans J, Denko NC, Khramtsov VV. Concurrent Longitudinal EPR Monitoring of Tissue Oxygenation, Acidosis, and Reducing Capacity in Mouse Xenograft Tumor Models. Cell Biochem Biophys. 2017b;75:247–53. doi: 10.1007/s12013-016-0733-x. [DOI] [PMC free article] [PubMed] [Google Scholar]
- Bowman MK, Mailer C, Halpern HJ. The solution conformation of triarylmethyl radicals. J Magn Reson. 2005;172:254–67. doi: 10.1016/j.jmr.2004.10.010. [DOI] [PubMed] [Google Scholar]
- Chano T, Avnet S, Kusuzaki K, Bonuccelli G, Sonveaux P, Rotili D, Mai A, Baldini N. Tumour-specific metabolic adaptation to acidosis is coupled to epigenetic stability in osteosarcoma cells. Am J Cancer Res. 2016;6:859–75. [PMC free article] [PubMed] [Google Scholar]
- Constantinides C, Mean R, Janssen BJ. Effects of isoflurane anesthesia on the cardiovascular function of the C57BL/6 mouse. ILAR journal. 2011;52:e21–31. [PMC free article] [PubMed] [Google Scholar]
- Dhimitruka I, Grigorieva O, Zweier JL, Khramtsov VV. Synthesis, structure, and EPR characterization of deuterated derivatives of Finland trityl radical. Bioorg Med Chem Lett. 2010;20:3946–9. doi: 10.1016/j.bmcl.2010.05.006. [DOI] [PMC free article] [PubMed] [Google Scholar]
- Driesschaert B, Bobko AA, Eubank TD, Samouilov A, Khramtsov VV, Zweier JL. Poly-arginine conjugated triarylmethyl radical as intracellular spin label. Bioorg Med Chem Lett. 2016;26:1742–4. doi: 10.1016/j.bmcl.2016.02.048. [DOI] [PMC free article] [PubMed] [Google Scholar]
- Eckert AW, Wickenhauser C, Salins PC, Kappler M, Bukur J, Seliger B. Clinical relevance of the tumor microenvironment and immune escape of oral squamous cell carcinoma. J Transl Med. 2016;14:85. doi: 10.1186/s12967-016-0828-6. [DOI] [PMC free article] [PubMed] [Google Scholar]
- Elajaili HB, Biller JR, Tseitlin M, Dhimitruka I, Khramtsov VV, Eaton SS, Eaton GR. Electron spin relaxation times and rapid scan EPR imaging of pH-sensitive amino-substituted trityl radicals. Magnetic resonance in chemistry: MRC. 2015;53:280–4. doi: 10.1002/mrc.4193. [DOI] [PMC free article] [PubMed] [Google Scholar]
- Epel B, Bowman MK, Mailer C, Halpern HJ. Absolute oxygen R1e imaging in vivo with pulse electron paramagnetic resonance. Magn Reson Med. 2014;72:362–8. doi: 10.1002/mrm.24926. [DOI] [PMC free article] [PubMed] [Google Scholar]
- Epel B, Krzykawska-Serda M, Tormyshev V, Maggio MC, Barth ED, Pelizzari CA, Halpern HJ. Spin Lattice Relaxation EPR pO(2) Images May Direct the Location of Radiation Tumor Boosts to Enhance Tumor Cure. Cell Biochemistry and Biophysics. 2017a;75:295–8. doi: 10.1007/s12013-017-0825-2. [DOI] [PubMed] [Google Scholar]
- Epel B, Sundramoorthy SV, Krzykawska-Serda M, Maggio MC, Tseytlin M, Eaton GR, Eaton SS, Rosen GM, JPYK, Halpern HJ. Imaging thiol redox status in murine tumors in vivo with rapid-scan electron paramagnetic resonance. J Magn Reson. 2017b;276:31–6. doi: 10.1016/j.jmr.2016.12.015. [DOI] [PMC free article] [PubMed] [Google Scholar]
- Ewald AJ, Werb Z, Egeblad M. Monitoring of vital signs for long-term survival of mice under anesthesia. Cold Spring Harbor protocols. 2011;2011 doi: 10.1101/pdb.prot5563. pdb.prot5563. [DOI] [PMC free article] [PubMed] [Google Scholar]
- Gorodetsky AA, Kirilyuk IA, Khramtsov VV, Komarov DA. Functional Electron Paramagnetic Resonance Imaging of Ischemic Rat Heart: Monitoring of Tissue Oxygenation and pH. Magn Reson Med. 2016;76:350–8. doi: 10.1002/mrm.25867. [DOI] [PMC free article] [PubMed] [Google Scholar]
- Halpern HJ, Yu C, Peric M, Barth ED, Karczmar GS, River JN, Grdina DJ, Teicher BA. Measurement of differences in pO(2) in response to perfluorocarbon carbogen in FSa and NFSa murine fibrosarcomas with low-frequency electron paramagnetic resonance oximetry. Radiat Res. 1996;145:610–8. [PubMed] [Google Scholar]
- Hirata H, He G, Deng Y, Salikhov I, Petryakov S, Zweier JL. A loop resonator for slice-selective in vivo EPR imaging in rats. J Magn Reson. 2008;190:124–34. doi: 10.1016/j.jmr.2007.10.012. [DOI] [PMC free article] [PubMed] [Google Scholar]
- Khramtsov VV. In vivo molecular EPR-based spectroscopy and imaging of tumor microenvironment and redox using functional paramagnetic probes. Antioxid Redox Signal. 2017 doi: 10.1089/ars.2017.7329. [DOI] [PMC free article] [PubMed] [Google Scholar]
- Khramtsov VV, Bobko AA, Tseytlin M, Driesschaert B. Exchange Phenomena in the Electron Paramagnetic Resonance Spectra of the Nitroxyl and Trityl Radicals: Multifunctional Spectroscopy and Imaging of Local Chemical Microenvironment. Anal Chem. 2017;89:4758–71. doi: 10.1021/acs.analchem.6b03796. [DOI] [PMC free article] [PubMed] [Google Scholar]
- Khramtsov VV, Gillies RJ. Janus-Faced Tumor Microenvironment and Redox. Antioxid Redox Signal. 2014;21:723–9. doi: 10.1089/ars.2014.5864. [DOI] [PMC free article] [PubMed] [Google Scholar]
- Kishimoto S, Matsumoto K, Saito K, Enomoto A, Matsumoto S, Mitchell JB, Nallathamby D, Krishna MC. Pulsed EPR imaging: applications in the studies of tumor physiology. Antioxid Redox Signal. 2017 doi: 10.1089/ars.2017.7391. [DOI] [PMC free article] [PubMed] [Google Scholar]
- Komarov DA, Hirata H. Fast backprojection-based reconstruction of spectral-spatial EPR images from projections with the constant sweep of a magnetic field. J Magn Reson. 2017;281:44–50. doi: 10.1016/j.jmr.2017.05.005. [DOI] [PubMed] [Google Scholar]
- Marchand V, Leveque P, Driesschaert B, Marchand-Brynaert J, Gallez B. In Vivo EPR Extracellular pH-metry in Tumors Using a Triphosphonated Trityl Radical. Magn Reson Med. 2017;77:2438–43. doi: 10.1002/mrm.26316. [DOI] [PubMed] [Google Scholar]
- McKisson JE, Hammond B, Proffitt J, Weisenberger AG, Smit M. A Java distributed acquisition system for PET and SPECT imaging. 2007 Ieee Nuclear Science Symposium Conference Record; 2007. p. 3591. [Google Scholar]
- Mitchell DG, Tseitlin M, Quine RW, Meyer V, Newton ME, Schnegg A, George B, Eaton SS, Eaton GR. X-Band Rapid-scan EPR of Samples with Long Electron Relaxation Times: A Comparison of Continuous Wave, Pulse, and Rapid-scan EPR. Mol Phys. 2013;111:2664–73. [Google Scholar]
- Moser J, Lips K, Tseytlin M, Eaton GR, Eaton SS, Schnegg A. Using rapid-scan EPR to improve the detection limit of quantitative EPR by more than one order of magnitude. J Magn Reson. 2017;281:17–25. doi: 10.1016/j.jmr.2017.04.003. [DOI] [PMC free article] [PubMed] [Google Scholar]
- Nadtochiy SM, Urciuoli W, Zhang J, Schafer X, Munger J, Brookes PS. Metabolomic profiling of the heart during acute ischemic preconditioning reveals a role for SIRT1 in rapid cardioprotective metabolic adaptation. J Mol Cell Cardiol. 2015;88:64–72. doi: 10.1016/j.yjmcc.2015.09.008. [DOI] [PMC free article] [PubMed] [Google Scholar]
- Pandian RP, Parinandi NL, Ilangovan G, Zweier JL, Kuppusamy P. Novel particulate spin probe for targeted determination of oxygen in cells and tissues. Free Radic Biol Med. 2003;35:1138–48. doi: 10.1016/s0891-5849(03)00496-9. [DOI] [PubMed] [Google Scholar]
- Proffitt J, Hammond W, Majewski S, Popov V, Raylman RR, Weisenberger AG. Implementation of a High-Rate USB Data Acquisition System for PET and SPECT Imaging. 2006 Ieee Nuclear Science Symposium Conference Record; 2006. pp. 3063–7. [Google Scholar]
- Proffitt J, Hammond W, Majewski S, Popov V, Raylman RR, Weisenberger AG, Wojcik R. A flexible high-rate USB2 data acquisition system for PET and SPECT imaging. Ieee Nucl Sci Conf R. 2005:2971–5. [Google Scholar]
- Sekine K, Kagawa Y, Maeyama E, Ota H, Haraguchi Y, Matsuura K, Shimizu T. Oxygen consumption of human heart cells in monolayer culture. Biochem Bioph Res Co. 2014;452:834–9. doi: 10.1016/j.bbrc.2014.09.018. [DOI] [PubMed] [Google Scholar]
- Smith MF, Raylman RR, Majewski S, Weisenberger AG. Positron emission mammography with tomographic acquisition using dual planar detectors: initial evaluations. Phys Med Biol. 2004;49:2437–52. doi: 10.1088/0031-9155/49/11/022. [DOI] [PubMed] [Google Scholar]
- Stolin AV, Martone PF, Jaliparthi G, Raylman RR. Preclinical positron emission tomography scanner based on a monolithic annulus of scintillator: initial design study. J Med Imaging (Bellingham) 2017;4:011007. doi: 10.1117/1.JMI.4.1.011007. [DOI] [PMC free article] [PubMed] [Google Scholar]
- Toyohara J, Elsinga PH, Ishiwata K, Sijbesma JW, Dierckx RA, van Waarde A. Evaluation of 4′-[methyl-11C]thiothymidine in a rodent tumor and inflammation model. J Nucl Med. 2012;53:488–94. doi: 10.2967/jnumed.111.098426. [DOI] [PubMed] [Google Scholar]
- Tseytlin M. Full cycle rapid scan EPR deconvolution algorithm. J Magn Reson. 2017;281:272–8. doi: 10.1016/j.jmr.2017.06.008. [DOI] [PMC free article] [PubMed] [Google Scholar]
- Wells JM, Mankoff DA, Eary JF, Spence AM, Muzi M, O’Sullivan F, Vernon CB, Link JM, Krohn KA. Kinetic analysis of 2-[11C]thymidine PET imaging studies of malignant brain tumors: preliminary patient results. Mol Imaging. 2002;1:145–50. doi: 10.1162/15353500200202115. [DOI] [PubMed] [Google Scholar]
- Wu HM, Huang SC, Choi Y, Hoh CK, Hawkins RA. A Modeling Method to Improve Quantitation of Fluorodeoxyglucose Uptake in Heterogeneous Tumor-Tissue. J Nucl Med. 1995;36:297–306. [PubMed] [Google Scholar]
- Yamamoto S, Watabe T, Ikeda H, Kanai Y, Ichikawa K, Nakao M, Kato K, Hatazawa J. Development of a PET/OMRI combined system for simultaneous imaging of positron and free radical probes for small animals. Med Phys. 2016;43:5676–5684. doi: 10.1118/1.4963215. [DOI] [PubMed] [Google Scholar]