

Abstract
A snake's body represents an extreme degree of elongation with immense muscle complexity. Snakes have approximately 25 different muscles on each side of the body at each vertebra. These muscles serially repeat, overlap, interconnect, and rarely insert parallel to the vertebral column. The angled muscles mean that simple measurements of anatomical cross‐sectional area (ACSA, perpendicular to the long‐axis of the body) serve only as proxies for the primary determinant of muscle force, physiological cross‐sectional area (PCSA, area perpendicular to the muscle fibers). Here, I describe and quantify the musculature of two intraguild constrictors: kingsnakes (Lampropeltis holbrooki) and ratsnakes (Pantherophis obsoletus) whose predation performance varies considerably. Kingsnakes can produce significantly higher constriction pressures compared with ratsnakes of similar size. In both snakes, I provide qualitative descriptions, detail previously undescribed complexity, identify a new lateral muscle, and provide some of the first quantitative measures of individual muscle and whole‐body PCSA. Furthermore, I compare measurements of ACSA with measurements of PCSA. There was no significant difference in PCSA of muscles between kingsnakes and ratsnakes. There is, however, a strong relationship between ACSA and PCSA measurements. I could not identify a significant difference in musculature between kingsnakes and ratsnakes that explains their different levels of constriction performance. Unmeasured components of muscle function, such as endurance and force production, might account for differences in performance between two species with similar muscle structure.
Keywords: anatomy, cross‐sectional area, Lampropeltis, muscle, Pantherophis, snake
Introduction
For vertebrates, movement is brought about through the use of musculature that spans the vertebral and appendicular skeletal elements (MacIntosh et al. 2006; Schilling, 2011). The absence of limbs in snakes relegates all of their movements to articulations of the head, vertebrae, ribs, and skin (Mosauer, 1935). Although the general body plan of snakes may appear simple, it represents an extreme degree of elongation (Mosauer, 1935; Jayne & Riley, 2007) with immense diversity in form and function (Greene, 1997; Cundall & Greene, 2000; Lillywhite, 2014). The muscle anatomy of snakes is highly derived and extraordinarily complex (Mosauer, 1935), so much so that snakes have been excluded from comparative work on the evolution of vertebrate musculature (Schilling, 2011).
Investigations into snake musculature span centuries (Tyson, 1682; Nicodemo, 2012), but few accounts have evaluated the anatomy of multiple muscles within a single species (Mosauer, 1935; Gasc, 1981). Many muscles span only one joint, but several muscles span multiple joints with tendons of one to over 30 vertebrae in length that connect to skeletal elements, connective tissues, other muscles, and skin (Mosauer, 1935; Gasc, 1981; Jayne, 1982). This arrangement of segmental muscles and tendons with complex interconnections allows sophisticated control of movements that involve few to many joints along the body (Jayne, 1988; Moon, 2000a,b; Young, 2010; Young & Kardong, 2010). Historically, snake musculature was generally grouped by clade (boid, viperid, and colubrid type anatomy; Mosauer, 1935), but this categorization is oversimplified (Auffenberg, 1958, 1966; Gasc, 1981) and we lack anatomical descriptions for most snake species. Snakes are an extraordinarily diverse and important group of vertebrates (Greene, 1997; Lillywhite, 2014), yet we have a very limited understanding of their musculoskeletal anatomy and function. Considering the paucity of anatomical studies, the importance of anatomy to performance (Herrel et al. 2008), and the continued need for detailed morphological data (Pyron, 2015), investigations describing and especially quantifying the musculature of snakes are desperately needed to better understand their evolution, function, and diversity.
Much of the recent work on muscle anatomy in snakes has focused on the linkages between muscle cross‐sectional area and measures of performance (Lourdais et al. 2005; Jayne & Riley, 2007; Herrel et al. 2011; Penning & Moon, 2017). Muscle cross‐sectional area is used as an indicator of muscle force production and is often measured by bisecting specimens (or through imaging techniques on live animals) perpendicular to the vertebral column (anatomical cross‐sectional area, ACSA). However, physiological cross‐sectional area (PCSA, which is the area perpendicular to the muscle fibers) is the primary determinant of muscle force production (MacIntosh et al. 2006) and can be very different from ACSA. These two measures are likely to be different because snake muscles rarely insert parallel to the vertebral column (Mosauer, 1935; Gasc, 1981), making measurements based on simple whole‐body cross‐sections (i.e. ACSA) only approximations of the force‐producing capacity of the musculature (PCSA). However, to my knowledge, there are no published measurements of PCSA of axial muscles for any snake.
Here, I describe and quantify the muscle anatomy of two colubrid snakes, kingsnakes (Lampropeltis holbrooki Stejneger 1903) and ratsnakes (Pantherophis obsoletus Say 1823). A notable interaction occurs between these snakes: kingsnakes can capture, constrict, and fully ingest larger ratsnakes (Jackson et al. 2004). Kingsnakes and ratsnakes are both powerful constrictors, but kingsnakes can produce significantly higher constriction pressures than ratsnakes, despite having similar ACSAs (Penning & Moon, 2017). Whether any muscular differences underlie these different levels of constriction performance is currently not known. To test for any such differences, I quantify and compare PCSAs for nine different muscles in these species. Lastly, I compare previously reported ACSA data (Penning & Moon, 2017) with the new PCSA data (this study). In total, I used data from nine muscles for comparison. The remaining muscles were either absent or were so small and complex that I was not able to remove them intact.
Materials and methods
The snakes I used for anatomical investigations (L. holbrooki = 7, P. obsoletus = 9) came from museum and personal collections (Table 1). Snakes are known to exhibit longitudinal variation in the anatomy of homologous muscles (Pregill, 1977; Nicodemo, 2012), so I analyzed the musculature at 50% snout–vent length (SVL; Jayne, 1982). Snakes were fixed in formalin and stored in a solution of 70% isopropyl alcohol (Simmons, 2015). Dehydration due to preservation may affect muscle mass but the relative water loss will be the same in all muscles (Herrel et al. 2014). Using neurosurgical tools and a stereoscopic microscope (Meiji; 3.5–45× magnification) illuminated with a Fisher Scientific fiber optic ring lamp, I isolated, measured, and removed as many individual muscles from each specimen as possible (for a total of nine different muscles, identified below in the results). Prior to removal, I measured linear dimensions of each muscle with Mitutoyo digital calipers (0.01 cm). After removal, I dried each muscle by gentle blotting with paper towel and weighed it on a Mettler AE 50 digital scale (to 0.0001 g). I report average values whenever I was able to remove more than one segment of a muscle.
Table 1.
Whole‐body measurements for ratsnakes, Pantherophis obsoletus (R), and kingsnakes, Lampropeltis holbrooki (K)
| Snake ID | Sex | Mass (g) | Diameter (cm) | SVL + TL (cm) | BV + TV |
|---|---|---|---|---|---|
| R1 | M | 352 | 2.2 | 102.5 + 20.9 | 237 + 81 |
| R2 | M | 662 | 2.5 | 131.3 + 26.1 | 253 + 86 |
| R3 | F | 1047 | 2.9 | 170.6 + 33.1 | 237 + 82 |
| R4 | F | 633 | 2.7 | 133.5 + 29.2 | 240 + 84 |
| R5 | M | 824 | 2.9 | 153.3 + 30.0 | 239 + 80 |
| R6 | F | 1274 | 3.3 | 150.9 + 33.7 | 230 + 88 |
| R7 | M | 850 | 2.7 | 143.3 + 30.6 | 232 + 91 |
| R8 | F | 642 | 2.8 | 141.4 + 28.8 | 233 + 91 |
| R9 | M | 678 | 2.6 | 145.2 + 27.5 | 244 + 81 |
| K1 | F | 634 | 2.6 | 131.5 + 11.7n | 212 + 33n |
| K2 | M | 534 | 2.3 | 131.3 + 16.4n | 217 + 45n |
| K3 | F | 571 | 2.5 | 116.7 + 16.6 | 207 + 49 |
| K4 | F | 492 | 2.7 | 113.0 + 11.3 | 214 + 35 |
| K5 | F | 506 | 2.8 | 115.5 + 10.9 | 217 + 34 |
| K6 | F | 612 | 2.6 | 129.5 + 14.2n | 210 + 31n |
| K7 | F | 601 | 2.5 | 126.2 + 10.2n | 211 + 27n |
BV, body vertebrae; SVL, snout–vent length; TL, tail length; TV, tail vertebrae.
Superscript ‘n’ denotes nipped tail; diameter is maximum body diameter.
Measurements of muscle anatomy often include muscle mass, muscle length, and physiological cross‐sectional area (Gans & Bock, 1965; Gans & De Vries, 1987; Lieber & Friden, 2000) calculated from the measurements described above (Alexander & Vernon, 1975; Sacks & Roy, 1982). I calculated PCSA by dividing muscle mass by the product of muscle density (1.06 g cm−3 from Mendez & Keys, 1960) and muscle length (Alexander & Vernon, 1975; Sacks & Roy, 1982). I used whole‐muscle length instead of fiber length to calculate conservative measures of PCSA (Herrel et al. 2014). I also measure and report tendon lengths.
I follow the terminology of Gasc (1981) and Cundall (1982), and use the terms insertion, anterior, and posterior to avoid confusion when describing tendons (Moon, 2000a). In addition to linear measures, I report muscle and tendon lengths based on the number of vertebrae they spanned, including the vertebrae of insertion (Jayne, 1982). In addition to these quantitative measures, I give qualitative descriptions of muscle anatomy, insertion sites, and interconnections where the information adds to the previous literature. Lastly, I compare the ACSA data for the same species from Penning & Moon (2017) to my new measures of PCSA. Penning & Moon (2017) calculated ACSA at 20% SVL intervals. To estimate ACSA at 50% SVL, I averaged the ACSA values from 40 and 60% SVL.
Statistical analysis
For quantitative comparisons, I log‐transformed all data prior to analyses. Although I used adult individuals in all of my dissections, kingsnakes were significantly smaller than the ratsnakes (t 14 = 2.43, P < 0.03). To account for size variation, I incorporated size (SVL) into models where body size would affect dependent variables. Because of the variation in two muscle insertions (CCS and CCI, see below), and their miniscule size, I cannot be certain that I removed all of the muscle tissue. Therefore I report their values (Table 2) but do not include them in quantitative analyses. To compare PCSA of all individually measured muscles between kingsnakes and ratsnakes, while accounting for body size, I used a repeated measures ancova (multivariate approach; Vasey & Thayer, 1987). I treat each muscle as the repeated measure, species as a categorical independent variable, and SVL as a covariate. Because serially repeated muscle segments overlap along the body, multiple segments of each muscle contribute to the ACSA for each muscle measured from whole‐body cross sections. Therefore, to compare the ACSA measurements from whole‐body cross‐sections to equivalent PCSA measurements, I needed to determine PCSA for the same number of overlapping muscle segments that contributed to the ACSA for each muscle in the whole‐body cross sections. To do this, I multiplied individual muscle PCSA by the number of segments that overlap in a single whole‐body cross‐section on one side of the body and then doubled the values to create a whole‐body value. With these data, I performed the same analysis as above but with this calculated whole‐body PCSA as the repeated measures variable. To compare relative muscle length (muscle length divided by the sum of muscle and tendon length; Ruben, 1977), I performed a repeated measures anova with relative length of each muscle as the repeated measure and species as the categorical variable. Because some muscles lacked tendons (Table 2), I only include muscles in which tendons were present in every specimen.
Table 2.
Gross anatomical measurements for the musculature of Pantherophis obsoletus (n = 9) and Lampropeltis holbrooki (n = 7)
| Species | Muscle ID | Post tendon (cm) [V] | Muscle tissue (cm) [V] | Ant tendon (cm) [V] | Muscle mass (g) | PCSA (cm) |
|---|---|---|---|---|---|---|
| P. obsoletus | MF | 0.8 ± 0.3 [1.5–2] | 1.1 ± 0.4 [2–3] | Absent | 0.033 ± 0.011 | 0.028 ± 0.009 |
| SSP‐SP | 1.5 ± 0.5 [2–3] | 3.7 ± 1.2 [6–7] | 6.4 ± 2.1 [11–13] | 0.054 ± 0.018 | 0.014 ± 0.005 | |
| LD | Absent | 3.0 ± 1.0 [5–6.5] | 0.8 ± 0.3 [1] | 0.051 ± 0.017 | 0.016 ± 0.005 | |
| IL | 1.5 ± 0.5 [2–3.5] | 6.0 ± 2.0 [10–18] | 1.7 ± 0.6 [3–4.5] | 0.060 ± 0.020 | 0.010 ± 0.003 | |
| LC | Absent | 1.2 ± 0.4 [1] | 0.2 ± 0.1 [0.25] | 0.050 ± 0.017 | 0.039 ± 0.013 | |
| SLS | 0.4 ± 0.3 [0–1] | 3.7 ± 1.2 [5.5–7] | 0.9 ± 0.3 [1–2.5] | 0.027 ± 0.009 | 0.007 ± 0.002 | |
| SLI | 0.4 ± 0.1 [0.25–1.25] | 3.6 ± 1.2 [5.5–7] | 0.7 ± 0.2 [1–1.5] | 0.026 ± 0.009 | 0.007 ± 0.002 | |
| CCS | Absent | 2.3 ± 0.8 [3.5–4.5] | Absent | 0.017 ± 0.006 | 0.007 ± 0.002 | |
| CCI | Absent | 2.3 ± 0.8 [3–4] | Absent | 0.013 ± 0.004 | 0.005 ± 0.002 | |
| L. holbrooki | MF | 1.1 ± 0.4 [1.5–2] | 1.2 ± 0.4 [2] | Absent | 0.019 ± 0.007 | 0.014 ± 0.005 |
| SSP‐SP | 1.4 ± 0.5 [3] | 2.6 ± 0.9 [5–6] | 4.7 ± 1.8 [9–11] | 0.034 ± 0.013 | 0.011 ± 0.004 | |
| LD | Absent | 2.1 ± 0.8 [3.5–5.5] | 1.3 ± 0.5 [1] | 0.042 ± 0.016 | 0.013 ± 0.005 | |
| IL | 1 ± 0.4 [1–3.5] | 5.5 ± 2.1 [8–11] | 1.0 ± 0.4 [1.25–2] | 0.037 ± 0.014 | 0.005 ± 0.002 | |
| LC | Absent | 1.4 ± 0.5 [1] | 0.2 ± 0.1 [0.25] | 0.040 ± 0.015 | 0.024 ± 0.009 | |
| SLS | Absent | 3.9 ± 1.5 [6.5–7] | 0.5 ± 0.2 [0–1] | 0.027 ± 0.010 | 0.006 ± 0.002 | |
| SLI | Absent | 3.6 ± 1.4 [6–7] | Absent | 0.019 ± 0.007 | 0.005 ± 0.002 | |
| CCS | Absent | 1.8 ± 0.7 [3–4] | Absent | 0.012 ± 0.005 | 0.005 ± 0.002 | |
| CCI | Absent | 2.1 ± 0.8 [3–4] | Absent | 0.009 ± 0.003 | 0.004 ± 0.001 |
Muscle abbreviations are as follows: CCI, costocutaneous inferior; CCS, costocutaneous superior; IL, iliocostalis; LC, levator costa; LD, longissimus dorsi; MF, multifidus; SLI, supracostalis lateralis inferior; SLS, supracostalis lateralis superior; SSP‐SP, semispinalis–spinalis complex.
Measurements are mean ± standard error. Note that the kingsnakes were smaller than the ratsnakes. ‘Post’ indicates posterior, ‘Ant’ indicates anterior, and values in brackets are ranges of vertebrae spanned (V).
To compare the scaling of PCSA between kingsnakes and ratsnakes, as done by Penning & Moon (2017), I summed the whole‐body PCSAs determined above for each of the four largest, interconnected muscle groups (semispinalis–spinalis complex, longissimus dorsi, and iliocostalis) and used a reduced‐major‐axis (RMA) regression version of ancova (Smith, 2009; Warton et al. 2012) with SVL as the covariate and species as a categorical variable. I used RMA regression to measure scaling based on the methods used in similar studies (Herrel et al. 2011; Penning & Moon, 2017) and the general recommendations for regression analyses based on variable symmetry (Smith, 2009). Lastly, I quantified the relationship between whole‐body ACSA (Penning & Moon, 2017) and whole‐body PCSA for the four largest muscles using another rma ancova with species as the categorical variable to quantify the relationship between these two measures. I performed analyses in jmp pro (11.00.0) and rstudio (version 0.99.441) software and consider tests significant at P < 0.05.
Results
For all 16 specimens, I was able to isolate and remove 250 individual muscle segments representing nine different muscles (one to four segments of each muscle per snake). Previous work has shown the incredible complexity of snake axial musculature, and my dissections revealed even greater complexity involving new interlinkages, muscle slips, and a previously undescribed muscle. Below, I describe each muscle for both kingsnakes and ratsnakes. I quantify muscle and tendon lengths as noted above and in the text wherever additional details are necessary, and I provide descriptive statistics (Table 2). With the exception of the levator costa, each muscle consists of overlapping segments that make up longitudinal muscle columns.
Descriptions
Epaxial muscles
Each multifidus (MF) is a single triangular‐shaped muscle that inserts posteriorly on the neural spine via a short tendon and anteriorly onto vertebrae via two or three heads (Fig. 1, Table 2). In kingsnakes, the MF has two anterior heads, a medial head that inserts onto a vertebra dorsal and posterior to the lateral head, which slopes downward to insert onto the next anterior vertebra. In ratsnakes, the anterior insertion of the MF is more complex, spanning up to three vertebrae and having three distinct heads that insert onto separate vertebrae, with the anterior‐most head being the smallest.
Figure 1.

Simplified schematic right lateral view of several epaxial muscles in Pantherophis obsoletus (top) and Lampropeltis holbrooki (bottom). Skeletal structure is gray with numbers representing the anterior (1) and posterior (25 and 27) attachment sites for the interlinked epaxial muscles. Colored areas represent contractile tissue and white areas represent tendons. See Table 2 for muscle abbreviations.
The semispinalis–spinalis (SSP–SP) complex is a two‐part muscle with multiple insertions and connections to other muscles (Fig. 1, Table 2). The complex inserts anteriorly onto a vertebra by a long, ribbon‐like tendon; the long anterior tendons of adjacent segments overlap and are intertwined within thick connective tissue (Moon, 2000a) that can seem stronger than the tendon itself. The muscle tissue spans six to seven vertebrae in ratsnakes and five to six vertebrae in kingsnakes; these lengths reflect muscle tissue of both the SSP–SP overall and just the SSP part, because it is longer than the SP part. Near the anterior end of the muscle tissue, the SSP–SP complex splits into two slips that separate at their posterior ends. The SP slip inserts dorsally on the posterior tendon of the multifidus; the posterior tendon of the multifidis spans ca. two vertebrae overall. The SSP slip continues posteriorly onto a tendon that is continuous with the longissimus dorsi (Fig. 1). Data in Table 2 for the posterior tendon of the SSP–SP complex refer only to the tendon of the SSP; there is no visible posterior tendon for the SP (Fig. 1).
The longissimus dorsi (LD) is a sheet‐like muscle that connects anteriorly via a forked tendon to both the SSP slip of the SSP–SP complex and the iliocostalis (IL). The posterior insertion of the LD has two heads that insert across two vertebrae onto the ventrolateral side of each vertebra (Fig. 1, Table 2). The anterior tendon of the LD forms a sheet that forks anteriorly, connecting dorsally with the posterior tendon of the SSP slip of the SSP–SP complex, and ventrally with the IL. The sheet‐like tendon of the LD is an integral part of the connective tissue partition among the three major epaxial muscle groups (SSP–SP complex, LD, and IL). The shared anterior tendon of the LD joins the SSP–SP complex to the IL, forming a long musculoskeletal chain (spanning ca. 27 vertebrae in ratsnakes and 25 vertebrae in kingsnakes; Fig. 1). Data in Table 2 for the anterior tendon of the LD refer to the length of the broad, sheet‐like tissue before the tissue splits into two distinct tendons (Fig. 1).
The iliocostalis (IL) is a long, slender muscle. Each segment of the IL muscle connects via tendons posteriorly to the LD and anteriorly to a rib (Fig. 1, Table 2). The tendon connecting the LD to the IL passes through, and contributes to, a tough sheath of connective tissue that forms a distinct septum between the LD and IL columns in both species. From the anterior edge of LD muscle tissue to the posterior edge of IL muscle tissue, the ventral fork of the LD tendon spans up to 4.5 vertebrae in ratsnakes and kingsnakes. In ratsnakes, the IL is subdivided into an anterior and a posterior segment of similar length, and each spans an average of seven vertebrae (Figs 1 and 2). The intermediate tendon between the segments is less than one vertebra in length. As in some other colubrids, this intermediate tendon does not have a direct connection to the ribs (Mosauer, 1935) but is encased in connective tissue that connects the serially repeating segments to one another. There is no intermediate tendon for the IL of kingsnakes (Fig. 1). In ratsnakes, both segments of the IL have two small slips of fibers that angle dorsally to the next anterior segment and ventrally to the next posterior segment, braiding the adjacent segments together and making them difficult to separate in dissection (Fig. 2). Kingsnakes show a similar but simpler pattern. Ratsnakes have four total slips that come off of the IL (two from each separate IL segment). Kingsnakes have only two slips that come off the single IL segment.
Figure 2.

Right lateral view of three stretched‐out iliocostalis muscle segments and their interconnecting slips in Pantherophis obsoletus (top) and a schematic illustration of the same muscle linkages (bottom). Each muscle is pulled ventrally so that the smaller interlinkages can be seen.
Hypaxial muscles
The levator costa (LC) is a surprisingly large muscle (in mass) despite its short length (Fig. 3, Table 2); it connects a vertebra to a rib and is presumed to elevate and protract the rib. Of the muscles that I describe, this is the only one that does not overlap along the body. This muscle can be accessed by clipping the anterior tendons of the IL muscle column and reflecting the entire IL muscle column laterally (Fig. 3). The LC inserts anteriorly via a small tendon onto the prezygapophysial process of a vertebra and widens posteroventrally before inserting onto the surface of a rib approximately one‐quarter of the distance from its base to rib tip.
Figure 3.
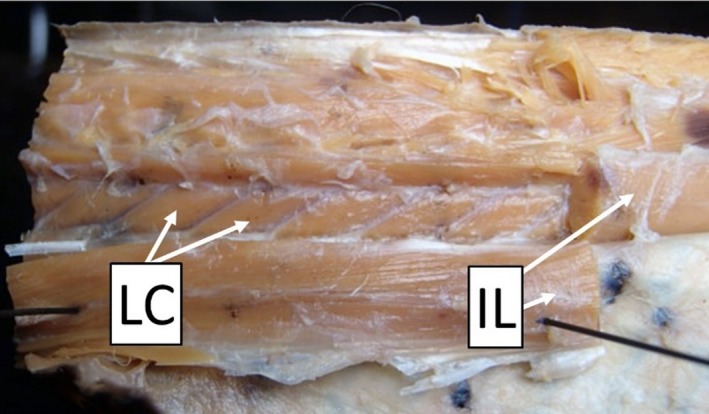
Right lateral view of the axial musculature in a ratsnake, Pantherophis obsoletus. The large superficial epaxial muscles [semispinalis–spinalis complex, longissimus dorsi, and iliocostalis (IL)] have largely been removed. Portions of the IL have been cut and reflected laterally to show the underlying individual levator costa (LC) muscles.
The supracostalis lateralis superior (SLS) and supracostalis lateralis inferior (SLI) muscles connect nearby ribs; the muscle tissue runs posteroventrally and anterodorsally between insertions. In ratsnakes, both muscles often have short anterior and posterior tendons (Table 2). In kingsnakes, there were no obvious posterior tendons for either muscle, and there was no obvious anterior tendon on the SLI; the SLS has a short anterior tendon. Both muscles in both species often have muscle slips that interconnected adjacent segments. In both ratsnakes and kingsnakes, there was a previously undescribed muscle that separates the SLS and SLI (Fig. 4). Considering its location between the two muscle groups, I describe it as the supracostalis lateralis centralis (SLC). The SLC fibers run in the opposite direction (Fig. 4), with fibers inclining anteroposteriorly. The SLC spans up to six vertebrae with small slips inserting onto each rib along the length of the muscle. As the SLC extends posteriorly, the segments of this muscle appear to run laterally, then dorsally and then medially, giving a loosely twisted or rotated appearance. Without removal, the SLC is easily viewed after removing the costocutaneous muscles (Fig. 4).
Figure 4.
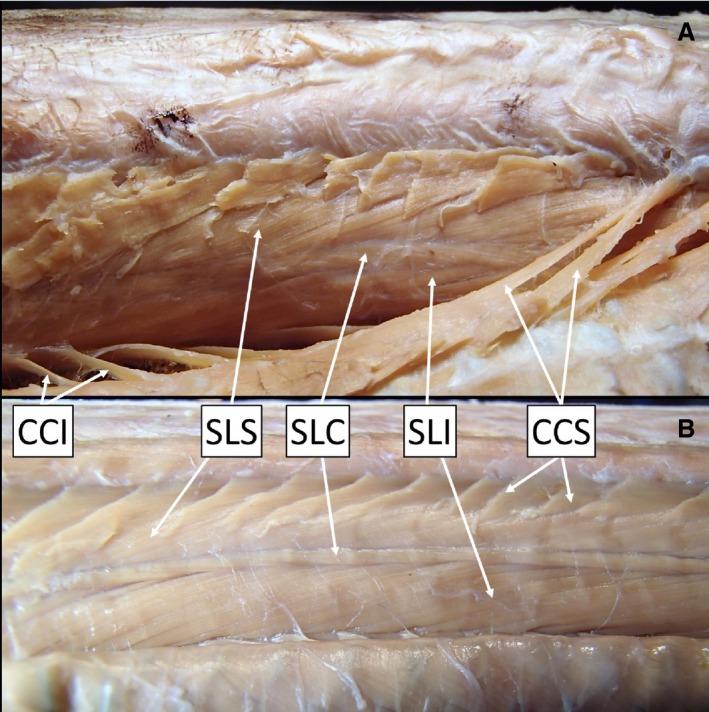
Right lateral view of the superficial hypaxial muscles in (A) a ratsnake, Pantherophis obsoletus, and (B) a kingsnake, Lampropeltis holbrooki. This view is accomplished by making a mid‐dorsal incision through the skin and reflecting it laterally, severing the costocutaneous muscle insertions on the skin and the fascia between the muscle and skin. See Table 2 for muscle abbreviations.
The costocutaneous superior (CCS) and inferior (CCI) are small muscles that connect the ribs to the skin, without obvious tendons. Segments of the CCS run downward posteriorly from ribs and attach diffusely to the skin (Fig. 4). The CCI runs counter to the CCS; CCI segments run slightly upward anteriorly from ribs and attach diffusely to the skin.
Quantitative analyses
For both kingsnakes and ratsnakes, the PCSA values for individual muscles (single‐segment) range on average from 0.0038 to 0.039 cm2 (Table 2). Of the individually measured muscles, the LC (kingsnakes = 0.024 cm2, ratsnakes = 0.039 cm2) has the highest PCSA; however, individual segments of the LC span only one vertebra and do not overlap along the body (Fig. 3). For the single‐segment PCSAs, there is no significant interaction between muscle type and species (repeated measures ancova; F 6,7 = 0.37, P > 0.86). While there is variation in PCSA across muscles (Table 2), there is no significant difference in PCSA between species (F 1,12 = 0.05, P > 0.82; Fig. 5A). In a whole‐body muscle column, the total PCSA for all overlapping segments of a given muscle visible in cross‐section (on both sides of the vertebral column) is much higher in the longer epaxial muscles. The LD has the highest total column PCSA in kingsnakes (0.13 cm2), whereas the IL has the highest total column PCSA in ratsnakes (0.24 cm2). The result for total column PCSA for each muscle is similar to the results for single‐segment PCSA. There is no significant interaction between species and muscle type (F 6,7 = 0.45, P > 0.82). As with individual PCSAs, there is variation in total column PCSA (Fig. 5B) but there is no significant difference in total column PCSA between species (repeated measures ancova F 1,12 = 0.21, P > 0.65; Fig. 5B).
Figure 5.
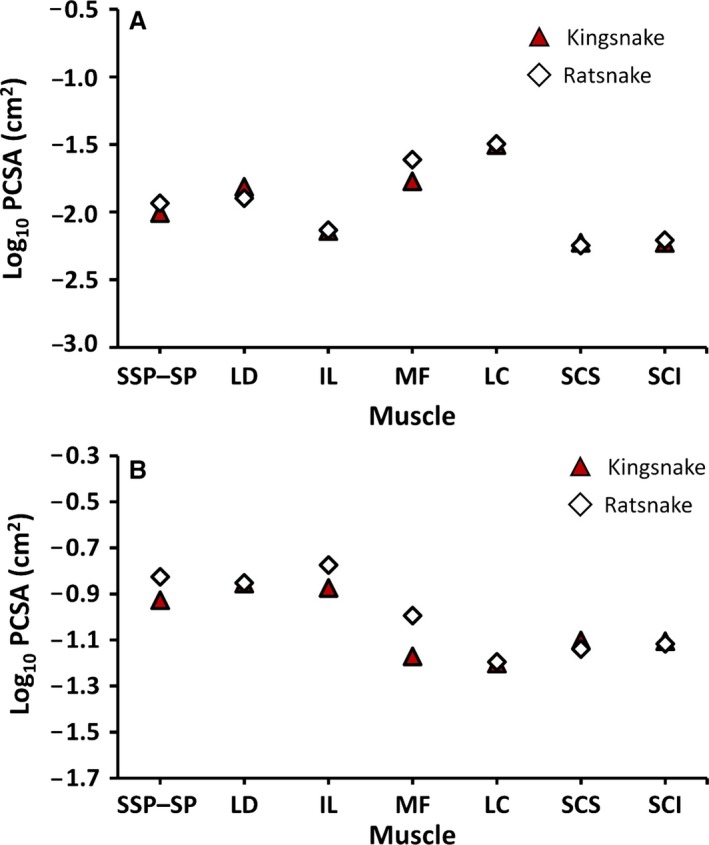
Covariate (SVL) adjusted means of log10 physiological cross‐sectional area (PCSA) for individual muscles (A) and total column PCSA for each muscle (B) at ca. 50% snout–vent length. Red triangles denote kingsnakes (Lampropeltis holbrooki), open diamonds denote ratsnakes (Pantherophis obsoletus). See Table 2 for muscle abbreviations.
The relative lengths of muscle tissue and corresponding tendons varies among muscles but not between species. There was no significant interaction between species and muscle identity (F 4,11 = 2.37, P > 0.11) and relative muscle length was not significantly different between species (F 1,14 = 0.26, P > 0.61). In general, short muscles tended to have short tendons, and long muscles tended to have long tendons, although there were some exceptions to these generalizations in both epaxial and hypaxial muscles (e.g. long posterior tendons of the MF and essentially undetectable posterior tendon of the LD). Of the major interconnected epaxial muscles, the SSP–SP complex has the shortest relative muscle length (ratsnakes = 0.32 ± 0.006, kingsnakes = 0.31 ± 0.02), whereas the IL has the longest (kingsnakes = 0.80 ± 0.01, ratsnakes = 0.80 ± 0.01).
To compare the scaling of PCSA between kingsnakes and ratsnakes (as in Penning & Moon, 2017), I summed the PCSAs of the four largest interconnected muscle groups (SSP–SP complex, LD, and IL) and used a reduced‐major‐axis (RMA) regression version of ancova (Smith, 2009; Warton et al. 2012) with SVL as the covariate and species as a categorical variable. The summed PCSA of these four muscles was significantly related to SVL (PCSA = 3.12 × SVL –6.96, R 2 = 0.46, P < 0.004; Fig. 6). However, there are no differences in the slopes (P > 0.48) or intercepts (P > 0.89) between the kingsnake and ratsnake scaling patterns.
Figure 6.

Sum of the log10 physiological cross‐sectional areas (PCSA) for the four largest epaxial muscles (semispinalis–spinalis complex, longissimus dorsi, and iliocostalis) at ca. 50% snout–vent length (SVL) regressed against log10 total SVL. Red triangles denote kingsnakes (Lampropeltis holbrooki), open diamonds denote ratsnakes (Pantherophis obsoletus), and the black line represents the reduced major axis regression model (see Results).
Eight snakes (four P. obsoletus and four L. holbrooki) from my dissections (and PCSA calculations) were used in the ACSA measurements of Penning & Moon (2017) and can therefore be compared quantitatively to the PCSAs in this study. The PCSA values are 55–86% of the ACSA values, and no PCSA calculation is greater than the ACSA calculation, as would be expected for parallel‐fibered muscles. The slopes (P > 0.25) and intercepts (P > 0.86) are not significantly different between kingsnakes and ratsnakes for these two measures. The overall relationship between ACSA and PCSA is positive (PCSA = 0.95 × ACSA –0.20, R 2 = 0.80, P < 0.002) and isometric based on the 95% confidence intervals (CI) of the slope (slope CI = 0.37–1.53; Fig. 7).
Figure 7.

Sum of the log10 physiological cross‐sectional areas (PCSA) from this study regressed against log10 anatomical cross‐sectional areas (ACSA) for the four largest epaxial muscles (semispinalis–spinalis complex, longissimus dorsi, and iliocostalis) at ca. 50% SVL from Penning & Moon (2017). Red triangles denote kingsnakes (Lampropeltis holbrooki), open diamonds denote ratsnakes (Pantherophis obsoletus), and the black line represents the reduced major axis regression model (see Results).
Discussion
Descriptive anatomy
In general, the epaxial muscle morphology of both ratsnakes and kingsnakes is similar to that previously described for other colubrid snakes (Mosauer, 1935; Gasc, 1981; Moon, 2000a; Jayne & Riley, 2007) but with some additional complexity. Longer muscles tended to have longer tendons and, except for the LC, all muscles overlap along the axial system. Ratsnakes have an intermediate tendon to the IL, whereas kingsnakes do not. Both kingsnakes and ratsnakes have more complex IL muscles than previously reported, with slips interconnecting adjacent segments which gives the IL a complex braided or mesh‐like organization. To my knowledge, these slips have not been discussed as discrete muscle slips in the literature (Mosauer, 1935; Auffenberg, 1958; Pregill, 1977; Gasc, 1981; Moon, 2000a; Jayne & Riley, 2007); however, interconnecting fibers have been reported in several studies. Pregill (1977) noted that he could not separate individual IL segments from one another in Coluber constrictor, contrasting with the results of Mosauer (1935). Gasc (1981) did not discuss any interlinkages between adjacent IL segments but they appear to be partially illustrated for Xenodon merremi (fig. 48 of Gasc, 1981) and perhaps Hierophis viridiflavus (fig. 38 of Gasc, 1981).
I describe a new hypaxial muscle in both species that to my knowledge has not been previously reported: the supracostalis lateralis centralis (Fig. 4). Based on the location, size, and insertion of this muscle, it likely aids in stiffening or adduction and retraction of the ribs and in lateral flexion of the vertebral column. For example, it may work in concert with the SLS and SLI in locomotion (Gasc et al. 1989). The last muscle that warrants brief discussion is the LC. Very little is said of this muscle in the literature (Mosauer, 1935; Gasc, 1981), although it is hypothesized to be of major functional importance in ‘snake‐like’ forms (Gasc, 1981). This muscle has the highest PCSA of any individual muscle segment (Table 2); based on its size and location, it likely abducts and protracts the ribs, and hence plays an important role in locomotion, constriction, and other feeding movements. Given the large size and likely importance of this muscle, its function should be studied in vivo using electromyography, although instrumenting it might be challenging because of its position underneath the LD and IL.
Previous descriptions of snake musculature sometimes gave conflicting results (Mosauer, 1935; Auffenberg, 1958, 1966; Pregill, 1977; Ruben, 1977; Jayne, 1982). Considering the intraspecies variation observed in muscle and tendon lengths (Jayne, 1982; Table 2 this study), and the lack of standardized procedures, it is currently impossible to separate the variation in anatomy caused by differences in dissection procedures from actual biological variation. In addition to differences in simple anatomical counts and qualitative descriptions, previous work proposes stark differences in the hypothesized functional consequences of anatomical complexity. Pregill (1977) stated that muscle variation was ‘unremarkable’ with ‘minor’ differences being additional tendons and interlacing muscles in colubrid snakes; Gasc (1981) viewed these differences very differently and hypothesized that differences in muscle organization would have functional (and taxonomic) significance. Furthermore, Herrel et al. (2008) showed that minor changes in muscle angle have significant consequences for performance between just two interconnected muscles. Therefore, considering the incredible complexity and variation in snake musculature, it is likely that different interconnections and linkages will reveal differences in performance that are worth investigating and quantifying.
Quantitative comparisons
Previous work has quantified snake musculature using anatomical cross‐sectional area as an indicator of the amount of muscle available for use (Lourdais et al. 2005; Jayne & Riley, 2007; Herrel et al. 2011; Penning & Moon, 2017). However, it is important to measure PCSA because it is a better indicator of the force‐producing capacity of a muscle (Sacks & Roy, 1982; MacIntosh et al. 2006) and therefore offers a better foundation for understanding and predicting functions. To my knowledge, no prior quantitative data exist for PCSA in any snake, and therefore no comparisons of the actual force‐producing capacities among snakes have been made. Penning & Moon (2017) showed that three species of kingsnakes are capable of producing significantly higher peak constriction pressures on rodent prey compared with three species of ratsnakes, despite all having similar ACSA of the major epaxial muscles. Penning & Moon (2017) noted that ACSA may not completely account for muscle‐level differences among these species. Although there are differences in individual muscle masses, lengths, and PCSAs in this study (Table 2), there are no differences between P. obsoletus and L. holbrooki in the PCSA of different muscles when compared as individual muscles or whole cross‐sections (Fig. 5). With no significant differences in ACSA (Penning & Moon, 2017), PCSA, and relative muscle and tendon lengths, there is currently no identifiable anatomical mechanism that explains how kingsnakes exert significantly higher constriction pressures than ratsnakes. Similar muscle PCSA suggests that functional differences between these species, such as maximum force‐producing abilities and feeding performance, should be minor. However, in vivo tests of muscle force and endurance could help explain the notable difference in whole‐body constriction performance. Differences in muscle‐level performance would indicate physiological differences (muscle stress, endurance, etc.) between these two intraguild competitors that ACSA and PCSA are not capable of identifying. Alternatively, similar muscle force and endurance in ratsnakes and kingsnakes would suggest that the ability of kingsnakes to produce higher peak constriction pressure is driven more by behavior (coil pattern) than physiology (muscle‐level performance).
ACSA and PCSA scale isometrically and there is a strong relationship between these two measurements (r 2 = 0.80; Fig. 7). While there is a predictable relationship between these measures, it is important to note that the regression model does not pass through the origin (intercept ≠ 0). Therefore, ACSA overestimates PCSA in kingsnakes and ratsnakes. Nevertheless, these results indicate that simple ACSAs may be adequate proxies for predicting or qualitatively comparing whole‐body performance capacity, particularly considering the difficulty of quantifying PCSA. However, simple whole‐body ASCA is probably not a good proxy for quantitative predictions or comparisons of maximum forces or performance levels because ACSA overestimates the force‐producing architecture of a muscle (PCSA).
Acknowledgements
I thank Brad Moon for his helpful insight and guidance on snake musculature and for providing access to several specimens. I also thank Karen Smith for allowing access to key pieces of equipment. Partial funding was provided by the Louisiana Board of Regents Doctoral Fellowship, the Department of Biology and Graduate Student Organization at the University of Louisiana at Lafayette, the Louisiana Department of Wildlife and Fisheries Rockefeller State Wildlife Scholarship, and the Kansas Herpetological Society.
References
- Alexander RM, Vernon A (1975) The dimensions of the knee and ankle muscles and the forces they exert. J Hum Mov Stud 1, 115–123. [Google Scholar]
- Auffenberg W (1958) The trunk musculature of Sanzinia and its bearing on certain aspects of the myological evolution in snakes. Mus Comp Zool 82, 1–12. [Google Scholar]
- Auffenberg W (1966) The vertebral musculature of Chersydrus (Serpentes). Q J Florida Acad Sci 29, 155–162. [Google Scholar]
- Cundall D (1982) Functional morphology In: Snakes: Ecology and Evolutionary Biology (eds Seigel RA, Collins JT, Novak SS.), pp. 106–140. New York: McGraw‐Hill. [Google Scholar]
- Cundall D, Greene HW (2000) Feeding in snakes In: Feeding: Form, Function, and Evolution in Tetrapod Vertebrates (ed. Schwenk K.), pp. 293–333. San Diego, California: Academic Press. [Google Scholar]
- Gans C, Bock WJ (1965) The functional significance of muscle architecture: a theoretical analysis. Adv Anat Embryol Cell Biol 38, 115–142. [PubMed] [Google Scholar]
- Gans C, De Vries F (1987) Functional bases of fiber length and angulation in muscle. J Morphol 192, 63–85. [DOI] [PubMed] [Google Scholar]
- Gasc J‐P (1981) Axial musculature In: Biology of the Reptilia, vol. 11 (eds Gans C, Parsons TS.), pp. 355–435. New York: Academic Press. [Google Scholar]
- Gasc J‐P, Cattaert D, Chasserat C, et al. (1989) Propulsive action of a snake pushing against a single site: its combined analysis. J Morphol 201, 315–329. [DOI] [PubMed] [Google Scholar]
- Greene HW (1997) Snakes: The Evolution of Mystery in Nature. Berkeley: University of California Press. [Google Scholar]
- Herrel A, Schaerlaeken V, Ross C, et al. (2008) Electromyography and the evolution of motor control: limitations and insights. Integr Comp Biol 48, 261–271. [DOI] [PubMed] [Google Scholar]
- Herrel A, Huyghe K, Oković P, et al. (2011) Fast and furious: effects of body size on strike performance in an arboreal viper Trimeresurus (Cryptelytrops) albolabris . J Exp Zool 315, 22–29. [DOI] [PubMed] [Google Scholar]
- Herrel A, Redding CL, Meyers JJ, et al. (2014) The scaling of tongue projection in the veiled chameleon Chamaeleo calyptratus . Zoology 117, 227–236. [DOI] [PubMed] [Google Scholar]
- Jackson K, Kley NJ, Brainerd EL (2004) How snakes eat snakes: the biomechanical challenges of ophiophagy for the California kingsnake, Lampropeltis getula californiae (Serpentes: Colubridae). Zoology 107, 191–200. [DOI] [PubMed] [Google Scholar]
- Jayne BC (1982) Comparative morphology of the semispinalis‐spinalis muscle of snakes and correlations with locomotion and constriction. J Morphol 172, 83–96. [DOI] [PubMed] [Google Scholar]
- Jayne BC (1988) Muscular mechanisms of snake locomotion: an electromyographic study of the sidewinding and concertina modes of Crotalus cerastes, Nerodia fasciata, and Elaphe obsoleta . J Exp Biol 140, 1–33. [DOI] [PubMed] [Google Scholar]
- Jayne BC, Riley MA (2007) Scaling of the axial morphology and gap‐bridging ability of the brown tree snake, Boiga irregularis . J Exp Biol 210, 1148–1160. [DOI] [PubMed] [Google Scholar]
- Lieber RL, Friden J (2000) Functional and clinical significance of skeletal muscle architecture. Muscle Nerve 23, 1647–1666. [DOI] [PubMed] [Google Scholar]
- Lillywhite HB (2014) How Snakes Work: Structure, Function and Behavior or the World's Snakes. Oxford: Oxford University Press. [Google Scholar]
- Lourdais O, Brischoux F, Barantin L (2005) How to assess musculature and performance in a constricting snake? A case study in the Columbian rainbow boa (Epicrates cenchria maurus). J Zool 265, 43–51. [Google Scholar]
- MacIntosh BR, Gardiner PF, McComas AJ (2006) Skeletal Muscle: Form and Function. 2nd edn Champaign, Illinois: Human Kinetics. [Google Scholar]
- Mendez J, Keys A (1960) Density and composition of mammalian muscle. Metab Clin Exp 9, 184–188. [Google Scholar]
- Moon BR (2000a) The mechanics and muscular control of constriction in gopher snakes (Pituophis melanoleucus) and a king snake (Lampropeltis getula). J Zool 252, 83–98. [Google Scholar]
- Moon BR (2000b) The mechanisms of swallowing and the muscular control of diverse behaviours in gopher snakes. J Exp Biol 203, 2589–2601. [DOI] [PubMed] [Google Scholar]
- Mosauer W (1935) The myology of the trunk region of snakes and its significance for ophidian taxonomy and phylogeny. Univ Cal Publ Biol Sci 1, 81–120. [Google Scholar]
- Nicodemo PI (2012) Longitudinal Variation in the Axial Muscles of Snakes. Master's Thesis. University of Cincinnati, Cincinnati. [Google Scholar]
- Penning DA, Moon BR (2017) The king of snakes: performance and morphology of intraguild predators (Lampropeltis) and their prey (Pantherophis). J Exp Biol 220, 1154–1161. [DOI] [PubMed] [Google Scholar]
- Pregill GK (1977) Axial myology of the racer Coluber constrictor with emphasis on the neck region. San Diego Soc Nat Hist Trans 18, 185–206. [Google Scholar]
- Pyron RA (2015) Post‐molecular systematics and the future of phylogenetics. Trends Ecol Evol 30, 384–389. [DOI] [PubMed] [Google Scholar]
- Ruben JA (1977) Morphological correlates of predatory modes in the coachwhip (Masticophis flagellum) and rosy boa (Lichanura roseofusca). Herpetologica 33, 1–6. [Google Scholar]
- Sacks RD, Roy RR (1982) Architecture of the hind limb muscles of cats: functional significance. J Morphol 173, 185–195. [DOI] [PubMed] [Google Scholar]
- Schilling N (2011) Evolution of the axial system in craniates: morphology and function of the perivertebral musculature. Front Zool 8, 1–19. [DOI] [PMC free article] [PubMed] [Google Scholar]
- Simmons JE (2015) Herpetological Collecting and Collections Management. Herpetological Circular No. 42. Utah Salt Lake City, Utah: Society for the Studies of Amphibians and Reptiles. [Google Scholar]
- Smith RJ (2009) Use and misuse of the reduced major axis regression for line‐fitting. Am J Phys Anthropol 140, 476–486. [DOI] [PubMed] [Google Scholar]
- Tyson E (1682. –83) Vipera caudi‐Sona americana, or the anatomy of the rattlesnake, dissected at the repository of the Royal Society in January 1682–83. Philos Trans R Soc Lond B 13, 25–58. [Google Scholar]
- Vasey MW, Thayer JF (1987) The continuing problem of false positives in repeated measures ANOVA in psychophysiology: a multivariate solution. Psychophysiology 24, 479–486. [DOI] [PubMed] [Google Scholar]
- Warton DI, Duursma RA, Falster DS, et al. (2012) Smart 3 – an R package for estimation and inference about allometric lines. Methods Ecol Evol 3, 257–259. [Google Scholar]
- Young BA (2010) How a heavy‐bodied snake strikes quickly: high‐power axial musculature in the puff adder (Bitis arietans). J Exp Zool 313, 114–121. [DOI] [PubMed] [Google Scholar]
- Young BA, Kardong KV (2010) The functional morphology of hooding in cobras. J Exp Biol 213, 1521–1528. [DOI] [PubMed] [Google Scholar]