

Abstract
Current tissue‐clearing protocols for imaging in three dimensions (3D) are typically applied to optimally fixed, small‐volume rodent brain tissue – which is not representative of the tissue found in diagnostic neuropathology laboratories. We present a method to visualise the cerebral cortical vasculature in 3D in human post‐mortem brain tissue which had been preserved in formalin for many years. Tissue blocks of cerebral cortex from two control cases, two Alzheimer's brains and two cases from Alzheimer's patients immunised against Aβ42 were stained with fluorescent Lycopersicon esculentum agglutinin (Tomato lectin), dehydrated and cleared using an adapted three‐dimensional imaging of solvent cleared organs (3DISCO) protocol to visualise the vascular endothelium. Tissue was imaged using light sheet and confocal microscopy and reconstructed in 3D using amira software. The method permits visualisation of the arrangement of the parallel penetrating cortical vasculature in the human brain. The presence of four vascular features including anastomosis, U‐shaped vessels, spiralling and loops were revealed. In summary, we present a low cost and simple method to visualise the human cerebral vasculature in 3D compatible with prolonged fixation times (years), allowing study of vascular involvement in a range of normative and pathological states.
Keywords: brain, human, light sheet microscopy, three dimensions, vasculature
Introduction
The vascular supply to the human cerebrum is required for delivering oxygen and glucose, essential for the survival and functioning of neocortical neurons. The continuous and regulated blood flow is derived from paired internal carotid arteries, each dividing into anterior and middle cerebral arteries, and paired vertebral arteries fusing to form the basilar artery and then dividing into paired posterior cerebral arteries with anastomoses occurring at the circle of Willis (Kalaria et al. 2015). Branches of these arteries traverse the surface of the brain within the arachnoid mater, then pierce the cortical surface in a perpendicular manner, forming penetrating cortical arteries and arterioles, some of which supply the capillary bed within the cortex and others passing through to the underlying white matter. The capillary bed is drained by veins running back to the cortical surface. However, our current understanding of the detailed configuration of the vasculature within the cortex is limited. As described by Florey in 1925 using animals perfused with Indian ink, the leptomeningeal vessels perpendicularly enter into the parenchyma (Florey, 1925). Several decades later, Duvernoy used the alkaline phosphatase reaction on thick histological sections of human brain to demonstrate a dense distribution of cortical arteries and arterioles running through each neocortical cellular layer, until they dissipated at the grey‐white matter boundary (Duvernoy et al. 1981). Using the same methodology on celloidin sections, Fischer demonstrated the presence of ‘abnormally contoured vessels’ in Alzheimer's disease (AD) brain defined as looping, tortuosities or kinking of vessels (Fischer et al. 1990). Since these studies, as the more ‘modern’ approach to histopathology typically involves thin sectioning of tissues leading to the inability to visualise blood vessels in 3D, there has been limited further progress in our understanding of the configuration of blood vessels within the brain parenchyma. This is an omission considering the increasing interest in the role of the vasculature in a range of disorders, including stroke and dementia.
The recent development of tissue‐clearing techniques, combined with the use of light sheet and confocal microscopy, has enabled tissue blocks to be stained and cleared for visualisation in three dimensions (3D). Current methods include CLARITY (Chung et al. 2013), which uses hydrogel scaffolds to remove lipid while preserving proteins (Erturk et al. 2012, 2014; Erturk & Bradke, 2013; Renier et al. 2014), and immunolabelling‐enabled three‐dimensional imaging of solvent‐cleared organs (iDISCO; Renier et al. 2014), which involves the dehydration and clearing of tissue blocks using organic solvents. Such methods can be expensive and labour‐intensive and have typically been applied to rodent or fresh tissue with very short fixation times. In addition, immunolabelling in tissue‐clearing remains challenging, particularly in human tissues where antibody penetration is limited, possibly due to the high density of antigen expressed (Liu et al. 2016; Marx, 2016). Therefore, a non‐immunohistochemical approach applicable to formalin‐fixed human brain tissue, using volumes large enough to sample the full depth of the cerebral neocortex (or comparably sized subcortical structures) while using widely available reagents will be useful. Here we present a methodology employing Lycopersicon esculentum agglutinin, known as Tomato lectin (Nachbar et al. 1980), to label vascular endothelial cells (Nag, 1985; Jilani et al. 2003; Robertson et al. 2015), in order to gain a novel perspective on the 3D arrangement of the vasculature in the human cerebral cortex. As we have specific interests in the vascular alterations associated with AD and its therapy with immunisation with amyloid‐β peptide (Boche et al. 2008), our investigation included AD cases and immunised AD (iAD) cases in addition to aged‐matched non‐demented subjects.
Methods
Description of samples
Archival formalin‐fixed brain tissue which had been in formalin for > 2 years was employed in this study. Cuboidal blocks of approximately 8 × 4 × 4 mm were taken from the cortex of the superior/middle temporal gyrus (Brodmann area 21/22) from each case. Cases included the brains of two age‐matched, disease‐free control subjects, two subjects with AD and two subjects who had received Aβ42 immunotherapy in life (iAD cases; Boche et al. 2008). Details of the cases are shown in Table 1. Methodology and analysis were performed blind to case status.
Table 1.
Description of the cases and identification of the vascular anomalies
| Cases | Age at death | Sex | Spiral vessels | Anastomoses | Beading | Loops |
|---|---|---|---|---|---|---|
| Control | 78 | M | − | − | + | − |
| Control | 88 | F | + | + | − | − |
| AD | 74 | F | + | − | + | − |
| AD | 81 | M | − | − | − | − |
| iAD | 82 | M | + | − | + | + |
| iAD | 87 | F | + | − | + | − |
AD, Alzheimer's disease; iAD, Alzheimer's disease after immunotherapy against amyloid‐β.
Ethics
The study was performed under ethical approval from Southampton and South West Hampshire Local Research Ethics Committees reference LRC 075/03/w; and UK Brain Archive Information Network (BRAIN UK) Research Ethics Committees reference 14/SC/0098.
Tissue preparation and staining
Permeabilisation
The first step included 1 h incubation in a solution of 0.2%Triton‐X 100 and 4% sodium dodecyl sulphate (SDS), followed by a second incubation in the same solution heated at 50 °C for 1 h. The samples were then placed in 20% dimethyl sulphoxide (DMSO), 0.2% Triton‐X 100, 4% SDS solution for 6 h, before being left overnight in a solution composed of 0.1% Tween, 0.1% Triton‐X 100, 0.1% sodium deoxycholate, 0.1% NP‐40, 4% SDS and 20% DMSO. All solutions were prepared in phosphate‐buffered saline (PBS) and incubations from the second step were performed at 50 °C.
Staining
Samples were washed for 1 h in 1% Triton‐X 100 solution before being stained overnight at 4 °C with a 5% tomato lectin solution to image the vasculature (DyLight 649 Tomato lectin, Vector Laboratories). The far red fluorophore 649 was chosen, as longer wavelengths are known to generate less autofluorescence and scattering (Davidson & Campbell, 2009). Following staining, samples were washed in 0.2% Tween‐20 solution.
Tissue clearing
Dehydration was achieved by incubation for 8 h each in increasing concentrations of tetrahydrofuran (THF) as follows: 70% THF ×3, 80% THF ×2, 95% THF ×2, 100% THF ×2. Samples were then placed in dichloromethane (DCM) solution followed by a di‐benzyl ether solution (DBE) for 24 h before being imaged. The total duration of the protocol was 9 days.
Image acquisition and 3D reconstruction
Image acquisition
To visualise the penetrating cortical vasculature, the six sample blocks were imaged in their entirety with the LaVision light sheet Ultramicroscope at ×6.4 magnification using the following filters: 640 nm, corresponding to the excitation peak for the tomato lectin fluorophore, and 480 nm to image the autofluorescence signal. For each sample, stacks of approximatively 250 images separated by 5 μm were generated for subsequent 3D reconstruction and analysis (Fig. 1A).
Figure 1.
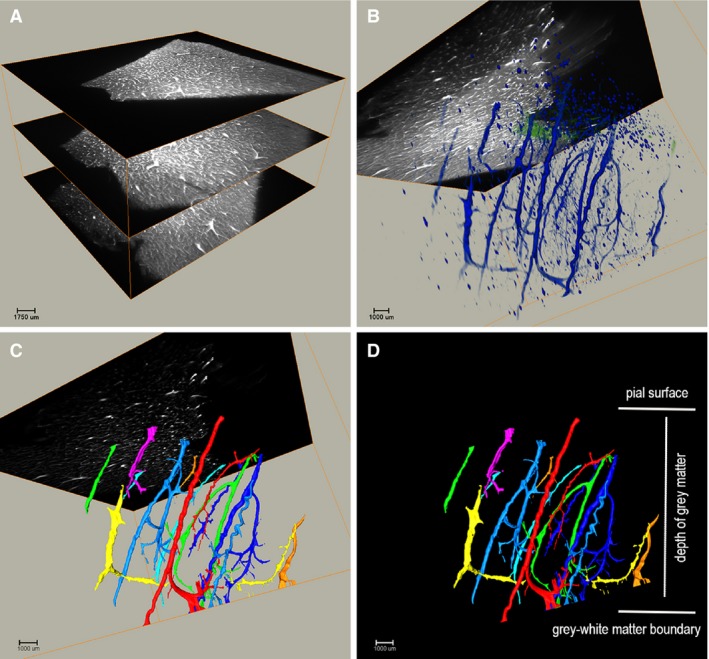
Illustration of the light sheet microscopy 3D visualisation (Video S2). Tissue blocks were visualised on a light sheet microscope to provide a comprehensive overview of the spatial arrangement of larger vessels in the human cerebral cortex. (A) Raw dataset obtained on the light sheet microscopy showing the first, middle and last images of a stack. (B) 3D visualisation of the raw stack using VolRen and MCF modules. (C) Thresholded and filtered stack to identify individual vessels. (D) 3D reconstruction illustrating the parallelism of the vessels descending perpendicularly through the grey matter. Control case.
The capillaries were visualised using the Leica TCS‐SP8 Scanning Confocal Microscope in regions of interest identified with the light sheet microscopy. Typically 2 × 3 × 3 mm cubes were dissected from the same tissue block and observed with a ×63 objective and 0.75 zoom using the excitation laser frequency of 633 and 488 nm for the vasculature and autofluorescence, respectively. For each sample, z‐stacks of approximatively 100 images separated by 1 μm were generated for subsequent 3D reconstruction and analysis.
3D reconstruction
All acquired stacks of images from the light sheet and confocal microscopes were imported into amira software (FEI v6.0) to undergo 3D visualisation using the multi‐channel field (MCF) and volume rendering modules (Fig. 1B). MCF is used to group separate channels into one object, allowing all channels to be operated on simultaneously, as well as mapping the data of each channel to black (lower data) and a chosen colour (upper data). Accordingly, we adjusted the data window of each channel to reduce the autofluorescence and noise to optimise the 3D visualisation of the vessels. The volume rendering module is used to visualise the dataset in 3D by calculating the intensity and transparency of each point of the dataset and projecting them in space.
To isolate the vessels from small non‐vascular objects, images acquired on the light sheet microscope were processed using FIJI software v1.51 US; Schindelin et al. 2012; Rueden et al. 2017) to remove the non‐specific autofluorescence by subtracting the images acquired at 488 nm from those acquired at 640 nm. The resulting images were then re‐imported in the amira software (FEI v6.0) for 3D analysis. First, the images were thresholded to reduce the non‐specific staining. To isolate the vessels from small non‐vascular objects, the thresholded dataset was further filtered with the Volume3D parameter to identify vessels based on size and number (Figs 1C and 2). Individual vessels were assigned different colours to facilitate their visualisation. Videos were produced using the animation command of the amira software show: the ‘raw dataset’ obtained prior to thresholding and autofluorescence removal (Supporting Information Video S1), and an example of the reconstruction of the raw dataset (Supporting Information Video S2).
Figure 2.
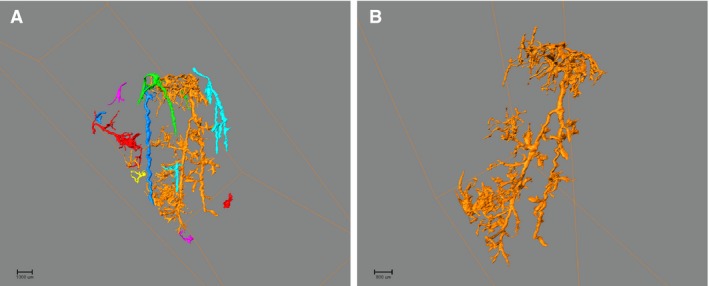
Illustration of vessel extraction. The filter command on the AMIRA software permits (A) from the entire reconstruction, the extraction of (B) an individual vessel.
Qualitative assessment
The analysis filter command on the amira software permits extraction of individual vessels for assessment (Fig. 2). Morphological features of the vasculature were qualitatively assessed on the 3D reconstructed images as present or absent using the following structured criteria: spiral/tortuous vessel morphology; anastomoses between vessels; beading for irregularities in vessel calibre; and a ‘loop‐the‐loop’ appearance, with the vessel curving back on itself before continuing on through the cortex.
Results/Discussion
Our novel clearing/staining methodology associated with software‐mediated 3D reconstruction allowed visualisation of the human cerebral cortical vasculature in formalin‐fixed brain tissue at a high level of resolution. From the light sheet microscopy reconstructions, we confirmed that the vessels travel over the surface of the brain before descending perpendicularly into the grey matter (Video S1). Within the grey matter, the vessels run parallel to one other, clustering together until they reach the grey/white matter boundary where they dissipate (Video S2). On the confocal imaging, the capillary endothelium showed an intricate network (Supporting Information Video S3; Fig. 3E,F), the arrangement of which could only be fully appreciated on the 3D reconstructions. A single capillary can branch several times without appearing to change in diameter, unlike the typical pattern of artery bifurcations or venous tributaries. Of note, using the cell nuclei for reference on the 3D images, the capillaries appear to represent a higher volume of the sample than one would appreciate from a 2D histological section. The 3D arrangement of the vessels is consistent with the 2D depiction of the cortical vasculature previously described (Duvernoy et al. 1981). However, the 3D image allows for a more comprehensive appreciation of the dense nature of the cortical vasculature, with the complementarity of the use of the light sheet (larger vessels) and confocal (capillaries) microscopy allowing the investigator to appreciate the entire course of the vessel from the cortical surface to the capillary bed.
Figure 3.
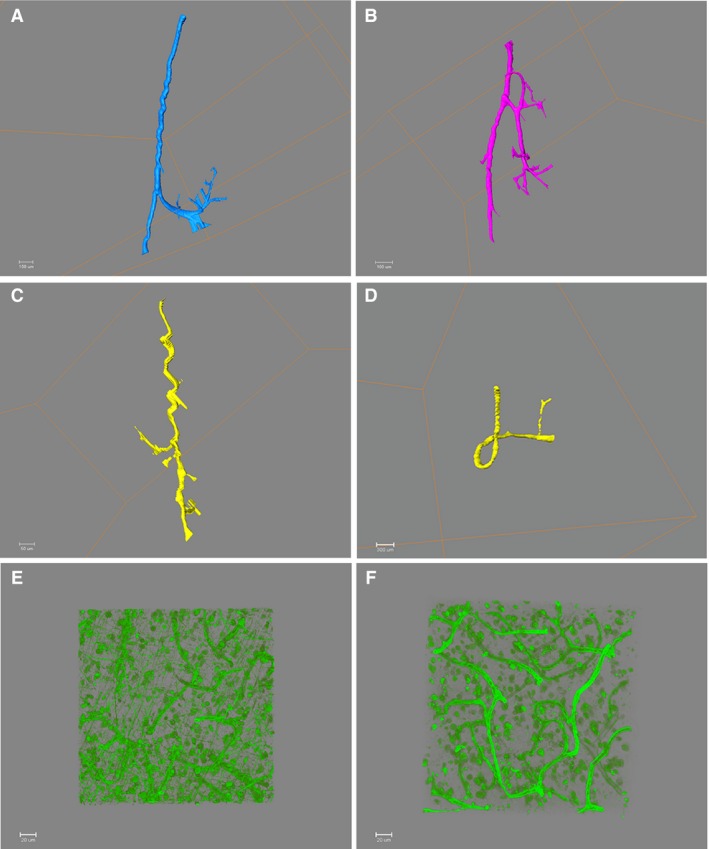
Illustration of vascular anomalies identified in 3D and of the capillaries network. Light sheet microscope images: (A) U‐shape (control case), (B) anastomosis (control case), (C) spiralling (AD) and (D) loop (iAD), (e) (iAD), (F) (control case). Capillaries observed on 3D confocal microscope image showing the intricate network.
Specific features of the cortical vasculature were observed, such as a U‐shaped profile that reflects a change of direction of the vessel near the interface between the grey and white matter (Fig. 3A). Interestingly, several vascular anomalies previously reported in thick histological sections were identified (Fischer et al. 1990), including anastomoses between nearby vessels (Fig. 3B), spiralling of vessels running perpendicular to the pial surface (Fig. 3C) and a looping appearance of the vessel (Fig. 3D). The spiralling of vessels seems likely to be consequence of cortical atrophy, with thinning of the cortex without concomitant shortening of the vessels passing through it. Cortical atrophy is associated with ageing and Alzheimer's disease and spiralling of vessels was detected in all cases examined. Long‐standing hypertension also induces changes in vascular morphology and may be relevant. These findings support and extend the identification of comparable morphological features in images previously obtained from thick histological sections imaged in figure 3 (Fischer et al. 1990). It was not possible in this pilot study to comment on whether a certain anomaly was more (or less) common in Alzheimer's disease. However, our ability to identify these anomalies signifies that the method is suitable for analysis of the vasculature comparing health and disease in larger cohorts.
The methodology is being expanded to open new areas of exploration, such as the use of fluorescently tagged antibodies permitting a wide range of targets to be visualised in 3D and to derive quantitative data regarding volumes and spatial relationships. Use of antibodies in small volumes of fresh and fixed human brain tissue has been reported (Liu et al. 2016), although antibody penetration in large volumes of tissue appears to be challenging. Recent work has focused on the development of methods that allow for repeated rounds of tissue labelling in human and rodent tissue (Murray et al. 2015). One of the main advantages of 3D analysis as compared with 2D histology is the potential for ascertaining accurate data, such as volumes and distances, that are more representative of the architecture of the human brain and conditions of interest. For example, in the context of ageing and dementia, quantitative estimates of the various forms of vascular pathology and their relations to vascular risk factors, abnormally aggregating proteins such as amyloid‐β and tau, and neuronal and synaptic loss would be of importance.
This methodology presents the advantages of low cost and high scalability. Indeed, it is possible to run the protocol on up to 25 samples simultaneously, increasing the size of study as required to achieve statistical power for case/control comparison. This tissue preparation method employs readily available reagents, has no need for special equipment and can be applied to large volume samples of long‐term archival formalin‐fixed human tissue, compared with other 3D protocols (Erturk et al. 2012, 2014; Chung et al. 2013; Erturk & Bradke, 2013; Renier et al. 2014). The original descriptions of CLARITY and 3DISCO used endogenously fluorescent mouse tissue that had shorter protocols, as they did not require a staining step (Erturk et al. 2012; Chung et al. 2013; Erturk & Bradke, 2013); both procedures were 4 days to a week in length, comparable to the permeabilisation and clearing steps in our human protocol. As with other protocols using fluorescent labels, the stained specimens need to be kept in the dark prior to imaging.
Currently, the methodology includes a degree of subjectivity in the image processing. Indeed, some vessel qualities seen in the raw dataset, such as beading (not illustrated), were lost with processing. In addition, 3D imaging methods as described are relatively new and are evolving rapidly. The images presented here give a subjective insight into the benefits and show the potential for quantification of aspects of microanatomy, such as vascular density per unit volume. At present, suitable software is not yet available, but this is clearly a priority for future development.
To conclude, this method is a practical, cost‐effective and simple way to investigate vascular morphology in 3D, adding to the current interest in 3D clearing protocols. In particular, we have demonstrated that this protocol can be successfully applied to tissue volumes that can encompass the whole thickness of the human cerebral cortex in human post‐mortem brain samples that have been preserved in formalin for prolonged periods and can thus open new areas of investigation using tissue available in the brain banks.
Author contributions
C. H. Harrison: light sheet tissue preparation, images acquisition and manuscript writing. G. R. Buckland: confocal tissue preparation, image acquisition, manuscript review. S. E. Brooks: light sheet microscopy expertise and support. D. A. Johnston; confocal microscopy expertise and support. D. S. Chatelet: image analysis software expertise and support. A. K. L. Liu and S. M. Gentleman: tissue‐clearing protocols expertise. D. Boche and J. A. R. Nicoll: conception and design of the study, sample selection, manuscript writing. All co‐authors have reviewed the manuscript.
Supporting information
Video S1. 3D reconstruction of neocortical vasculature, raw dataset.
Video S2. 3D reconstruction of neocortical vasculature, with autofluorescence removal and thresholding.
Video S3. 3D reconstruction of the capillary meshwork.
Acknowledgements
Support for this study included Alzheimer Research UK (ART/PG2006/4 and ART‐EXT2010‐1) and the Medical Research Council UK (G0501033). Tissue samples were obtained from University Hospital Southampton NHS Foundation Trust as part of the UK Brain Archive Information Network (BRAIN UK), which is funded by the Medical Research Council and brainstrust.
References
- Boche D, Zotova E, Weller RO, et al. (2008) Consequence of Abeta immunization on the vasculature of human Alzheimer's disease brain. Brain 131, 3299–3310. [DOI] [PubMed] [Google Scholar]
- Chung K, Wallace J, Kim SY, et al. (2013) Structural and molecular interrogation of intact biological systems. Nature 497, 332–337. [DOI] [PMC free article] [PubMed] [Google Scholar]
- Davidson MW, Campbell RE (2009) Engineered fluorescent proteins: innovations and applications. Nat Methods 6, 713–717. [DOI] [PubMed] [Google Scholar]
- Duvernoy HM, Delon S, Vannson JL (1981) Cortical blood vessels of the human brain. Brain Res Bull 7, 519–579. [DOI] [PubMed] [Google Scholar]
- Erturk A, Bradke F (2013) High‐resolution imaging of entire organs by 3‐dimensional imaging of solvent cleared organs (3DISCO). Exp Neurol 242, 57–64. [DOI] [PubMed] [Google Scholar]
- Erturk A, Becker K, Jahrling N, et al. (2012) Three‐dimensional imaging of solvent‐cleared organs using 3DISCO. Nat Protoc 7, 1983–1995. [DOI] [PubMed] [Google Scholar]
- Erturk A, Lafkas D, Chalouni C (2014) Imaging cleared intact biological systems at a cellular level by 3DISCO. J Vis Exp 89, 51382. [DOI] [PMC free article] [PubMed] [Google Scholar]
- Fischer VW, Siddiqi A, Yusufaly Y (1990) Altered angioarchitecture in selected areas of brains with Alzheimer's disease. Acta Neuropathol 79, 672–679. [DOI] [PubMed] [Google Scholar]
- Florey H (1925) Microscopical observations on the circulation of the blood in the cerebral cortex. Brain 1, 43–64. [Google Scholar]
- Jilani SM, Murphy TJ, Thai SN, et al. (2003) Selective binding of lectins to embryonic chicken vasculature. J Histochem Cytochem 51, 597–604. [DOI] [PubMed] [Google Scholar]
- Kalaria R, Ferrer I, Love S (2015) Vascular disease, hypoxia, and related conditions In: Greenfield's Neuropathology. (eds Love S, Budka H, Ironside JW, Perry A.), pp. 65–74, New York: CRC Press Taylor & Francis Group. [Google Scholar]
- Liu AK, Hurry ME, Ng OT, et al. (2016) Bringing CLARITY to the human brain: visualisation of Lewy pathology in three‐dimensions. Neuropathol Appl Neurobiol 42, 573–587. [DOI] [PMC free article] [PubMed] [Google Scholar]
- Marx V (2016) Optimizing probes to image cleared tissue. Nature Methods 13, 206–209. [DOI] [PubMed] [Google Scholar]
- Murray E, Cho JH, Goodwin D, et al. (2015) Simple, scalable proteomic imaging for high‐dimensional profiling of intact systems. Cell 163, 1500–1514. [DOI] [PMC free article] [PubMed] [Google Scholar]
- Nachbar MS, Oppenheim JD, Thomas JO (1980) Lectins in the U.S. diet. Isolation and characterization of a lectin from the tomato (Lycopersicon esculentum). J Biol Chem 255, 2056–2061. [PubMed] [Google Scholar]
- Nag S (1985) Ultrastructural localization of lectin receptors on cerebral endothelium. Acta Neuropathol 66, 105–110. [DOI] [PubMed] [Google Scholar]
- Renier N, Wu Z, Simon DJ, et al. (2014) iDISCO: a simple, rapid method to immunolabel large tissue samples for volume imaging. Cell 159, 896–910. [DOI] [PubMed] [Google Scholar]
- Robertson RT, Levine ST, Haynes SM, et al. (2015) Use of labeled tomato lectin for imaging vasculature structures. Histochem Cell Biol 143, 225–234. [DOI] [PubMed] [Google Scholar]
- Rueden CT, Schindelin J, Hiner MC, et al. (2017) ImageJ2: ImageJ for the next generation of scientific image data. BMC Bioinformatics1 doi:10.1186/s12859‐017‐1934‐z. [DOI] [PMC free article] [PubMed] [Google Scholar]
- Schindelin J, Arganda‐Carreras I, Frise E, et al. (2012) Fiji: an open‐source platform for biological‐image analysis. Nat Methods 9, 676–682. [DOI] [PMC free article] [PubMed] [Google Scholar]
Associated Data
This section collects any data citations, data availability statements, or supplementary materials included in this article.
Supplementary Materials
Video S1. 3D reconstruction of neocortical vasculature, raw dataset.
Video S2. 3D reconstruction of neocortical vasculature, with autofluorescence removal and thresholding.
Video S3. 3D reconstruction of the capillary meshwork.