

Abstract
Purpose
To quantify the burden and distribution of asymptomatic atherosclerosis in a population with a low to intermediate risk of cardiovascular disease.
Materials and Methods
Between June 2008 and February 2013, 1528 participants with 10-year risk of cardiovascular disease less than 20% were prospectively enrolled. They underwent whole-body magnetic resonance (MR) angiography at 3.0 T by using a two-injection, four-station acquisition technique. Thirty-one arterial segments were scored according to maximum stenosis. Scores were summed and normalized for the number of assessable arterial segments to provide a standardized atheroma score (SAS). Multiple linear regression was performed to assess effects of risk factors on atheroma burden.
Results
A total of 1513 participants (577 [37.9%] men; median age, 53.5 years; range, 40–83 years) completed the study protocol. Among 46 903 potentially analyzable segments, 46 601 (99.4%) were interpretable. Among these, 2468 segments (5%) demonstrated stenoses, of which 1649 (3.5%) showed stenosis less than 50% and 484 (1.0%) showed stenosis greater than or equal to 50%. Vascular stenoses were distributed throughout the body with no localized distribution. Seven hundred forty-seven (49.4%) participants had at least one stenotic vessel, and 408 (27.0%) participants had multiple stenotic vessels. At multivariable linear regression, SAS correlated with age (B = 3.4; 95% confidence interval: 2.61, 4.20), heart rate (B = 1.23; 95% confidence interval: 0.51, 1.95), systolic blood pressure (B = 0.02; 95% confidence interval: 0.01, 0.03), smoking status (B = 0.79; 95% confidence interval: 0.44, 1.15), and socioeconomic status (B = −0.06; 95% confidence interval: −0.10, −0.02) (P < .01 for all).
Conclusion
Whole-body MR angiography identifies early vascular disease at a population level. Although disease prevalence is low on a per-vessel level, vascular disease is common on a per-participant level, even in this low- to intermediate-risk cohort.
© RSNA, 2018
See also the editorial by Leiner in this issue.
Introduction
Cardiovascular disease is the leading cause of mortality and morbidity resulting in 30.8% of all deaths in the United States (1). Atheroma develops over time and subclinical disease is present for some time before clinical symptoms are noticed (2). Current techniques for early plaque detection such as coronary calcium scoring and carotid intima-media thickness measurement are all currently limited to one cardiovascular territory. Atherosclerosis is, however, a systemic disease affecting the entire body; thus, early atherosclerosis may be missed by using single-site techniques.
Global efforts have focused on both the ability to use imaging to better understand the interaction between genetics and early disease (such as in the UK Biobank Imaging substudy, which is in the process of imaging 100 000 of the 500 000 originally enrolled in the overarching UK Biobank study [3]) and the role of whole-body imaging as a screening technique at a population level (such as in the Study of Health in Pomerania [SHIP] study [4]). Contrast material–enhanced whole-body magnetic resonance (MR) angiography is one such technique, which allows a systematic approach to imaging the entire vascular tree to stratify and to quantify cardiovascular disease (5–11). MR angiography has been shown to be highly accurate in detection of stenosis when compared with invasive angiography (12,13), and previous reports have shown that global atheroma burden quantified by using contrast-enhanced whole-body MR angiography correlates with cardiovascular risk, the presence of coronary artery disease, and both single and recurrent cardiovascular events (14–18). However, to date, to our knowledge, contrast-enhanced whole-body MR angiography has not been examined in a large population free from clinically apparent cardiovascular disease.
We hypothesized that early disease would be present even in those patients considered to be at low to intermediate risk for cardiovascular disease. Therefore, the purpose of our study was to quantify the burden and distribution of asymptomatic atherosclerosis in a population with a low to intermediate risk of cardiovascular disease.
Materials and Methods
Our study (Tayside Screening for Cardiac Events, or TASCFORCE) is a prospective normal volunteer cardiovascular risk screening study (no. ISRCTN38976321). Our protocol was approved by the Tayside Committee of Medical Research Ethics. Written informed consent was obtained from each participant prior to enrollment in our study.
From June 2008 to February 2013, men and women aged 40 years or older living in either Tayside or Fife, Scotland were eligible for participation. Recruitment was performed by using a random cluster sampling pattern with preplanned periodic sample review to ensure the recruited population accurately represented the sex, age, and socioeconomic status of the Tayside population from which it was drawn. When deviations from this occurred, recruitment strategies were modified to target those groups who were underrepresented. Exclusion criteria were as follows: known atherosclerotic disease, predicted increased risk of cardiovascular disease requiring statin treatment according to guideline 97 of the Scottish Intercollegiate Guideline Network (17) (risk increased ≥20% in 10 years), blood pressure greater than 145/90 mm Hg, diabetes, and inability to give informed consent. To produce a cohort able to participate in a potential future statin intervention study, the following individuals were also excluded: those with primary muscle disease, biochemical abnormalities, other serious illnesses or abnormalities that may compromise the participant's safety taking a statin, or known alcohol abuse; participants in a clinical trial other than observational trials or registries concurrently or within 30 days prior to screening; and women who were pregnant, breastfeeding, or of child-bearing potential who were not using adequate contraception. These criteria were examined at visit 1, during which blood was collected for cholesterol measurement in nonfasting conditions (random sample) to allow calculation of both the cardiovascular risk score and brain natriuretic peptide. Those with diabetes were excluded from the study. If the level of random blood glucose serum was greater than 7 mmol/L, then they were excluded from the study and referred to their family practitioner for further work-up. Smoking status was self-classified by participants as never smoker, ex-smoker, or current smoker. The Scottish Index of Multiple Deprivation was calculated based on the home address of the participants used for the calculation of each individual’s ASSIGN (or Assessing cardiovascular risk using Scottish Intercollegiate Guideline Network guidelines) score (19). All participants who took part in the imaging substudy underwent MR imaging at visit 2.
MR Imaging Acquisition Technique
Cardiac MR and contrast-enhanced whole-body MR angiography were performed at a single center. The imaging protocol for TASCFORCE and the results of the cardiac analysis of 1515 participants have been previously described (20–23). This is the first report of the vascular analysis for our TASCFORCE imaging study. Imaging was performed in an integrated examination with a 32-channel 3.0-T Magnetom Trio (Siemens, Munich, Germany). For the contrast-enhanced whole-body MR angiography, surface coils covering the whole body were placed on each of the participants in our study. Unenhanced MR angiography “mask” data were acquired for the thoracic and neck stations and the calf station by using a three-dimensional turbo FLASH sequence. A dose of 10 mL of 0.5 mmol/mL gadoterate meglumine (Dotarem; Guerbet, France) followed by 20 mL 0.9% sodium chloride were then injected at a rate of 1.5 mL/sec. The contrast-enhanced acquisition for station 1 (thoracic and neck vessels) commenced when the contrast agent attained the superior-most aspect at the top of the aortic arch. Postcontrast data for station 4 (the calves) were acquired immediately after completion of station 1, and these were acquired three times consecutively to optimize capture of peak arterial enhancement in both limbs. Following a delay, a three-dimensional turbo FLASH mask data were acquired for station 2 (abdominopelvic vessels) and station 3 (thigh vessels). The second dose of 15 mL of gadoterate meglumine was infused at 1.5 mL/sec followed by a 20-mL normal saline flush. Acquisition was triggered when the bolus could be seen arriving in the abdominal aorta. Postcontrast data for station 3 were acquired immediately after completion of the station 2 sequence. The mean time between first and second injections of contrast agent was 19 minutes, with a total imaging time of 50 minutes.
Contrast-enhanced Whole-Body MR Angiography Scoring Technique
The MR angiography images were independently analyzed by one of four observers blinded to the clinical characteristics of the study participant (G.H., R.W., J.W.M., and M.A.L., with 20, 5, 4, and 2 years of vascular radiology experience, respectively) by using a picture archiving and communications system (Carestream PACS, version 10.1; Rochester, NY) with the original source images, subtracted multiplanar reconstructions, and maximum intensity projections. The arterial tree was divided into 31 segments: right and left internal carotid arteries, right and left vertebral arteries, right and left common carotid arteries, innominate artery, right and left subclavian arteries, aortic arch, thoracic aorta, abdominal aorta, celiac trunk, superior mesenteric artery, inferior mesenteric artery, right and left renal arteries, right and left iliac arteries, right and left femoral arteries (incorporating common and superficial femoral artery), right and left profunda femoris arteries, right and left popliteal arteries, right and left anterior tibial arteries, right and left peroneal arteries, and right and left posterior tibial arteries. Each arterial segment was visually assessed for the region of greatest stenosis. The severity of the stenosis was scored by visually comparing the degree of stenosis with the normal diameter of an unaffected part of the vessel on tangential longitudinal views of the vessel by using multiplanar reformating. Each segment was coded 0–9 according to the maximum stenosis present within the vessel (codes 0–4) and the presence of aneurysmal dilation (codes 5–9) as per Table 1. For instance, a code of zero would represent a completely normal vessel with neither stenosis nor aneurysm, a code of 3 would indicate that the tightest stenosis within the vessel was in the magnitude of 71%–99%, and a code of 9 would be an aneurysmal occluded vessel. This code was then converted to a final vessel score as per Table 1.
Table 1.
Coding and Scoring for Contrast-enhanced Whole-Body MR Angiography Arterial Segments
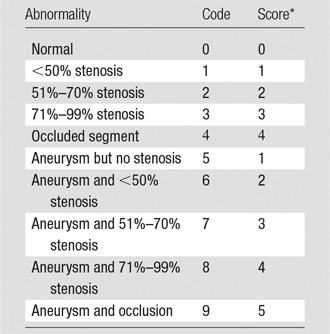
Note.—Aneurysmal and stenotic status were coded and scored according to severity of stenosis.
*Score ascribed to contribute to whole-body atheroma score.
Arterial segments that were not visualized with sufficient clarity for grading of the degree of stenosis were recorded as unassessable. To account for this, the final score was divided by the number of segments that had been successfully analyzed, and then calculated as a percentage of the maximum possible stenosis score to produce a standardized atheroma score (SAS) (17) by using the following equation: SAS = [(∑MRA scores/number of assessable segments)/4] × 100. The reproducibility of this scoring technique has been previously reported based on the analysis of 48 images randomly selected by the trial statistician with excellent intra- and interobserver agreement (20). See Figure 1 for examples of contrast-enhanced whole-body MR angiography.
Figure 1:

Image shows examples of whole-body angiograms. A, Normal study with no disease evident in a 45-year-old woman. B, Evidence of extensive disease including left carotid bulb stenosis (black arrow), bilateral renal artery stenosis (white arrows), and occluded right superficial femoral artery (arrowhead) in a 53-year-old woman.
All images were also separately reviewed and reported for incidental findings by a radiologist (G.H. or J.W.M.) shortly after acquisition.
Statistical Analysis
Data are expressed as mean ± standard deviation for continuous variables, median and range for ordinal variables, and number and percentage of participants for nominal variables. Normality tests were performed; if the test failed, then standard transformations were used when possible to generate a Gaussian distribution. The statistical analysis plan was predetermined before data analyses. To compare those who underwent MR imaging with those who did not, a t test was used for normally distributed variables, Mann-Whitney test for skewed and ranked variables, and χ2 test for binomial variables to test the null hypothesis that samples originate from the same source. Univariable linear regression was used to assess for correlation between the SAS and baseline demographic data in both the whole population and in men and women separately. A multivariable linear regression was performed in the whole population with sex accounted for within the model as a dichotomous nominal variable. The model included age, sex, smoking status, systolic blood pressure, diastolic blood pressure, heart rate, total cholesterol, high-density lipoprotein cholesterol, low-density lipoprotein cholesterol, triglycerides, body mass index, waist circumference, family history of cardiovascular disease, Scottish Index of Multiple Deprivation decile, and brain natriuretic peptide level. Those variables with a positively skewed distribution were log transformed to create a near-normal distribution. Statistical analyses were performed by using the computer software R (version 3.1; R Foundation for Statistical Computing, Vienna, Austria) and SPSS (version 21; IBM, New York). A two-sided P value of < .05 was considered to indicate statistical significance for analyses.
Results
A total of 4423 participants were recruited to our TASCFORCE study. Figure 2 summarizes the flow of these participants. Among the 2047 participants eligible for and offered MR imaging, 373 (18.2%) did not give consent to undergo imaging and 14 (0.6%) failed to attend their MR imaging appointment. In addition, 101 (4.9%) were not imaged because of claustrophobia (n = 83), large body habitus (n = 3), problems with intravenous cannulation (n = 13) or other technical issues (n = 2). Another 34 (1.7%) participants were considered unsafe to undergo imaging because of the presence of metalwork. Among the 2047 participants, 1528 (74.6%) completed or partially completed the imaging protocol with 15 (1.0%) excluded because of missing or incomplete data, leaving 1513 participants in the final analysis. The characteristics of those who did not complete imaging and those who did undergo imaging are summarized in Table 2.
Figure 2:

Participant flow diagram. BNP = brain natriuretic peptide, CV = cardiovascular, WBMRA = whole-body MR angiography.
Table 2.
Characteristics of Those Who Underwent MR Imaging and Those Who Declined or Were Unable to Complete Imaging

Note.—Unless otherwise specified, data are the number of participants, with percentages in parentheses. ASSIGN = Assessing cardiovascular risk using Scottish Intercollegiate Guideline Network.
*Unpaired t test was used for normally distributed variables, Mann-Whitney test for skewed and ranked variables, and χ2 test for binomial variables. Scottish Index of Multiple Deprivation was treated as a continuous variable for the purpose of analysis.
†Data are medians, with ranges between quartiles in parentheses.
‡Data are means ± standard deviation.
Incidental Findings at MR Imaging
Among the 1528 participants who were imaged, 34 (2.2%) had incidental findings at MR imaging that were considered clinically notable by the reviewing radiologists. These findings included myocardial infarction (n = 3); structural cardiac abnormalities (n = 7) including cardiomyopathies, septal defects, and enlargement of cardiac chambers; benign mass (n = 10); malignant mass (n = 1); peripheral artery abnormality (n = 6) including substantial occlusions or aneurysms; noteworthy anatomic variant (n = 5); and others (n = 2). These findings resulted in 16 participants undergoing further downstream testing and 32 undergoing additional review by our study physician (n = 6), their family physician (n = 9), or a hospital specialist (n = 17) (see Tables E1 and E2 [online] for an overview of the incidental findings and activity resulting from them). Other than these described abnormalities for which further follow-up and/or intervention were deemed necessary, the findings of the contrast-enhanced whole-body MR angiography were blinded to the patient and their clinicians so as to allow accurate longitudinal assessment of its implications, in addition to the lack of proof of intervention currently based on these findings.
Contrast-enhanced Whole-Body MR Angiography Results
A total of 1513 participants were included in the final analysis. A breakdown of the number of arterial segments according to the degrees of luminal stenosis and other abnormalities is illustrated graphically in Figure 3. The presence and degree of abnormality is given for each of the 31 segments analyzed per participant to show the distribution of abnormality. The vast majority of segments (44435 of 46903, 94.7%) were assessed as normal. Among the vessel segments assessed to have some stenosis or aneurysm, 3.5% (1649 of 46903) had mild stenosis (<50%), and 1.0% (484 of 46903) exhibited stenosis greater than or equal to 50%. Forty arterial segments were aneurysmal, although only seven of these were associated with a stenosis. Therefore, the greatest contribution toward the SASs greater than zero came from stenoses.
Figure 3:

Graph shows incidence of stenoses according to grade and of aneurysm. Total 1 = stenosis less than 50%, total 2 = stenosis of 51%–70%, total 3 = stenosis of 71%–99%, total 4 = occlusion, total >4 = presence of aneurysm with or without stenosis. ABD AO = abdominal aorta, AOR A = aortic arch, AT = anterior tibial artery, CCA = common carotid artery, COEL = celiac trunk, ICA = internal carotid artery, ILIAC = iliac artery, FEM = femoral artery, IMA = inferior mesenteric artery, IN AR = innominate artery, L = left, PER = peroneal artery, POP = popliteal artery, PROF = profunda femoris artery, PT = posterior tibial artery, R = right, REN = renal artery, SC = subclavian artery, SMA = superior mesenteric artery, THOR AO = thoracic aorta, VA = vertebral artery.
The celiac trunk was disproportionately affected by stenosis, and it was also the vessel with the poorest interobserver repeatability (Fleiss κ, 0.66 vs ≥0.81 in all the other districts) (20). Because this stenosis could potentially be either atherosclerotic or secondary to median arcuate ligament compression, the celiac trunk was excluded from the calculation of the SAS and subsequent analysis.
Despite 94.7% of vessels being normal, 747 (49.4%) of 1513 participants had at least one stenotic vessel and 408 participants (27.0%) had stenoses involving multiple arterial segments. At an individual participant level, the number of segments affected are summarized in Figure 4. The distribution of the SAS is illustrated in Figure 5 and demonstrate a marked positive skew.
Figure 4:

Graph shows incidence of stenotic disease according to number of segments involved per participant (celiac trunk excluded).
Figure 5:

Graph shows distribution of standardized atheroma scores in population (celiac trunk excluded).
Correlation of Contrast-enhanced Whole-Body MR Angiography Results with Risk Factors
The correlations between the SAS and the baseline demographic and risk factors were assessed by using univariable analysis (Table E3 [online]). A significant correlation with SAS was present for age (ρ = 0.25; P < .001), systolic blood pressure (ρ = 0.11; P < .001), total cholesterol (ρ = 0.16; P < .001), low-density lipoprotein (ρ = 0.12; P < .001), and the Adult Treatment Panel III cardiovascular risk score for both the total population (ρ = 0.15; P < .001) and for men (ρ = 0.28; P < .001) and women (ρ = 0.22; P < .001) separately. Triglycerides showed a correlation for women only, whereas the Scottish Index of Multiple Deprivation showed a correlation when considered for the whole population, but not when analyzed for each individual sex.
Linear multiple regression modeling demonstrated that age, heart rate, systolic blood pressure, Scottish Index of Multiple Deprivation decile, ex-smoking status, and current smoking status were independently associated with SAS (Table 3).
Table 3.
Multivariable Analysis of Traditional Cardiovascular Risk Factors, Sociodemographic Factors, and BNP in Relation to Standardized Atheroma Score

Note.—Data in parentheses are 95% confidence intervals. BNP = brain natriuretic peptide, NS = not significant.
*Proportion of variability (adjusted r2) explained by cardiovascular, demographic, and blood markers included in model.
Because the SAS was very positively skewed, further sensitivity analysis was performed examining both those with a SAS above and below the 80th percentile and the number of stenosed vessels, rather than the SAS. The baseline characteristics of those with a SAS above the 80th percentile are compared with those below the 80th percentile in Table E4 (online). Men and women with a SAS above the 80th percentile were older, had a higher systolic blood pressure, and had a higher predicted risk of coronary heart disease when compared with those with a SAS below the 80th percentile. Additionally, men were more likely to be current or ex-smokers and women had a higher level of total and low-density lipoprotein cholesterol and triglycerides. If the number of stenosed vessels was used rather than using the SAS, or if the population was split into those with and without any vascular stenosis, then similar results were seen demonstrating the robustness of the observations (Tables E5 and E6 [online]).
Discussion
Our study shows that within a population considered to be at low to intermediate risk of cardiovascular disease, disease prevalence is low on a per-vessel basis at 5.3%. However, 49.4% of participants have at least one vessel with stenotic disease and 27% have multivessel disease. This disease is relatively evenly distributed throughout the cardiovascular system.
There was a high technical success rate with only 15 of the 1528 studies (1%) being considered nondiagnostic, demonstrating the aptitude of the technique for more widespread use. Our finding that both the atheroma burden and number of stenotic vessels correlated with age, blood pressure, cholesterol, and cardiovascular risk is perhaps unsurprising because these are all risk factors for cardiovascular events (24). We demonstrate a significant association between the global atheroma burden and socioeconomic deprivation, which is in keeping with prior observations of socioeconomic deprivation being a marker of cardiovascular risk (25). Similar associations between socioeconomic status and carotid intima-media thickness have been described in adulthood, as well as in children as young as 10 years. The exact causative mechanism is under debate, but is most likely an interplay of stress, secondhand smoke, and diet (26,27). These findings provide validation of the SAS for the detection of subclinical atherosclerosis in a population not considered to be at high risk for cardiovascular events. Our prevalence of atherosclerotic changes of 49.4% is much lower than the 68% in the Prospective Investigation of the Vasculature in Uppsala Seniors (PIVUS) study (18); however, this previous study included those with known cardiovascular disease and focused on an older cohort, only recruiting people aged 70 years. In contrast, our rates are much higher than the prevalence of vascular disease of 21% seen in a previous study in 298 healthy study participants by using a variant of the whole-body technique. However, the authors of this previous study only looked for atherosclerotic disease causing stenosis greater than 50%, ignoring lower-grade stenoses (7).
Although the vast majority of arterial segments in the contrast-enhanced whole-body MR angiography were normal, almost 50% of the population exhibited preclinical stenotic disease, with more than 25% exhibiting multifocal disease. For our study, of the vessels affected by early atherosclerosis, the most common sites detected were the abdominal aorta and iliac arteries. This finding is of particular interest because both areas are poorly evaluated with current imaging strategies such as coronary calcium scoring or carotid intima-media thickness measurement.
Although we have demonstrated the ability of contrast-enhanced whole-body MR angiography to detect extensive subclinical disease, the clinical importance of this is yet to be established, as is the best method for quantifying the extent of atherosclerosis. The PIVUS study showed that the SAS was the strongest predictor of major adverse cardiovascular events at 5 years, and improved discrimination and reclassification when added to the Framingham risk score, with superior predictive value to carotid intima-media thickness and ankle-brachial pressure index (14). However, the authors did not compare this with the number of diseased vessels. A previous study in those with diabetes mellitus demonstrated that both the SAS and the number of diseased vessels conferred prognostic benefits over traditional cardiovascular risk markers (15). Long term follow-up at 5, 10, and 15 years is planned in our TASCFORCE study and will allow us to determine if these observations hold true in a low- to intermediate-risk cohort. It will also allow comparison of the different metrics of quantifying atheroma development and distribution to determine whether it is certain vessels, a combination of vessels, or a global summation of disease burden that are the best markers of cardiovascular risk. Determination of a particular risk profile of high-risk sites may help target other cheaper, more accessible modalities to the relevant vessels, increasing the prognostic yield of these.
Our study had several limitations. Contrast-enhanced whole-body MR angiography is a lumenographic technique, thus potentially missing early vascular changes where there is positive remodeling. Several promising MR imaging techniques exist for wall thickening and detection of early fatty streak deposition (28); however, to date, these have only been applied in singular vascular territories with the inherent weaknesses of this, as discussed above. In addition, the coronary arteries were not assessed. Atheroma burden at contrast-enhanced whole-body MR angiography has previously been demonstrated to correlate well with the presence of obstructive coronary artery disease (29); thus, our current results would suggest the presence of substantial undetected disease within the coronary circulation as well. At the time of our study design, MR coronary angiography was in its infancy, being time-consuming, technically challenging, and of limited accuracy; however, recent advances mean it may be incorporated into future whole-body angiography. It will be worthwhile to examine the additional disease burden and the prognostic value that MR coronary angiography could yield (30).
In conclusion, contrast-enhanced whole-body MR angiography identifies early vascular disease at a population level, and the systematic nature of its evaluation allows it to detect early atherosclerotic disease missed by using modalities that only assess single vascular sites.
Implications for Patient Care
■ Whole-body MR angiography is feasible at a population level and detects early atherosclerotic disease missed by using modalities that assess single vascular sites.
■ Early atherosclerotic disease detected with whole-body MR angiography is scattered throughout the body; thus, early disease would be missed by evaluating only a single vascular territory.
SUPPLEMENTAL TABLE
Received July 20, 2017; revision requested September 14; accepted February 8. 2018.
Supported by Chest Heart and Stroke Scotland and Souter Foundation. D.L. supported by Tenovus. J.R.W.M. supported by Wellcome Trust through the Scottish Translational Medicine and Therapeutics Initiative (WT 085664) in the form of a Clinical Research Fellowship.
M.A.L. and J.R.W.M. contributed equally to this work..
Disclosures of Conflicts of Interest: M.A.L. disclosed no relevant relationships. J.R.W.M. Activities related to the present article: author received support for travel to meetings for the study or other purposes from Guerbet; institution received the contrast material (Dotarem) from Guerbet. Activities not related to the present article: author received payment for lectures including service on speakers bureaus from Guerbet. Other relationships: disclosed no relevant relationships. M.S. disclosed no relevant relationships. S.J.G. disclosed no relevant relationships. D.L. disclosed no relevant relationships. I.C. disclosed no relevant relationships. R.L. disclosed no relevant relationships. J.A.M. disclosed no relevant relationships. S.Z.M. Activities related to the present article: disclosed no relevant relationships. Activities not related to the present article: institution received research support from Guerbet. Other relationships: disclosed no relevant relationships. R.S.N. disclosed no relevant relationships. A.D.S. disclosed no relevant relationships. F.S. disclosed no relevant relationships. S.A.H. disclosed no relevant relationships. R.D.W. disclosed no relevant relationships. J.J.F.B. Activities related to the present article: disclosed no relevant relationships. Activities not related to the present article: serves on advisory board for Amgen, AstraZeneca, and Bayer; received payment for lectures including service on speakers bureaus from Amgen and Novartis; institution received payment from AstraZeneca for advisory board membership. Other relationships: disclosed no relevant relationships. J.G.H. Activities related to the present article: disclosed no relevant relationships. Activities not related to the present article: institution received a grant from Guerbet. Other relationships: disclosed no relevant relationships.
Abbreviations:
- SAS
- standardized atheroma score
- TASCFORCE
- Tayside Screening for Cardiac Events
References
- 1.Mozaffarian D, Benjamin EJ, Go AS, et al. Heart disease and stroke statistics—2016 update: a report from the American Heart Association. Circulation 2016;133(4):e38–e360. [DOI] [PubMed] [Google Scholar]
- 2.Jaffer FA, O’Donnell CJ, Larson MG, et al. Age and sex distribution of subclinical aortic atherosclerosis: a magnetic resonance imaging examination of the Framingham Heart Study. Arterioscler Thromb Vasc Biol 2002;22(5):849–854. [DOI] [PubMed] [Google Scholar]
- 3.Petersen SE, Matthews PM, Bamberg F, et al. Imaging in population science: cardiovascular magnetic resonance in 100,000 participants of UK Biobank—rationale, challenges and approaches. J Cardiovasc Magn Reson 2013;15(1):46. [DOI] [PMC free article] [PubMed] [Google Scholar]
- 4.Hegenscheid K, Kühn JP, Völzke H, Biffar R, Hosten N, Puls R. Whole-body magnetic resonance imaging of healthy volunteers: pilot study results from the population-based SHIP study. Rofo 2009;181(8):748–759. [DOI] [PubMed] [Google Scholar]
- 5.Fenchel M, Requardt M, Tomaschko K, et al. Whole-body MR angiography using a novel 32-receiving-channel MR system with surface coil technology: first clinical experience. J Magn Reson Imaging 2005;21(5):596–603. [DOI] [PubMed] [Google Scholar]
- 6.Kramer H, Schoenberg SO, Nikolaou K, et al. Cardiovascular screening with parallel imaging techniques and a whole-body MR imager. Radiology 2005;236(1):300–310. [DOI] [PubMed] [Google Scholar]
- 7.Goehde SC, Hunold P, Vogt FM, et al. Full-body cardiovascular and tumor MRI for early detection of disease: feasibility and initial experience in 298 subjects. AJR Am J Roentgenol 2005;184(2):598–611. [DOI] [PubMed] [Google Scholar]
- 8.Lin J, Chen B, Wang JH, Zeng MS, Wang YX. Whole-body three-dimensional contrast-enhanced magnetic resonance (MR) angiography with parallel imaging techniques on a multichannel MR system for the detection of various systemic arterial diseases. Heart Vessels 2006;21(6):395–398. [DOI] [PubMed] [Google Scholar]
- 9.Napoli A, Anzidei M, Marincola BC, et al. Optimisation of a high-resolution whole-body MR angiography protocol with parallel imaging and biphasic administration of a single bolus of Gd-BOPTA: preliminary experience in the systemic evaluation of atherosclerotic burden in patients referred for endovascular procedures. Radiol Med (Torino) 2009;114(4):538–552. [DOI] [PubMed] [Google Scholar]
- 10.Ruehm SG, Goehde SC, Goyen M. Whole body MR angiography screening. Int J Cardiovasc Imaging 2004;20(6):587–591. [DOI] [PubMed] [Google Scholar]
- 11.Waugh SA, Ramkumar PG, Gandy SJ, et al. Optimization of the contrast dose and injection rates in whole-body MR angiography at 3.0T. J Magn Reson Imaging 2009;30(5):1059–1067. [DOI] [PubMed] [Google Scholar]
- 12.van den Bosch HC, Westenberg JJ, Caris R, et al. Peripheral arterial occlusive disease: 3.0-T versus 1.5-T MR angiography compared with digital subtraction angiography. Radiology 2013;266(1):337–346. [DOI] [PubMed] [Google Scholar]
- 13.Menke J, Larsen J. Meta-analysis: accuracy of contrast-enhanced magnetic resonance angiography for assessing steno-occlusions in peripheral arterial disease. Ann Intern Med 2010;153(5):325–334. [DOI] [PubMed] [Google Scholar]
- 14.Lundberg C, Johansson L, Barbier CE, Lind L, Ahlström H, Hansen T. Total atherosclerotic burden by whole body magnetic resonance angiography predicts major adverse cardiovascular events. Atherosclerosis 2013;228(1):148–152. [DOI] [PubMed] [Google Scholar]
- 15.Bamberg F, Parhofer KG, Lochner E, et al. Diabetes mellitus: long-term prognostic value of whole-body MR imaging for the occurrence of cardiac and cerebrovascular events. Radiology 2013;269(3):730–737. [DOI] [PubMed] [Google Scholar]
- 16.Bertheau RC, Bamberg F, Lochner E, et al. Whole-body MR imaging including angiography: predicting recurrent events in diabetics. Eur Radiol 2016;26(5):1420–1430. [DOI] [PubMed] [Google Scholar]
- 17.Duce SL, Weir-McCall JR, Gandy SJ, et al. Cohort comparison study of cardiac disease and atherosclerotic burden in type 2 diabetic adults using whole body cardiovascular magnetic resonance imaging. Cardiovasc Diabetol 2015;14(1):122. [DOI] [PMC free article] [PubMed] [Google Scholar]
- 18.Hansen T, Ahlström H, Wikström J, Lind L, Johansson L. A total atherosclerotic score for whole-body MRA and its relation to traditional cardiovascular risk factors. Eur Radiol 2008;18(6):1174–1180. [DOI] [PubMed] [Google Scholar]
- 19.Woodward M, Brindle P, Tunstall-Pedoe H; SIGN group on risk estimation. Adding social deprivation and family history to cardiovascular risk assessment: the ASSIGN score from the Scottish Heart Health Extended Cohort (SHHEC). Heart 2007;93(2):172–176. [DOI] [PMC free article] [PubMed] [Google Scholar]
- 20.Gandy SJ, Lambert M, Belch JJ, et al. Technical assessment of whole body angiography and cardiac function within a single MRI examination. Clin Radiol 2015;70(6):595–603. [DOI] [PMC free article] [PubMed] [Google Scholar]
- 21.Gandy SJ, Lambert M, Belch J, et al. 3T MRI investigation of cardiac left ventricular structure and function in a UK population: the tayside screening for the prevention of cardiac events (TASCFORCE) study. J Magn Reson Imaging 2016;44(5):1186–1196. [DOI] [PMC free article] [PubMed] [Google Scholar]
- 22.Weir-McCall JR, Fitzgerald K, Papagiorcopulo CJ, et al. Prevalence of unrecognized myocardial infarction in a low-intermediate risk asymptomatic cohort and its relation to systemic atherosclerosis. Eur Heart J Cardiovasc Imaging 2017;18(6):657–662. [DOI] [PMC free article] [PubMed] [Google Scholar]
- 23.Weir-McCall JR, Yeap PM, Papagiorcopulo C, et al. Left ventricular noncompaction: anatomical phenotype or distinct cardiomyopathy? J Am Coll Cardiol 2016;68(20):2157–2165. [DOI] [PMC free article] [PubMed] [Google Scholar]
- 24.Bhatt DL, Eagle KA, Ohman EM, et al. Comparative determinants of 4-year cardiovascular event rates in stable outpatients at risk of or with atherothrombosis. JAMA 2010;304(12):1350–1357. [DOI] [PubMed] [Google Scholar]
- 25.Shea S, Lima J, Diez-Roux A, Jorgensen NW, McClelland RL. Socioeconomic status and poor health outcome at 10 years of follow-up in the Multi-Ethnic Study of Atherosclerosis. PLoS One 2016;11(11):e0165651. [DOI] [PMC free article] [PubMed] [Google Scholar]
- 26.Deans KA, Bezlyak V, Ford I, et al. Differences in atherosclerosis according to area level socioeconomic deprivation: cross sectional, population based study. BMJ 2009;339:b4170. [DOI] [PMC free article] [PubMed] [Google Scholar]
- 27.Liu RS, Mensah FK, Carlin J, et al. Socioeconomic position is associated with carotid intima-media thickness in mid-childhood: the Longitudinal Study of Australian Children. J Am Heart Assoc 2017;6(8):e005925. [DOI] [PMC free article] [PubMed] [Google Scholar]
- 28.Eikendal AL, Bots ML, Haaring C, et al. Reference values for cardiac and aortic magnetic resonance imaging in healthy, young Caucasian adults. PLoS One 2016;11(10):e0164480. [DOI] [PMC free article] [PubMed] [Google Scholar]
- 29.Lehrke S, Egenlauf B, Steen H, et al. Prediction of coronary artery disease by a systemic atherosclerosis score index derived from whole-body MR angiography. J Cardiovasc Magn Reson 2009;11(1):36. [DOI] [PMC free article] [PubMed] [Google Scholar]
- 30.Edelman RR, Giri S, Pursnani A, Botelho MP, Li W, Koktzoglou I. Breath-hold imaging of the coronary arteries using Quiescent-Interval Slice-Selective (QISS) magnetic resonance angiography: pilot study at 1.5 Tesla and 3 Tesla. J Cardiovasc Magn Reson 2015;17(1):101. [DOI] [PMC free article] [PubMed] [Google Scholar]
Associated Data
This section collects any data citations, data availability statements, or supplementary materials included in this article.