

Abstract
Hypoxia triggers profound modifications of cellular transcriptional programs. Upon reoxygenation, cells return to a normoxic gene expression pattern and mRNA produced during the hypoxic phase are degraded. TIS11 proteins control deadenylation and decay of transcripts containing AU-rich elements (AREs). We observed that the level of dTIS11 is decreased in hypoxic S2 Drosophila cells and returns to normal level upon reoxygenation. Bioinformatic analyses using the ARE-assessing algorithm AREScore show that the hypoxic S2 transcriptome is enriched in ARE-containing transcripts and that this trend is conserved in human myeloid cells. Moreover, an efficient down-regulation of Drosophila ARE-containing transcripts during hypoxia/normoxia transition requires dtis11 expression. Several of these genes encode proteins with metabolic functions. Here, we show that ImpL3 coding for Lactate Dehydrogenase in Drosophila, is regulated by ARE-mediated decay (AMD) with dTIS11 contributing to ImpL3 rapid down-regulation upon return to normal oxygen levels after hypoxia. More generally, we observed that dtis11 expression contributes to cell metabolic and proliferative recovery upon reoxygenation. Altogether, our data demonstrate that AMD plays an important role in the control of gene expression upon variation in oxygen concentration and contributes to optimal metabolic adaptation to oxygen variations.
Introduction
ARE-mediated decay (AMD) defines a mechanism leading to the rapid degradation of messenger RNAs (mRNA) due to the presence of AU-rich elements (AREs) in their 3′ untranslated regions (3′UTRs). Since their discovery as major regulatory elements controlling inflammation1–4, AREs have been found to play major roles in several fundamental biological processes such as growth, differentiation and apoptosis5. One common feature of ARE-containing genes is their transient expression profile, ARE enrichment determining the temporal profile of gene expression6. Although the question of which consensus sequence constitutes a functional ARE has been a long-debated topic7, analysis of mammalian transcript 3′UTRs based on rather restrictive consensus indicates that these elements are the most common cis-acting elements and are found in approximately 11% of the total gene number in human ENSEMBL database8.
AREs are bound by a large variety of RNA-binding proteins which affect negatively or positively the expression of their target ARE-containing mRNA (for reviews see: refs8,9). For example, proteins of the TIS11/TTP and AUF1 families most frequently stimulate mRNA rapid degradation10,11 while proteins of the Hu family act as mRNA stabilizers12. Other ARE-binding proteins (ARE-BPs) such as TIAR and TIA-1 inhibit mRNA translation13,14. Therefore, the outcome of ARE-mediated gene regulation is determined by the availability of ARE-BPs and their affinity for the ARE present in the mRNA 3′UTR15–17.
AMD emerged early in the evolution of eukaryotes as ARE are found in transcripts from fungi18. Moreover, the TIS11/TTP proteins which are composed by a CCCH tandem zinc finger common to all members are also highly conserved in eukaryotes (refs19,20 for review). While AMD controls the stability of a wide range of transcripts in mammals, it regulates different restricted sets of genes in unicellular organisms. In Saccharomyces cerevisiae, AMD mainly controls genes involved in iron metabolism. In contrast, AMD targets genes involved in cell-cell interactions in Schizosaccharomyces pombe and other unrelated transcripts in Candida albicans. These observations reveal that despite the conservation of AMD, species have evolved their specific set of targets to meet their specific physiological requirements18.
ARE are well represented regulatory motifs in invertebrates. A bioinformatic analysis of D. melanogaster genome predicts a widespread contribution of AREs to post-transcriptional regulation in this organism and indicates that these elements are highly conserved across Drosophila species21. Interestingly, a 3-fold enrichment of genes containing an ARE is found in Drosophila immune-induced genes, suggesting that AMD evolved early in evolution as an important regulatory mechanism of the immune response21. The functional role of ARE in Drosophila has been demonstrated in vitro and in vivo and degradation of ARE-containing mRNA is promoted by the binding of dTIS11, the sole member of the TIS11/TTP family in this organism21,22.
TIS11/TTP protein accumulation is tightly controlled by multiple regulatory mechanisms acting at the transcriptional, post-transcriptional and post-translational levels (see ref.23, for review). We recently described that Drosophila and mammalian TIS11/TTP proteins are short-lived due to rapid ubiquitin-independent degradation by the proteasome and that this mechanism is tightly associated to the intrinsically disordered N and C-terminal domains of the proteins24.
In metazoans, several conserved mechanisms allow cells to modulate their metabolism in response to a reduction in oxygen availability. Upon hypoxia, a first line of cellular responses involves a rapid reduction of ATP consumption. This relies on a strong inhibition of mRNA translation as protein synthesis is one of the most energy-consuming cellular processes. This initial adaptation phase to hypoxic conditions is usually described as “defensive” and is rapidly followed by a “rescue” phase where the gene expression program is largely remodeled in order to establish a prolonged tolerant state to hypoxia (reviewed in ref.25).
Knowing that TIS11/TTP proteins are short-lived factors, we hypothesized that the translational blockade observed in hypoxic cells would lead to a strong decrease in their cellular concentration and would in return influence the post-transcriptional regulation of gene expression upon variation of the oxygen in the cellular environment. Here, we tested this hypothesis by exploring the consequences of variations in oxygen concentration on dTIS11 protein levels and AMD in Drosophila S2 cells.
We observed that dTIS11 accumulation is highly sensitive to variations in oxygen concentration and contributes to gene expression reprogramming upon transition from a hypoxic to a reoxygenated environment. In particular, we demonstrated that TIS11 controls the level of lactate dehydrogenase (LDH) during reoxygenation and influences the metabolic adaptation of cells to oxygen variations.
Altogether, our data demonstrate that optimal metabolic adaptation to oxygen variations relies not only on regulation of gene transcription and enzyme activity but also on post-transcriptional mechanisms controlling mRNA stability such as AMD.
Results
Modulation of dTIS11 protein levels upon variations in oxygen concentration in Drosophila S2 cells
AMD is a major post-transcriptional mechanism regulating gene expression in eukaryotes and dTIS11 is an essential effector of AMD in Drosophila. Therefore, variations in dTIS11 levels are expected to result in major changes of the gene expression program. We have previously shown that proteins of the TIS11/TTP family are short-lived due to their rapid degradation by the proteasome24. Although phosphorylation protects these proteins from degradation, their intrinsic rapid turnover most probably contributes to the dynamics of AMD.
Oxygen is an essential component for aerobic organisms and variations in oxygen availability have a strong impact on cell metabolism and physiology. Severe oxygen reduction (hypoxia) induces a metabolic shift from cellular respiration towards anaerobic glycolysis and a marked reduction of energy consuming processes such as protein synthesis25,26. Accordingly, exposure of S2 cells to reduced oxygen concentration (1%) for 18 hours markedly down-regulates the association of mRNA to polysomes (Fig. S1), confirming a strong blockade of protein synthesis in S2 cells upon hypoxia27. We tested whether oxygen variations modified dTIS11 levels by incubating S2 cells for a prolonged time (18 h) at 1% oxygen followed by a reoxygenation phase at 21% oxygen (Fig. 1a). As shown in Fig. 1b, dTIS11 levels are strongly reduced by hypoxia but rapidly return to levels observed in normoxia upon reoxygenation while dtis11 mRNA accumulates at similar level in normoxic or hypoxic S2 cells (Fig. 1c). As previously described in normoxia24, we observed that dTIS11 protein has a short half-life in hypoxic S2 cells (t1/2 = 117 min.) (Fig. 1d). Therefore, the strong reduction of dTIS11 protein upon hypoxia is most likely due to rapid degradation combined with hypoxia-induced global arrest of protein synthesis.
Figure 1.

Influence of oxygen variations upon dTIS11 protein levels. (a) S2 cells were incubated at 21% (normoxia) or 1% O2 (hypoxia) for 18 hours then transferred back at 21% O2 for the indicated time. (b) Upper panel: Total protein extracts from S2 cells cultivated under indicated oxygen conditions were analyzed by Western Blot. Actin was used as endogenous control. Western Blot representative of >3 independent experiments. Lower panel: Quantification of 3 independent Western Blot. dTIS11/actin ratios were normalized on constitutive expression in normoxia. (c) Relative dTIS11 mRNA levels after increasing time in hypoxia. Total RNA was extracted and analyzed by qRT-PCR (n = 5) and normalized on the level of Rpl32. Geometric mean of fold change (FC) is shown. Error bar = C.I. 95%. Paired t-test on log2 FC. (d) dTIS11 and Actin were detected by western blot in cell extract from S2 cells incubated in 1% O2 for 18 h and treated with cycloheximide for the indicated time periods. dTIS11 half-life under these conditions was calculated based one the quantification of 3 independent experiments.
Altogether, these results reveal that dtis11 expression is strongly and dynamically regulated by oxygen concentration, thereby suggesting that dTIS11-dependent AMD may contribute to gene expression reprogramming upon variations in oxygen levels.
Transcriptome-wide analysis of hypoxia-induced genes containing ARE
Higher eukaryotes have developed coordinated mechanisms at both the transcriptional and post-transcriptional levels for optimal control of gene expression. Mechanisms governing the transcriptional shift upon oxygen deprivation have been well documented both in mammals and Drosophila28,29. By contrast, little is known on post-transcriptional controls contributing to cellular hypoxic response30. To evaluate the role of AMD in the control of gene expression in hypoxia, we performed a transcriptome-wide analysis of hypoxia-induced genes by RNA-sequencing (RNA-seq) of poly-A+ RNA of S2 control cells (see methods) incubated either at 21% or at 1% O2 for 18 hours.
As previously shown for Drosophila adult and larvae29,31, hypoxia treatment also induces an acute change of the transcription profile in Drosophila S2 cells. Differential analysis reveals that expression of 695 and 456 genes is respectively up- or down-regulated more than 1.5-fold in hypoxia as compared to normoxia (Fig. 2a, Sup. Tables S1 and S2). To identify transcripts likely containing ARE, we calculated the AREScores32 of all potential isoforms reported in the NCBI RefSeq mRNA database for the up- and down-regulated gene subsets. These scores were compared to the AREScore values obtained from two lists of respectively 2136 and 2175 transcripts randomly generated from the list of genes expressed in S2 cells. We observed a significant difference in the distribution of AREScore frequencies between hypoxia-upregulated transcripts and both groups of randomly selected transcripts (Fig. 2b, upper panel) (Kolmogorov-Smirnov. CTRL1 p = 3.78 × 10⁻¹⁰, CTRL2 p = 6.66 × 10⁻¹⁶) suggesting that hypoxia-induced mRNA are more likely to contain ARE in their 3′UTR. Such difference was not observed when comparing the population of hypoxia downregulated transcripts with S2 expressed random transcripts (Fig. 2b, lower panel) (Kolmogorov-Smirnov. CTRL1 p = 0.252, CTRL2 p = 0.012).
Figure 2.

Hypoxia induced-transcripts are enriched in ARE. Total RNA from CTRL S2 cells in normoxia and hypoxia was analyzed by RNAseq. Differential gene expression analysis between hypoxia and normoxia was performed with the EdgeR method on the Degust website. FC > 1.5, FDR < 0.01 (a) MA plot showing the log2 FC and average log expression of the transcripts. (b,c) The AREScore of the upregulated or downregulated transcripts with FC > 1.5 (S2 hypoxia) was determined using the AREScore algorithm. Two randomly generated lists of respectively 2136 and 2175 transcripts expressed in S2 cells (Randomized CTRL 1 and 2) were used as control. (b) The cumulative frequency of transcripts of upregulated (upper panels) or downregulated (lower panels) was plotted according to their AREScore. Kolmogorov-Smirnov test was performed to determine the difference between the distributions of upregulated transcripts. (c) % transcripts with AREScore <2 or ≥2 in S2 cells in hypoxia compared to randomized CTRL.Results of Χ2 test (with Bonferoni correction) are: Up hypoxia Vs Down hypoxia p = 4.79 × 10⁻¹⁶; Up hypoxia Vs Random1 p = 4.85 × 10⁻¹¹; Up hypoxia Vs Random 2 p = 9.04 × 10⁻⁹; Down hypoxia Vs Random1 p = 0.0305; Down hypoxia Vs Random2 p = 0.002; Random1 Vs Random p = 1). (d) AREScore analysis of genes up- and downregulated in hypoxia from publicly available data. Left panel: microarray analysis of RNA from human macrophages placed 24 h in hypoxia (NCBI Gene Expression Omnibus: GSE4630). Χ2 test: p-value = 0.009604 (upregulated transcripts); p-value = 0.5406 (downregulated transcripts). Middle panel: microarray analysis of RNA from human monocytes cultured 16 h in hypoxia (EMBL Array express archives: E-MEXP-445). Χ2 test: p-value = 0.02007 (upregulated transcripts); p-value = 0.2591 (downregulated transcripts). Right panel: RNAseq data from human monocytes enriched from PBMCs cultured for 48 h in hypoxia (European Nucleotide Archives PRJNA262464). Χ2 test: p-value = 1.591 × 10⁻⁵ (upregulated transcripts); p-value = 0.03494 (downregulated transcripts). A randomized control set of transcripts was generated from all the expressed genes for each experiment.
The AREScore algorithm assigns a minimal score of 1 when detecting the presence of a single AUUUA pentamer in a 3′UTR32. The score increases with the number of pentamers, if pentamers are located within a region of high AU content or if pentamers are close to each other. These parameters reflect the fact that, both in invertebrates and mammals functional ARE frequently occur as multiple copies of close or overlapping AUUUA pentamers while a single copy of this motif is not sufficient to induce mRNA degradation (refs7,8, and references therein). An AREScore of 2 could therefore be considered as the minimal score required for a functional ARE. We compared the frequencies of transcripts with AREScores ≥2 (ARE-mRNA) and transcripts with scores <2 among transcripts induced in hypoxic conditions as compared to randomized controls (Fig. 2c). X2-test analysis revealed a significant statistical difference between these groups (see fig. legend).
In mammals, AMD regulates the stability of a wide range of transcripts and is essential to control the inflammatory response (ref.33 for review). mRNA decay mediated by dTIS11 homolog Tristetraprolin (TTP) plays a central role in modulating gene expression in activated myeloid cells34–36. Interestingly, hypoxia is also a major modulator of myeloid cells functions in physiological and pathophysiological environments37,38.
To evaluate the conservation of ARE enrichment in hypoxia-induced transcripts of myeloid cells, we performed the same analysis on publicly available microarray or RNAseq datasets from human primary macrophages39 and monocytes40,41. For each dataset, we established the AREScore of expressed genes as described above. We calculated the differential in gene expression for cells cultivated in normoxic or hypoxic conditions and defined for each experiment, groups of genes upregulated or downregulated more than 1.5-fold in hypoxia as compared to normoxia (see methods). Finally, we compared the frequencies of transcripts with AREScores ≥2 and transcripts with scores <2 among transcripts upregulated or downregulated in hypoxia to a randomized group of transcripts. For each experiment, X2-test analysis revealed a significant statistical difference between groups for upregulated transcripts while for groups of downregulated transcripts, little or no ARE enrichment was found when compared to randomized controls (Fig. 2d). Taken together, these data indicate that ARE are significantly enriched in mRNA expressed during hypoxia in human monocytes and macrophages, thereby suggesting an evolutionary conserved role of ARE in the control of hypoxia-induced genes from invertebrates to mammals.
Hypoxic ARE-containing genes are downregulated upon reoxygenation in a dTIS11-dependent manner
The rise in dTIS11 level upon transition from a hypoxic to a reoxygenated environment in S2 cells (see Fig. 1b) suggests that ARE-containing mRNA accumulated during hypoxia could be efficiently degraded upon reoxygenation. To investigate this hypothesis, we generated CRISPR-Cas9 clonal S2 cell lines inactivated for the dtis11 or the yellow gene as control (CTRL)42. We first performed RNA sequencing on CTRL cells, cultivated in a hypoxic or reoxygenated environment. Detection of a negative fold change in gene expression in these conditions identifies genes with reduced transcription and/or increased mRNA degradation rate upon reoxygenation. This analysis identified 446 genes significantly downregulated upon reoxygenation (FDR < 0.05; FC < −1.5) (Fig. 3a). We selected from the RefSeq database the 1285 transcripts corresponding to these 446 genes and calculated their AREScores. We defined a group of 687 transcripts (from 251 genes) with AREScores ≥2 (Sup. Tables S3,S4). We compared the frequencies of transcripts with AREScores ≥ or <2 among transcripts repressed in reoxygenated conditions with two groups of randomly selected transcripts (Fig. 3b). X2-test analysis revealed a significant statistical difference between these groups (see fig. legend), suggesting that transcripts markedly repressed upon reoxygenation after hypoxia are more likely to contain ARE in their 3′ UTR. Gene Ontology (GO) term analysis showed that a majority of these ARE-containing mRNA repressed in reoxygenation are predicted to play a role in metabolic and cellular processes (Fig. 3c). Efficient downregulation of these mRNA in reoxygenation could therefore play a role in terminating the specific metabolic program established during hypoxia in metazoans43.
Figure 3.

Hypoxic ARE-containing genes are downregulated upon reoxygenation in a dTIS11-dependent manner. (a) MA-plot of differentially expressed genes in CTRL cells upon reoxygenation with False Discovery Rate (FDR) < 0.05 and abs(FC) > 1.5. (b) % transcripts with AREScore <2 or ≥2 in S2 cells upon reoxygenation (90 min.) compared to 2 lists of randomized selected transcripts cells (Randomized CTRL 1 and 2). Results of Χ2 test are: Down in reoxygenation. Vs Random1 p = 5.94 × 10⁻⁴; Down in reoxygenation Vs Random2 p = 7.99 × 10⁻³. (c) GO term (Biological Processes) analysis of genes downregulated in CTRL cells upon reoxygenation (90 min.) after hypoxia. (d) Western Blot analysis of dTIS11 in CTRL and dTIS11 KO cells generated by CRISPR-Cas9 (see methods). (e) Total RNA extracted from dTIS11 KO and CTRL cells in hypoxia (18 h) and 90 min after reoxygenation were analyzed by RNAseq. Differentially regulated genes in hypoxia (1% O2, 18 h) and upon reoxygenation (21% O2, 90 min.) were analyzed by the EdgeR method for CTRL and dTIS11 KO cells. The cumulative frequency of transcripts detected as downregulated during reoxygenation was plotted according to their FC between hypoxia and reoxygenated conditions for both CTRL and dTIS11 KO cells. Kolmogorov-Smirnov test was performed to determine the difference between the distributions. (f) The AREScore of genes down-regulated in CTRL cells upon return to normoxia (FDR < 0.05) was determined using the AREScore algorithm. Heat map of log2 FC of the 30 most differentially expressed genes with AREScore ≥ 2 in CTRL and dTIS11 KO upon reoxygenation. See Sup. Table S3 for FC values of the complete gene list.
To evaluate the effect of dTIS11 on the reoxygenation-induced repression of ARE-containing mRNA, we performed a RNAseq experiment on hypoxic and reoxygenated dTIS11 KO cells (Fig. 3d) and calculated the differential of gene expression between these two experimental conditions (Sup. Tables S3, S4). We further compared the repression FC for ARE-containing mRNA (AREScore ≥2) upon reoxygenation in CTRL and dTIS11 KO cells. We calculated the cumulative frequencies in FC for this gene set both in WT and dTIS11 KO cells and observed a significant difference in these distributions (Fig. 3e) (Kolmogorov-Smirnov. P < 2.2 × 10⁻¹⁶). The heatmap shown in Fig. 3f displays the 30 (AREScore ≥2) genes showing the greatest difference in repression fold in CTRL and dTIS11KO cells. Taken together, these data indicate that the repression of ARE-containing mRNA upon reoxygenation is more efficient in CTRL cells than in dTIS11 KO cells, highlighting the repressive role of dTIS11 on ARE-containing mRNA during reoxygenation. Moreover, the association of this group of transcripts to metabolism suggests that dTIS11 is an important regulator for metabolic adaptation upon oxygen variations in Drosophila.
ImpL3 mRNA stability is controlled by dTIS11-dependent AMD upon oxygen variations
Among ARE-containing mRNA induced by hypoxia (Sup. Table S1) and repressed upon reoxygenation in a dTIS11-dependent manner, we identified ImpL3 (Fig. 3f, Sup. Table S3). This gene encodes the Drosophila Lactate Dehydrogenase (LDH), an enzyme catalyzing the reduction of pyruvate into lactate coupled to the oxidation of NADH to NAD+. LDH plays a central role in the cellular adaptation to a hypoxic environment by contributing to the shift from oxidative to glycolytic metabolism (see ref.28 for recent review). However, the reduced yield of ATP production under glycolytic metabolism might have induced a selective pressure to favor an efficient and rapid downregulation of LDH gene expression upon return to normoxia after a hypoxic episode. We therefore investigated whether ImpL3 could be actively down-regulated by dTIS11 during a hypoxic/normoxic transition in S2 cells.
ImpL3 expression was analyzed upon oxygen variation in S2 cells. The production of lactate dehydrogenase is detectable after 24 h and reaches a steady state level after 48 hours in 1% O2 (not shown). We then measured the expression of ImpL3 upon re-oxygenation after 18 hours of hypoxia and observed that ImpL3 mRNA decreased to basal levels after a short time period (~180 min) (Fig. 4a). Analysis of ImpL3 mRNA half-life in hypoxia and upon reoxygenation revealed that ImpL3 mRNA is strongly destabilized upon return to normoxia as compared to hypoxia (Fig. 4b). These results indicate that ImpL3 expression is highly induced upon oxygen deprivation but is rapidly shut off by mRNA destabilization upon increasing oxygen concentrations.
Figure 4.

ImpL3 mRNA stability is regulated by oxygen variations through a TIS11 sensitive ARE (a) S2 cells were incubated at 1% O2 for up to 18 hours, then reoxygenated at 21% O2 up to 3 hours. ImpL3 mRNA was detected by Northern Blot (NB) and quantified by phosphorimager. ImpL3 mRNA level relative to Rpl32 was normalized on expression level measured at time = 0 after hypoxia for each biological replicate. Mean +/− SEM of 3 independent experiments. (b) ImpL3 mRNA stability in normoxia and hypoxia. S2 cells were placed at 1% O2 for 18 hours, then treated with actinomycin D (5 µg/ml) and placed at either 21% or 1% O2 for up to 180 min. Cells kept at 21% O2 were used as negative control for ImpL3 induction (Ctrl). Mean +/− SEM of 3 (hypoxia) or 2 (normoxia) independent experiments. (c) 3′UTR of ImpL3 mRNA. ARE are underligned. (d) Expression of FLuc- 3′UTR ImpL3 or FLuc-3′UTR ImpL3 ∆ARE reporter genes was induced in stably transfected S2 cells by CuSO4 (0.5 mM) for 3 hours. Cells were then treated with actinomycin D (5 µg/ml) for the indicated times. Total RNA was extracted and FLuc mRNA was detected by NB and quantified by phosphorimager. To determine reporter mRNA half-lives, FLuc mRNA level relative to Rpl32 was normalized to expression levels measured before actinomycin D addition. Mean ± SEM of 3 independent experiments. (e) FLuc reporter genes containing full-length or ARE-deleted ImpL3 3′UTR were transiently co-transfected with a control RLuc-V5 plasmid and either GFP-V5 or dTIS11-V5 expressing plasmids in CTRL and dTIS11 KO cells. V5-tagged Renilla, GFP and dTIS11 were detected in western blot with an anti-V5 antibody, actin was detected as in Fig. 3d. (f) Dual luciferase assay was performed on the corresponding cell lysates after 18 h CuSO4 (0.5 mM) treatment to induce expression. FLuc/RLuc ratios were determined for each condition. Mean ± SEM of 3 independent experiments. 2-way ANOVA and Bonferroni’s post-test: ns: p > 0.5, ***p < 0.001.
Analysis of ImpL3 sequence revealed the presence in its 3′UTR of several AUUUA pentamers in U-rich context (Fig. 4c). To test the functional role of these motifs as mRNA destabilizing elements, we generated two reporter genes in which the Firefly luciferase (FLuc) coding sequence was placed under the control of the metallothionein promoter and flanked by ImpL3 3′UTR containing or not ARE (see methods). These constructs were transfected in S2 cells and transcription of the reporter genes was induced by incubation of the cells with copper sulfate. The half-life of FLuc mRNA reporters was determined by northern blot, upon transcription inhibition by Actinomycin D. We observed that FLuc mRNA bearing wild-type ImpL3 3′UTR had a markedly shorter half-life as compared to FLuc containing ImpL3 3′UTR devoid of ARE (Fig. 4d). To test the implication of dTIS11 in ARE-dependent ImpL3 mRNA destabilization, the above mentioned FLuc reporter genes were co-transfected with plasmids expressing either GFP or dTIS11 and a Renilla luciferase control vector (RLuc) in CTRL and dTIS11 KO S2 cells (Fig. 4f). As shown in Fig. 4e, the FLuc/RLuc ratio is markedly reduced for the FLuc gene with the complete ImpL3 3′UTR (left panel) upon overexpression of dTIS11 as compared to GFP control and FLuc/RLuc ratio is increased in dTIS11 KO cells as compared to FLuc/Rluc ratio in CTRL cells. Moreover, overexpression of dTIS11 in dTIS11 KO cells rescues the mutant phenotype by restoring a marked downregulation of the FLuc reporter mRNA containing ImpL3 ARE. These effects are specific to the presence of the ARE in the reporter gene as FLuc/RLuc ratio for the FLuc reporter lacking ImpL3 ARE is similar upon overexpression of dTIS11 and GFP both in CTRL or dTIS11 KO cells (Fig. 4e, right panel). Altogether, these results demonstrate that the AU-rich motifs present in ImpL3 3′UTR are bona fide ARE promoting mRNA decay in a dTIS11-dependent manner in normal oxygen concentrations.
dTIS11 binds ImpL3 ARE and destabilizes ImpL3 mRNA upon return to normoxia
To test the capacity of dTIS11 to directly bind ImpL3 ARE, we performed electrophoretic mobility shift assays (EMSA) with a labeled RNA probe corresponding to ImpL3 ARE-enriched region (Fig. 5a). Incubation of ImpL3 probe with recombinant dTIS11 protein resulted in a band shift of the ImpL3 probe. This band shift was efficiently competed by increasing amounts of ImpL3 unlabeled RNA and but not by similar amounts of unlabeled RNA corresponding to a scrambled ImpL3 sequence (see methods). We further compared the binding of dTIS11 to different RNA probes by Isothermal Titration Calorimetry (ITC)44. As shown in Fig. 5b, the complex formed between dTIS11 and an RNA sequence corresponding to Impl3 ARE has a measured dissociation constant of Kd = 2.4 µM. In the same experimental conditions, dTIS11 binds to previously described targets TNF ARE45 and CecA1-ARE22 with Kd of 0.895 and 0.580 µM, respectively. No binding was detected to a scrambled sequence of the ImpL3-ARE.
Figure 5.

dTIS11 binds ImpL3 ARE. (a) 32P-labeled RNA probes of ImpL3 ARE (ImpL3) or scrambled ImpL3 sequence (Scr ImpL3) were transcribed in vitro and incubated with recombinant dTIS11 protein for EMSA. dTIS11-binding specificity was assessed by competition with increasing amounts of unlabeled ImpL3 ARE or scrambled ImpL3 RNA: 4-, −6, −10, −12, −20, 25-fold molar excess of ImpL3 ARE and 6-,10-, 20-fold molar excess of scrambled ImpL3. EMSA representative of 3 independent experiments. ImpL3*: 32P-labeled ImpL3 probe. (b) Binding of dTIS11 to different RNA fragments. From left to right: ITC titration of dTIS11 into TNF-ARE, CecA1-ARE, ImpL3-ARE and an RNA fragment with a scrambled sequence of the same length as ImpL3-ARE probe. All the titrations were done at 10 °C. (c) S2 cells were incubated in hypoxia (1% O2) for 18 h and returned to normoxia (21% O2) for 60 min. before lysis. IP was carried out with anti-dTIS11 monoclonal antibody or murine IgG1 as negative control. Precipitation of dTIS11 was evaluated by Western blot analysis (upper panel, full size image presented in Supplementary Figure S2). Total RNA was extracted from the immunoprecipitation pellet by the Trizol method and the levels of indicated transcripts were measured in triplicates by RT-qPCR. Results are shown as % Input. Mean ± SEM of 5 independent experiments.
To confirm the binding of dTIS11 to ImpL3 mRNA in vivo, S2 cells were cultivated in hypoxia for 24 h before reoxygenation for 60 min. Cell extract was immunoprecipitated using anti-dTIS11 antibody46 or control IgG (Fig. 5c, left panel). Pelleted RNA was purified, and mRNA quantification was performed by RT-qPCR. Similarly to CecA1 and Branchless, two bona fide dTIS11 mRNA targets, Impl3 mRNA was reproducibly enriched by immunoprecipitation with anti-dTIS11 antibody relatively to control IgG. The Dredd mRNA, which is devoid of ARE and expressed at similar levels in hypoxic and normoxic conditions (not shown), was not or only minimally enriched by dTIS11 immunoprecipitation in these conditions (Fig. 5c, right panel). Altogether, these results indicate that dTIS11 directly binds to ARE present in ImpL3 mRNA 3′UTR.
RNA sequencing data revealed that ImpL3 mRNA accumulation is increased upon dtis11 inactivation in S2 cells upon oxygen recovery (Fig. 3e). We analyzed ImpL3 mRNA accumulation in CTRL and dTIS11-deficient S2 cells upon reoxygenation after 18 h in hypoxia. As shown in Fig. 6b, depletion of dTIS11 markedly increases ImpL3 mRNA levels upon return of the cells to high oxygen concentrations. This increase of ImpL3 mRNA is due to its stabilization upon dTIS11 depletion as ImpL3 mRNA half-life is markedly increased upon dtis11 inactivation (Fig. 6a). Consequently, the increased accumulation of ImpL3 mRNA in dTIS11 KO cells leads to a prolonged accumulation of lactate dehydrogenase after return to normoxia (Fig. 6c). Altogether, these results demonstrate a direct role of dTIS11 in the down-regulation of ImpL3 gene expression upon return of cells to normoxia.
Figure 6.

dTIS11 destabilizes ImpL3 mRNA upon return to normoxia. (a,b) dTIS11 KO and CTRL cells were placed 18 h at 1% O2 before reoxygenation at 21% O2 for the indicated times. (a) dTIS11 KO and CTRL cells were treated with actinomycin D (5 µg/ml) for the indicated times prior to RNA extraction. For the half-life of ImpL3 mRNA, NB were quantified by phosphorimager and ImpL3 expression relative to Rpl32 was normalized to expression levels at time = 0 at 21% O2 after hypoxia. Mean +/− SEM of 3 independent experiments. (b) Total RNA was extracted and ImpL3 mRNA was detected by Northern blot. Rpl32 was used as endogenous control. NB representative of 3 independent experiments. (c) WB analysis of LDH and dTIS11 in dTIS11 KO and CTRL cells. Total protein extraction was performed at the indicated time points upon return to normoxia. Actin was measured as endogenous control. Different acquisition times were used for LDH and Actin antibody.
dTIS11 controls energy metabolism and cell proliferation upon reoxygenation after hypoxia
Prolonged accumulation of lactate dehydrogenase in dTIS11-deficient cells upon oxygen recovery led us to investigate whether dTIS11 inactivation would hamper resumption of oxidative phosphorylation and cell proliferation upon oxygen supply. To monitor oxidative phosphorylation, we evaluated the mitochondrial membrane potential by performing a kinetic analysis of JC-1 staining of CTRL and dTIS11 KO upon oxygen recovery (ref.47 and methods). As shown in Fig. 7a,b, JC-1 staining index steadily increased upon oxygen recovery in CTRL cells while it remained at basal levels in dTIS11 KO cells, thereby indicating that dTIS11 expression is necessary for the onset of oxidative phosphorylation upon oxygen supply.
Figure 7.

dTIS11 deficiency leads to impaired mitochondrial polarization and proliferation upon return to normoxia. dTIS11 KO and CTRL cells were placed at 1% O2 for 48 h then reoxygenated at 21% O2 for the indicated times. (a,b) Cells were collected at the indicated time points and incubated with JC-1 (2 µM) prior to analysis by flow cytometry. Mitochondrial depolarization is indicated by a decrease in the red/green ratio. (a) Representative FACS plots for green and red fluorescence for dTIS11 KO (grey, dotted line) and CTRL (black, full line) at 6 hours after return to normoxia. Mean fluorescence intensities (MFI) are indicated on the graph. Results are representative of 3 independent experiments. (b) JC-1 index was normalized to JC-1 index at 0 h return to normoxia for both cell lines. Mean +/− SEM of 3 independent experiments. 2-way ANOVA and Bonferroni’s post-test showed an overall difference between cell lines with p < 0.01 and a significant difference at 6 hours in particular. **: p < 0.01. (c,d) Cells were collected at the indicated time points and counted by flow cytometry using Polybeads. (c) Representative gating strategy showing the beads (upper left corner gate) and live cells (center gate), showing the similar size and granulosity of dTIS11 KO (lower plot) and CTRL (upper plot) cells before hypoxia. FACS was stopped after 500 beads. (d) Cells were counted at the indicated time points and normalized to the number of cells after 48 h hypoxia to yield the proliferation index for each cell line. Mean +/− SEM of 4 independent experiments. 2-way ANOVA and Bonferroni’s post-test showed an overall difference between cell lines with p < 0.05.
We also compared the proliferation capacity of CTRL and dTIS11-deficient S2 cells upon oxygen recovery by cell counting using beads-standardized flow cytometry (see methods). As shown in Fig. 7c,d, CTRL cells resumed proliferation more efficiently than dTIS11 KO cells, further revealing the importance of dTIS11 for optimal proliferative capacity of Drosophila cells upon return to normoxic conditions. In summary our data indicate that fluctuations in dTIS11 level observed in Drosophila S2 cells exposed to variations in oxygen concentrations contribute to the stabilization of ARE-containing mRNA during hypoxia and destabilization upon reoxygenation. This mechanism regulates the level of LDH during the transition from a hypoxic to a reoxygenated environment and favors the return to an oxidative phosphorylation-based metabolism (Fig. 8).
Figure 8.
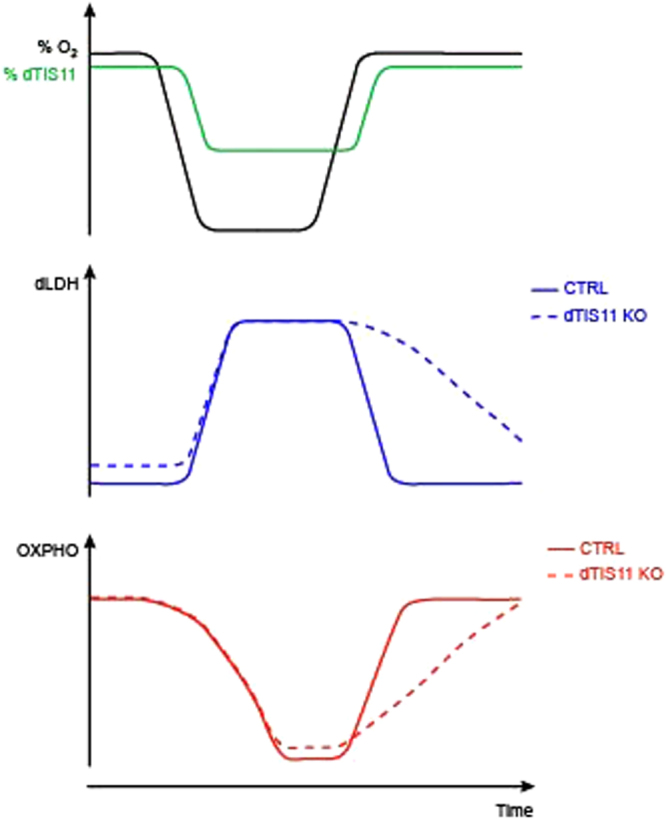
Model recapitulating dTIS11-dependent AMD post-transcriptional control upon oxygen variations.
Discussion
AMD is a major evolutionary conserved mechanism controlling gene expression at the post-transcriptional level. We and others have shown that the unique member of the TIS11 protein family acts as a master trans-acting factor of AMD in Drosophila21,22,32,45. In this study, we demonstrate that dTIS11 protein level greatly fluctuates upon oxygen variations in Drosophila S2 cells. Indeed, dTIS11 protein accumulation is strongly decreased upon oxygen deprivation, most probably as a consequence of general translational blockade combined to dTIS11 rapid turnover by the 20 S proteasome24. Reversibly, dTIS11 rapidly returns to basal levels upon return to ambient oxygen concentration.
Oxygen is central to the energy production of aerobic organisms and variation of oxygen supply induces strong modifications in the cell metabolic program43. The response of hypoxia tolerant systems to oxygen deprivation occurs in two phases that can be considered as defense and rescue processes. The first lines of defense against hypoxia include a balanced suppression of ATP demand and ATP supply pathways; this regulation stabilizes adenylate concentrations at new steady-state levels as ATP turnover rates greatly decline. Energy-consuming processes such as ion pumping and protein synthesis are down-regulated26. The latter process results from a rapid and massive polysome disassembly leading to translational arrest (ref.48 and Fig. S1). The secondary rescue mechanisms include adaptation of the metabolic program and rely on major changes in the gene expression program mainly under control of the HIF family of transcription factors28,43,49.
Here, we show that dTIS11 level is markedly decreased upon hypoxia and is followed by a rapid increase upon return to normoxia (Fig. 1b), suggesting that control of mRNA stability contributes to the molecular dynamics adapting gene expression to oxygen availability. This hypothesis is strengthened by a significant enrichment of ARE-containing mRNA in hypoxia-upregulated transcripts in Drosophila S2 cells as measured by the AREScore algorithm (Fig. 2b,c). We evaluated the efficiency of mRNA clearance during reoxygenation by comparing global mRNA levels in hypoxic and reoxygenated S2 cells (Fig. 3a). This analysis revealed an ARE enrichment for mRNA downregulated during reoxygenation (Fig. 3b). Moreover, efficient clearance of ARE-containing mRNA upon reoxygenation requires dTIS11 as demonstrated by differences in FC upon reoxygenation between dTIS11 KO and CTRL cells (Fig. 3e). Taken together, these observations support that dTIS11 could enhance the clearance of ARE-containing mRNA upon cells reoxygenation after a hypoxic episode. This mechanism could favor the disappearance from the cytoplasm of mRNA synthesized during hypoxia but which could be detrimental to the cell if maintained at a high level when oxygen concentration returns to a normoxic level. Gene ontology analysis performed on ARE-containing mRNA repressed upon reoxygenation shows a preponderance of transcripts involved in cellular metabolism (Fig. 3c), suggesting an important role of AMD in the tight and dynamic control of metabolism for cellular adaptation to oxygen variations. This hypothesis is further sustained by the identification of ImpL3, Cabut (cbt) and Hnf4 transcripts, all shown to control metabolism and glucose homeostasis50–52 in the list of 30 ARE-containing mRNA whose repression upon reoxygenation is most sensitive to dTIS11. This subgroup of transcripts also includes branchless (bnl) and cropped (crp) which play major roles in the morphogenesis of the tracheal (respiratory) system (Fig. 3e)53,54. Of note, bnl is transcriptionally controlled by HIF55 and was previously identified as a target of dTIS1121.
The analysis of publicly available transcriptomic data from human monocytes/macrophages under normoxia or hypoxia revealed an increase in ARE frequency in hypoxia-induced mRNA (Fig. 2d), suggesting that ARE enrichment in hypoxia-induced mRNA could be evolutionary conserved. The influence of post-transcriptional controls of gene expression under hypoxic conditions in mammals has been explored previously (reviewed in ref.30). In contrast, the contribution of post-transcriptional control of gene expression during reoxygenation after a hypoxic episode remains poorly explored. Hence, several observations suggest that the dynamic control of mRNA stability contributes to the return to a normoxic gene expression program after hypoxia. First, we previously described that TTP, a mammalian member of the TIS11 protein family dTIS11 is degraded by a similar mechanism as dTIS1124, suggesting that the level of TIS11/TTPs could also fluctuate in response to variations in oxygen concentration in mammalian cells similarly to dTIS11 in Drosophila S2 cells. In accordance with this hypothesis, TTP has been shown to downregulate several hypoxia-induced mRNA in mammalian cells and could therefore contribute to the termination of a hypoxic response56–58. Genes encoding mammalian TTP/TIS11 proteins are controlled by complex cell type-specific regulatory networks10,36,59. Therefore, the regulatory activity of these proteins during a hypoxic or reoxygenation episode could be influenced by several other parameters than their Drosophila dTIS11 counterpart. Moreover, the emergence of a larger ARE-BP repertoire in mammals most probably contributed to the complexification of AMD under hypoxic conditions5,7. It is worth noting that HuR, an ARE-BP with mRNA stabilizing effect, was observed to migrate from the nucleus to the cytoplasm in hypoxia and could therefore contribute to the stabilization of ARE-containing mRNA during hypoxia60,61.
The importance of AMD as a mechanism controlling gene expression during the transition from a hypoxic to reoxygenated environment is illustrated by our observation that ImpL3, which encodes the unique Lactate Dehydrogenase in Drosophila, contains ARE (AREScore = 4.1) and is highly regulated upon oxygen variations. We show that ImpL3 mRNA is rapidly degraded upon reoxygenation (Fig. 4a,b) in a dTIS11-dependent manner (Fig. 6a,b). Moreover, reporter and binding assays show that ImpL3 AU-rich elements act as bona fide ARE recruiting dTIS11 to promote mRNA degradation (Figs 4d,e and 5). Our results also reveal that dTIS11 deficiency leads to prolonged accumulation of ImpL3 mRNA and LDH upon reoxygenation (Fig. 6c) and impairs resumption of oxidative phosphorylation and cell proliferation upon oxygen supply (Fig. 7).
Expression of lactate dehydrogenase (LDH) is central for adaptation of the cellular metabolic program to an oxygen-depleted environment. The tetrameric LDH enzymes catalyze the conversion of pyruvate to lactate and regenerate NAD + co-factor previously reduced to NADH during the glycolytic ATP producing phase62. During Drosophila embryonic development, ImpL3 expression is upregulated upon oestrogen-related receptor signaling during mid-embryogenesis to sustain larval growth63. Moreover, in situ hybridization shows that ImpL3 transcripts are detected as early as stage 11 and are abundantly expressed in developing muscles from stage 13 to become predominantly muscular at stage 15. Loss of function of ImpL3 strongly impairs muscle development, suggesting that the conversion of pyruvate into lactate is an important metabolic pathway for this developmental program64. One can speculate that during development, increased levels of LDH contribute to aerobic glycolysis (Warburg effect) used by highly proliferating cells to sustain synthesis of macromolecules. It would be interesting to analyze the role of dTIS11 in the control of ImpL3 expression during development as dtis11 KO flies although viable, display a 24 h eclosion delay45.
Most importantly, in Drosophila, all tissues are exposed to ambient O2 pressures65 and cells have thus to adapt rapidly to ambient oxygen variations. Therefore, we might speculate that AMD-mediated regulation of ImpL3 expression contributes to the rapid return to oxidative phosphorylation in normoxia to ensure the return to maximal ATP yield to sustain the organism homeostasis66. Noteworthy, ARE are conserved in ImpL3 gene within Drosophila genus (data not shown) whose cells are all exposed to ambient oxygen pressures and have to rapidly adapt to oxygen variations.
In mammals, oxygen deprivation leads to the activation of ldha gene which encodes the A subunit of lactate dehydrogenase. Ldha gene is also up-regulated upon aerobic glycolysis and is a hallmark of cell proliferation and cancer progression (Warburg effect) (ref.67 for review). Transcription of Drosophila ImpL3 and mammalian ldha appears to be regulated by highly conserved mechanisms. Indeed, both are induced by HIF1 upon oxygen deprivation68 and are upregulated by c-myc69,70. Several reports indicate that rat LdhA mRNA is unstable due to the presence of destabilizing elements in its 3′UTR and that Ldha mRNA is stabilized upon protein kinase A activation by the binding of a protein complex to an AU-rich cis-acting element in Ldha 3′UTR71,72.Therefore, it appears that post-transcriptional regulation of lactate dehydrogenase has been conserved across evolution, although the cis- and trans-acting elements might have diverged from insects to mammals with the diversification of the post-transcriptional determinants across evolution.
In conclusion, our study identifies ARE-mediated decay as a new regulatory mechanism contributing to gene expression reprogramming during normoxia/hypoxia transitions and suggests that global inhibition of protein synthesis influences the expression of specific gene subsets containing ARE by modulating the level of the post-transcriptional regulator dTIS11.
Material and Methods
Reagents
Actinomycin D and DNA oligonucleotides were purchased from Sigma-Aldrich. Puromycin, hygromycin were purchased from InvivoGen. pAC-sgRNA-cas9 and pAC-y1sgRNA-cas9 plasmids were obtained from Addgene (# 49330 and 49331). Anti-LDH (H-160) antibody was purchased from Santa Cruz (sc-33781). Anti-actin (A2066) antibody was purchased from Sigma-Aldrich. dTIS11 monoclonal antibody was produced as previously described46.
Cell culture and transfection
Non-adherent Drosophila S2 cells were kindly provided by Neal Silverman (Boston, USA). Cells were maintained in Schneider’s Drosophila medium (Genaxxon bioscience) supplemented with 10% HyClone FBS (Perbio) at 24 °C. Hypoxia (1% O2) was achieved by displacing oxygen in a hypoxia chamber with purified N2 gas whose flow was controlled by an oxygen sensor (CoyLab).
Transfections were performed with Fugene HD according to the manufacturer’s instructions (Roche). Stable cell lines transfected with the dTIS11-targeting pspCas9-puro were generated by selecting transfected cells with puromycin (5 µg/ml) for at least 3 weeks.
Cells were further subcloned by limit dilution in 100 µl medium supplemented with S2 cell-conditioned medium (20%) and puromycin. Stable cell lines transfected with pMT constructs in combination with a hygromycin-resistant plasmid (1/20 ratio) were selected with hygromycin (200 µg/ml) for at least 3 weeks.
Cells stably transfected with the pAC-y1sgRNA-cas9 plasmid targeting the yellow locus were used as Cas9 control cells (CTRL). Western blot analysis indicates that the kinetic of dTIS11 degradation in response to hypoxic culture condition is similar in this yellow KO cell line as compared to wild-type S2 cells (not shown).
For pMT constructs, transcription driven by Metallothionein promoter was induced by treating the cells with CuSO4 (0.5 mM) for the indicated time. For mRNA half-life measurements, transcription was blocked by actinomycin D (5 µg/ml) and the cells were harvested at the indicated time points. The one-phase decay (nonlinear regression) of the ImPL3/Rpl32 mRNA ratio was used for calculation of ImpL3 mRNA half-life (Y0 = 100, plateau = 0) as Rpl32 mRNA level was previously reported to be marginally affected by actinomycin D treatment of S2 cells22.
Plasmids
The luciferase reporter genes were described previously22. Wild-type 3′UTR of ImpL3 gene was amplified by RT-PCR with the oligonucleotides FOR: 5′-aattggatccatcaaagcattcaactaacag-3′/REV: 5′-aattgtcgacaaacttaaaatttaaacagtttattc-3′. The DNA fragments were inserted between BamHI and SalI sites of the pMT-luciferase vector to generate a Luc-3′UTR IMPL3 reporter gene. A Luc-IMPL3ΔARE reporter gene was generated by cloning a mutated 3′UTR of ImpL3 obtained by a 2-step PCR-based mutagenic procedure. The sequence was verified by sequencing. GFP and dTIS11 expressing plasmids were described previously22,24.
The dTIS11 Cas9 plasmid was generated as described previously42 using the oligo nucleotides FOR: 5′-ttcggacgaggcccgcgcccaac-3′/REV: 5′-aacgttgggcgcgggcctcgtcc-3′.
Plasmids for in vitro transcription of wild-type ImpL3 and scrambled ImpL3 3′UTR were generated by hybridization of 2 primers followed by cloning into pBlueScript between the BamHI and EcoRI sites. The primers used were:
5′aattcgtttatttttagtccacctctcaatttatttattatttttatgaattagg3′/
5′gatccctaattcataaaaataataaataaattgagaggtggactaaaaataaacg3′ (ImpL3) and
5′aattcatttttttgtttttctgataattcgtgtatgtccttcacaaattgttaaatg3′
5′gatccatttaacaatttgtgaaggacatacacgaattatcagaaaaacaaaaaaatg3′ (scrambled ImpL3).
Polysome fractionation
Cell lysis, ultracentrifugation and gradient collection was performed as in73.
Genotyping of dTIS11 KO cell line
Cas9-mediated editing was verified by surveyor nuclease assay74 and genome mapping of the dTis11 locus in dTIS11 KO cells was performed by PCR. Adjacent loci (CK-alpha, SMR and Tomosyne) were amplified by PCR to verify the specificity of deletion. Primers used were:
dTis11: 5′aggagccaaagggttaagga3′/5′ccattcgatgccaaatatcc3′;
CK-alpha: 5′caagctgtaccgcattctgag3′/5′ctgcttcagcattgtccagtc3′;
SMR: 5′gcgataagaatgcagcaacagc3′/5′caccggaattcagttcgaatcg3′;
Tomosyne: 5′cgctccatggccagctggtgc3′/5′catggattgtacatggcatcgcccac3′.
Cells stably transfected with the pAC-y1sgRNA-cas9 plasmid (targeting the Yellow locus) were used as Cas9 control cells (CTRL).
RNA sequencing
Library preparation, RNA sequencing and bioinformatic analyses of differential Gene Expression were performed at the BRIGHTcore platform (Brussels, Belgium). RNA sequencing was performed on biological triplicates of CTRL and dTIS11 KO S2 cells grown in normoxia (21% O2), in hypoxia (1% O2 for 18 h) and upon recovery after hypoxia (90 min at 21% O2 after 18 h at 1% O2). 1 µg of each sample was used according to the standard sequencing protocol of Illumina (TrueSeq stranded mRNA). Quality control steps such as running the samples on a Bioanalyzer after library preparation were performed. The libraries were then sequenced on an Illumina HiSeq with a 150-base paired-end run. An average of 20 to 27 million reads was generated per sample. Read quality was determined using FastQC. The raw fasta files were deposited on the Sequence Read Archive (SRA) database under BioProject number: 373826.
Bioinformatic analyses
Sequence reads were aligned to the D. melanogaster genome (BDGP6) using STAR and counted using HTseq. Finally, differential gene expression analysis was done using the edgeR method on the Degust platform (http://vicbioinformatics.com/degust/index.html), with FDR < 0.05 and fold change cut-off as indicated. Further statistical analyses and graphs were done using R (see Sup. methods).
AREScore analysis was performed according to32, with standard parameters and scoring options (http://AREScore.dkfz.de/AREScore.pl). To establish random lists of transcripts, we first defined a list of all genes expressed in S2 cells (minimal reads count of 10 in RNAseq of either normoxic or hypoxic S2 cells). We further randomly selected two independent groups of 900 genes among the 8780 genes detected as expressed in S2 cells by running the “sample” function of the R language (see Sup. methods). For each group of 900 genes, we extracted all described transcript isoforms from the RefSeq database to generate two lists of respectively, 2136 and 2175 transcripts.
RNA analysis
Total RNA was purified using Tri reagent (MBI Fermentas) and analyzed by northern blot as in ref.22. RNA probe complementary to rp49 sequence (encoding ribosomal protein L32) was used to normalize RNA loading. Quantification of the radioactive signals was performed with a Phosphorimager (Molecular Dynamics). For qRT-PCR, cDNA was synthesized using the Prime ScriptTM RT Reagent Kit (Takara) according to manufacturer’s instructions. Quantitative PCR was performed on a StepOnePlus real-time PCR system (Applied Biosystems) using SYBR® Premix Ex TaqTM II (Takara) according to manufacturer’s instructions. Expression levels were normalized to Rpl32 (∆∆CT). The sequences of the primers used were: dTis11: 5′-acgaccaaaccatggaaact-3′/5′-ccttggcatatttgcgtttc-3′; ImpL3: 5′-caccgacatcctcaagaacat-3′/5′-gggattggacaccataagca-3′; Rpl32: 5′-gacgcttcaagggacagtatctg-3′/5′-aaacgcggttctg-catgag-3′. CecA1: 5′-gtcgctctcattctggccat-3′/5′gtcgctctcattctggccat-3′; Branchless: 5′-ccaaaccgcgggaatttctg- 3′/5′-cttcgtcttccccgctgata-3′.
RNA Immunoprecipitation Assay
RIP experiments were performed essentially as described in ref.75. Immunoprecipitation was performed with a monoclonal anti-dTIS11 antibody46 or control murine IgG1.
Purification of recombinant dTIS11 preparation and in vitro binding assays
dTIS11 protein was purified from BL21 DE3 bacteria transformed with a T7-dTIS11-6His plasmid. Briefly, bacteria were lysed after freezing for 20 min in lysis buffer (40 mM Hepes pH 7.8, 120 mM NaCl, 0.01% NP40, 0.1 mM EDTA, 5% glycerol, 10 mM 2-mercaptoethanol, 300 µg/ml lysozyme and Roche mini EDTA-free protease inhibitor cocktail) followed by sonication. After centrifugation, supernatant supplemented with imidazole (20 mM) was mixed with Ni-Sepharose beads. After washing, dTIS11-6His was eluted with elution buffer (300 mM imidazole, 40 mM Hepes pH 7.8, 500 mM NaCl, 0.01% NP40, 15% glycerol, 10 mM 2-mercaptoethanol, and protease inhibitors). The eluted fraction was desalted on PD-10 Columns and stored at −80 °C. Analysis of ImpL3 3′UTR-dTIS11 interaction by EMSA was performed as described in ref.76 with the following modifications. Purified recombinant His-tagged dTIS11 (1 µg) was incubated with labelled RNA probe (150.000 cpm) in Tris buffer (20 mM Tris pH 7.8, 3 mM MgCl2, 40 mM KCl, 2 mM DTT, 5% Glycerol) in the absence or the presence of increasing amounts of unlabeled RNA. Electrophoresis was performed on 5% polyacrylamide non-denaturing gels containing 6% glycerol at 7.5 mA for 16 hours at 4 °C.
ITC titrations were performed on an Affinity ITC (TA Instruments). All the measurements were done at 10 °C, titrating dTIS11 at a concentration of 108 μM into RNA fragments at a concentration of 10 μM to 15 μM. Prior to the measurements, dTIS11 and the different RNA fragments were dialyzed into the same buffer solution (20 mM MES pH 6.5, 300 mM NaCl, 5 µM ZnCl2, 0.5 mM DTT), degassed and equilibrated at the binding temperature. Sample concentrations were determined after dialysis or buffer exchange by absorbance measurements at 280 nm (dTIS11) or at 260 nm (RNA fragments). The ITC titrations were done at a stirring rate of 75 rpm with constant injection volumes of 2 μL of titrant into the cell (177 μL). All data were analyzed using NanoAnalyze and the final plots were generated with Origin. The RNA fragments used were: TNF ARE: 5′-cgauuuauuuauuuaga-3′ as previously described;46 CecA1: 5′-gauuauuuauaauuauuuauuuaaagaucuauuuauuc-3′; ImpL3 :5′-uguuuauuuuuaguccaccucucaauuuauuuauuauuuuuauga-3′; Scramble: 5′-auucuauuguuucuucuuauauauuguuauucuucacauaauguu-3′.
Western blotting and antibodies
Cell lysis and western blot were performed as described previously24. Gel images were acquired on a Licor Odyssey FC imaging system using supersignal West pico (Thermo Scientific) chemiluminescent substrate.
Dual Luciferase Assay
Dual-Luciferase® Reporter Assay from Promega was used after cell lysis according to manufacturer’s instruction.
Measurement of S2 cell proliferation
Proliferation of CTRL and dTIS11 KO cells in recovery after 48 h hypoxia was assessed by flow cytometry counting (FACS Canto II, BD) using Polybead® Polystyrene 6.0 micron Microspheres (Polysciences). Briefly, cells were counted with Trypan blue and plated at 1.5 × 10⁶ cells/ml. 50 µl from a 200 times dilution of the Polybeads was added to 500 µl of cell suspension before flow cytometry analysis (FSC vs SSC). Number of cells/500 counted beads was recorded for each time point. Cells were counted at plating, after 48 h of hypoxia and every 24 h in normoxia recovery (up to 72 h). Cell proliferation index in recovery corresponds to the ratio of cell number at indicated time point/cell number at 48 h of hypoxia.
JC-1 staining and detection
Mitochondrial polarization was assessed using MitoProbeTM JC-1 Assay Kit (Life Technologies) according to manufacturer’s instructions. CTRL and dTIS11 KO cells were plated at 1.5 × 10⁶ cells/ml and cultivated 48 h in hypoxia. At the indicated time points, cells were harvested and washed in PBS. Cells were then suspended in 200 µl PBS with JC-1 dye (2 µM) and left at 25 °C for 20 min in the dark for staining. Cells were analyzed by flow cytometry after a final wash in PBS. One tube of cells was briefly incubated with 10 µM FCCP (Sigma-Aldrich) prior to staining with JC-1, as depolarization control. FACS data were analyzed using FlowJo® V10. Mitochondrial depolarization is indicated by a decrease in the red/green fluorescence intensity ratio. JC-1 index was calculated as MFI Red/MFI Green for live single cells and normalized to the JC-1 index for cells at 48 h hypoxia.
Statistical analysis and graphs
Graphs were made using GraphPad Prism 5. The one-phase decay (nonlinear regression) was used for calculation of mRNA half-lifes (Y0 = 100, plateau = 0). Other statistical tests are as indicated in the text, p-values for multiple testing were corrected using Bonferroni’s correction method.
Electronic supplementary material
Acknowledgements
We thank Drs. Frédérick Libert, Anne Lefort and Marion Spittgerber for RNA sequencing and support in RNA-seq data analyses, Christine Decaestecker for advice in statistical data analysis. We are grateful to Milan Spasic and Georg Stoecklin for providing us with the AREScore program. This work was supported by a grant from the European Regional Development Fund (ERDF) and the Walloon Region, the Belgian Fonds de la Recherche Scientifique (FNRS, PDR 23605960), the Fonds Brachet, the Fonds Van Buuren, and the “Actions de Recherches Concertées” (AV.12/17). B. de Toeuf is supported by a PhD fellowship of the Belgian Fonds pour la Recherche en Industrie et Agriculture (FRIA) and M. Dragojevic is supported by the FNRS (PDR T.1038.15).
Author Contributions
B.d.T., R.S., L.V.N., V.K. and C.G. designed the study and experiments, B.d.T., R.S., A.N., M.D., D.J., N.D., A.G.-P. and V.K. performed experiments, B.d.T., L.V.N., V.K. and C.G. wrote the manuscript.
Competing Interests
The authors declare no competing interests.
Footnotes
Véronique Kruys and Cyril Gueydan contributed equally to this work.
Electronic supplementary material
Supplementary information accompanies this paper at 10.1038/s41598-018-23551-8.
Publisher's note: Springer Nature remains neutral with regard to jurisdictional claims in published maps and institutional affiliations.
References
- 1.Caput D, et al. Identification of a common nucleotide sequence in the 3′-untranslated region of mRNA molecules specifying inflammatory mediators. Proc Natl Acad Sci USA. 1986;83:1670–1674. doi: 10.1073/pnas.83.6.1670. [DOI] [PMC free article] [PubMed] [Google Scholar]
- 2.Shaw G, Kamen R. A conserved AU sequence from the 3′ untranslated region of GM-CSF mRNA mediates selective mRNA degradation. Cell. 1986;46:659–667. doi: 10.1016/0092-8674(86)90341-7. [DOI] [PubMed] [Google Scholar]
- 3.Kruys V, Marinx O, Shaw G, Deschamps J, Huez G. Translational blockade imposed by cytokine-derived UA-rich sequences. Science. 1989;245:852–855. doi: 10.1126/science.2672333. [DOI] [PubMed] [Google Scholar]
- 4.Kontoyiannis D, Pasparakis M, Pizarro TT, Cominelli F, Kollias G. Impaired on/off regulation of TNF biosynthesis in mice lacking TNF AU-rich elements: implications for joint and gut-associated immunopathologies. Immunity. 1999;10:387–398. doi: 10.1016/S1074-7613(00)80038-2. [DOI] [PubMed] [Google Scholar]
- 5.Khabar, K. S. A. Hallmarks of cancer and AU-rich elements. WIREs RNA8, 10.1002/wrna1368 (2017). [DOI] [PMC free article] [PubMed]
- 6.Hao S, Baltimore D. The stability of mRNA influences the temporal order of the induction of genes encoding inflammatory molecules. Nat Immunol. 2009;10:281–288. doi: 10.1038/ni.1699. [DOI] [PMC free article] [PubMed] [Google Scholar]
- 7.Barreau C, Paillard L, Osborne HB. AU-rich elements and associated factors: are there unifying principles? Nucleic Acids Res. 2006;29:7138–7150. doi: 10.1093/nar/gki1012. [DOI] [PMC free article] [PubMed] [Google Scholar]
- 8.Halees AS, El-Badrawi R, Khabar KS. ARED Organism: expansion of ARED reveals AU-rich element cluster variations between human and mouse. Nucleic Acids Res. 2008;36:D137–140. doi: 10.1093/nar/gkm959. [DOI] [PMC free article] [PubMed] [Google Scholar]
- 9.Kovarik P, Ebner F, Sedlyarov V. Posttranscriptional regulation of cytokine expression. Cytokine. 2017;89:21–26. doi: 10.1016/j.cyto.2015.11.007. [DOI] [PubMed] [Google Scholar]
- 10.Brooks SA, Blackshear PJ. Tristetraprolin (TTP): interactions with mRNA and proteins, and current thoughts on mechanisms of action. Biochim Biophys Acta. 2013;1829:666–679. doi: 10.1016/j.bbagrm.2013.02.003. [DOI] [PMC free article] [PubMed] [Google Scholar]
- 11.White EJF, Brewer G, Wilson GM. Post-transcriptional control of gene expression by AUF1: Mechanisms, physiological targets, and regulation. Biochim Biophys Acta. 2013;1829:680–688. doi: 10.1016/j.bbagrm.2012.12.002. [DOI] [PMC free article] [PubMed] [Google Scholar]
- 12.Simone LE, Keene JD. Mechanisms Coordinating ELAV/Hu mRNA Regulons. Curr Opin Genet Dev. 2013;23:35–43. doi: 10.1016/j.gde.2012.12.006. [DOI] [PMC free article] [PubMed] [Google Scholar]
- 13.Gueydan C, et al. Identification of TIAR as a Protein Binding to the Translational Regulatory AU-rich Element of Tumor Necrosis Factor α mRNA. J. Biol. Chem. 1999;274:2322–2326. doi: 10.1074/jbc.274.4.2322. [DOI] [PubMed] [Google Scholar]
- 14.Piecyk M, et al. TIA‐1 is a translational silencer that selectively regulates the expression of TNF‐α. EMBO J. 2000;19:4154–4163. doi: 10.1093/emboj/19.15.4154. [DOI] [PMC free article] [PubMed] [Google Scholar]
- 15.Lal A, et al. Concurrent versus individual binding of HuR and AUF1 to common labile target mRNAs. EMBO J. 2004;23:3092–3102. doi: 10.1038/sj.emboj.7600305. [DOI] [PMC free article] [PubMed] [Google Scholar]
- 16.Liao B, Hu Y, Brewer G. Competitive binding of AUF1 and TIAR to MYC mRNA controls its translation. Nat Struct Mol Biol. 2007;14:511–518. doi: 10.1038/nsmb1249. [DOI] [PubMed] [Google Scholar]
- 17.Tiedje C, et al. The p38/MK2-Driven Exchange between Tristetraprolin and HuR Regulates AU–Rich Element–Dependent Translation. PLoS Genet. 2012;8:e1002977. doi: 10.1371/journal.pgen.1002977. [DOI] [PMC free article] [PubMed] [Google Scholar]
- 18.Wells ML, et al. Post-transcriptional regulation of transcript abundance by a conserved member of the tristetraprolin family in Candida albicans. Mol Microbiol. 2015;95:1036–1053. doi: 10.1111/mmi.12913. [DOI] [PMC free article] [PubMed] [Google Scholar]
- 19.Blackshear PJ, Perera L. Phylogenetic Distribution and Evolution of the Linked RNA-Binding and NOT1-Binding Domains in the Tristetraprolin Family of Tandem CCCH Zinc Finger Proteins. Journal of Interferon & Cytokine Research. 2014;34:297–306. doi: 10.1089/jir.2013.0150. [DOI] [PMC free article] [PubMed] [Google Scholar]
- 20.Wells ML, Perera L, Blackshear PJ. An Ancient Family of RNA-Binding Proteins: Still Important! Trends Biochem Sci. 2016;42:285–296. doi: 10.1016/j.tibs.2016.12.003. [DOI] [PMC free article] [PubMed] [Google Scholar]
- 21.Cairrao F, Halees AS, Khabar KSA, Morello D, Vanzo N. AU-Rich Elements Regulate Drosophila Gene Expression. Mol Cell Biol. 2009;29:2636–2643. doi: 10.1128/MCB.01506-08. [DOI] [PMC free article] [PubMed] [Google Scholar]
- 22.Lauwers A, et al. Post-transcriptional Regulation of Genes Encoding Anti-microbial Peptides in Drosophila. J Biol Chem. 2009;284:8973–8983. doi: 10.1074/jbc.M806778200. [DOI] [PMC free article] [PubMed] [Google Scholar]
- 23.Ciais D, Cherradi N, Feige J-J. Multiple functions of tristetraprolin/TIS11 RNA-binding proteins in the regulation of mRNA biogenesis and degradation. Cell. Mol. Life Sci. 2013;70:2031–2044. doi: 10.1007/s00018-012-1150-y. [DOI] [PMC free article] [PubMed] [Google Scholar]
- 24.Ngoc LV, et al. Rapid Proteasomal Degradation of Posttranscriptional Regulators of the TIS11/Tristetraprolin Family Is Induced by an Intrinsically Unstructured Region Independently of Ubiquitination. Mol Cell Biol. 2014;34:4315–4328. doi: 10.1128/MCB.00643-14. [DOI] [PMC free article] [PubMed] [Google Scholar]
- 25.Wouters BG, et al. Control of the hypoxic response through regulation of mRNA translation. Semin Cell Dev Biol. 2005;16:487–501. doi: 10.1016/j.semcdb.2005.03.009. [DOI] [PubMed] [Google Scholar]
- 26.Hochachka PW, Buck LT, Doll CJ, Land SC. Unifying theory of hypoxia tolerance: molecular/metabolic defense and rescue mechanisms for surviving oxygen lack. Proc Natl Acad Sci USA. 1996;93:9493–9498. doi: 10.1073/pnas.93.18.9493. [DOI] [PMC free article] [PubMed] [Google Scholar]
- 27.Lee S-J, Feldman R, O’Farrell PH. An RNA interference screen identifies a novel regulator of target of rapamycin that mediates hypoxia suppression of translation in Drosophila S2 cells. Molecular biology of the cell. 2008;19:4051–4061. doi: 10.1091/mbc.E08-03-0265. [DOI] [PMC free article] [PubMed] [Google Scholar]
- 28.Semenza GL. Oxygen sensing, hypoxia-inducible factors, and disease pathophysiology. Annu Rev Pathol. 2014;9:47–71. doi: 10.1146/annurev-pathol-012513-104720. [DOI] [PubMed] [Google Scholar]
- 29.Li Y, et al. HIF- and Non-HIF-Regulated Hypoxic Responses Require the Estrogen-Related Receptor in Drosophila melanogaster. PLoS Genet. 2013;9:e1003230. doi: 10.1371/journal.pgen.1003230. [DOI] [PMC free article] [PubMed] [Google Scholar]
- 30.Gorospe M, Tominaga K, Wu X, Fähling M, Ivan M. Post-Transcriptional Control of the Hypoxic Response by RNA-Binding Proteins and MicroRNAs. Front Mol Neurosci. 2011;1:4–7. doi: 10.3389/fnmol.2011.00007. [DOI] [PMC free article] [PubMed] [Google Scholar]
- 31.Liu G, Roy J, Johnson EA. Identification and function of hypoxia-response genes in Drosophila melanogaster. Physiological Genomics. 2006;25:134–141. doi: 10.1152/physiolgenomics.00262.2005. [DOI] [PubMed] [Google Scholar]
- 32.Spasic M, et al. Genome-Wide Assessment of AU-Rich Elements by the AREScore Algorithm. PLoS Genet. 2012;8:e1002433. doi: 10.1371/journal.pgen.1002433. [DOI] [PMC free article] [PubMed] [Google Scholar]
- 33.Kafasla P, Skliris A, Kontoyiannis DL. Post-transcriptional coordination of immunological responses by RNA-binding proteins. Nat Immunol. 2014;15:492–502. doi: 10.1038/ni.2884. [DOI] [PubMed] [Google Scholar]
- 34.Qiu LQ, Stumpo DJ, Blackshear PJ. Myeloid-specific tristetraprolin deficiency in mice results in extreme lipopolysaccharide sensitivity in an otherwise minimal phenotype. J Immunol. 2012;188:5150–9. doi: 10.4049/jimmunol.1103700. [DOI] [PMC free article] [PubMed] [Google Scholar]
- 35.Emmons J, et al. Identification of TTP mRNA targets in human dendritic cells reveals TTP as a critical regulator of dendritic cell maturation. RNA. 2008;14:888–902. doi: 10.1261/rna.748408. [DOI] [PMC free article] [PubMed] [Google Scholar]
- 36.Tiedje C, et al. The RNA-binding protein TTP is a global post-transcriptional regulator of feedback control in inflammation. Nucleic Acids Res. 2016;44:7418–7440. doi: 10.1093/nar/gkw474. [DOI] [PMC free article] [PubMed] [Google Scholar]
- 37.Murdoch C, Lewis CE. Macrophage migration and gene expression in response to tumor hypoxia. Int J Cancer. 2005;117:701–708. doi: 10.1002/ijc.21422. [DOI] [PubMed] [Google Scholar]
- 38.Palazon A, Goldrath AW, Nizet V, Johnson RS. HIF transcription factors, inflammation, and immunity. Immunity. 2014;41:518–528. doi: 10.1016/j.immuni.2014.09.008. [DOI] [PMC free article] [PubMed] [Google Scholar]
- 39.Boström P, et al. Hypoxia converts human macrophages into triglyceride-loaded foam cells. Arterioscler Thromb Vasc Biol. 2006;26:1871–1876. doi: 10.1161/01.ATV.0000229665.78997.0b. [DOI] [PubMed] [Google Scholar]
- 40.Bosco MC, et al. Hypoxia modifies the transcriptome of primary human monocytes:modulation of novel immune-related genes and identification of CC-chemokine ligand 20 as a new hypoxia-inducible gene. J Immunol. 2006;177:1941–1955. doi: 10.4049/jimmunol.177.3.1941. [DOI] [PubMed] [Google Scholar]
- 41.Baysal BE. Hypoxia-inducible C-to-U coding RNA editing downregulates SDHB in monocytes. PeerJ. 2013;1:e152. doi: 10.7717/peerj.152. [DOI] [PMC free article] [PubMed] [Google Scholar]
- 42.Bassett A, Liu J-L. CRISPR/Cas9 mediated genome engineering in Drosophila. Methods. 2014;69:128–136. doi: 10.1016/j.ymeth.2014.02.019. [DOI] [PubMed] [Google Scholar]
- 43.Palmer BF, Clegg DJ. Oxygen sensing and metabolic homeostasis. Mol Cell Endocrinol. 2014;39:751–758. doi: 10.1016/j.mce.2014.08.001. [DOI] [PubMed] [Google Scholar]
- 44.Recht MI, Ryder SP, Williamson JR. Monitoring assembly of ribonucleoproteincomplexes by isothermal titration calorimetry. Methods Mol Biol. 2008;488:117–127. doi: 10.1007/978-1-60327-475-3_8. [DOI] [PMC free article] [PubMed] [Google Scholar]
- 45.Choi Y-J, et al. The Drosophila Tis11 Protein and Its Effects on mRNA Expression in Flies. J Biol Chem. 2014;289:35042–35060. doi: 10.1074/jbc.M114.593491. [DOI] [PMC free article] [PubMed] [Google Scholar]
- 46.Twyffels L, et al. A Masked PY-NLS in Drosophila TIS11 and Its Mammalian Homolog Tristetraprolin. PLoS One. 2013;8:e71686. doi: 10.1371/journal.pone.0071686. [DOI] [PMC free article] [PubMed] [Google Scholar]
- 47.Reers M, et al. Mitochondrial membrane potential monitored by JC-1 dye. Meth. Enzymol. 1995;260:406–417. doi: 10.1016/0076-6879(95)60154-6. [DOI] [PubMed] [Google Scholar]
- 48.Fähling M. Surviving hypoxia by modulation of mRNA translation rate. J CellMol Med. 2009;13:2770–2779. doi: 10.1111/j.1582-4934.2009.00875.x. [DOI] [PMC free article] [PubMed] [Google Scholar]
- 49.Cavadas MA, et al. REST is a hypoxia-responsive transcriptional repressor. Sci Rep. 2016;6:31355. doi: 10.1038/srep31355. [DOI] [PMC free article] [PubMed] [Google Scholar]
- 50.Abu-Shumays RL, Fristrom JW. IMP-L3, A 20-hydroxyecdysone-responsive gene encodes Drosophila lactate dehydrogenase: structural characterization and developmental studies. Dev Genet. 1997;20:11–22. doi: 10.1002/(SICI)1520-6408(1997)20:1<11::AID-DVG2>3.0.CO;2-C. [DOI] [PubMed] [Google Scholar]
- 51.Bartok O, et al. The transcription factor Cabut coordinates energy metabolism and the circadian clock in response to sugar sensing. EMBO J. 2015;34:1538–1553. doi: 10.15252/embj.201591385. [DOI] [PMC free article] [PubMed] [Google Scholar]
- 52.Barry, W. E. & Thummel, C. S. The Drosophila HNF4 nuclear receptor promotes glucose-stimulated insulin secretion and mitochondrial function in adults. Elife. 5, 5, e11183, 10.7554/eLife11183 (2016). [DOI] [PMC free article] [PubMed]
- 53.Sutherland D, Samakovlis C, Krasnow MA. Branchless encodes a Drosophila FGF homolog that controls tracheal cell migration and the pattern of branching. Cell. 1996;87:1091–101. doi: 10.1016/S0092-8674(00)81803-6. [DOI] [PubMed] [Google Scholar]
- 54.Wong MM, Liu MF, Chiu SK. Cropped, Drosophila transcription factor AP-4, controls tracheal terminal branching and cell growth. BMC Dev Biol. 2015;15:20. doi: 10.1186/s12861-015-0069-6. [DOI] [PMC free article] [PubMed] [Google Scholar]
- 55.Centanin L, et al. Cell autonomy of HIF effects in Drosophila: tracheal cells sense hypoxia and induce terminal branch sprouting. Dev Cell. 2008;14:547–58. doi: 10.1016/j.devcel.2008.01.020. [DOI] [PubMed] [Google Scholar]
- 56.Essafi-Benkhadir K, Onesto C, Stebe E, Moroni C, Pagès G. Tristetraprolin inhibits Ras-dependent tumor vascularization by inducing vascular endothelial growth factor mRNA degradation. Mol Biol Cell. 2007;18:4648–4658. doi: 10.1091/mbc.E07-06-0570. [DOI] [PMC free article] [PubMed] [Google Scholar]
- 57.Chamboredon S, et al. Hypoxia-inducible factor-1α mRNA: a new target for destabilization by tristetraprolin in endothelial cells. Mol Biol Cell. 2011;22:3366–3378. doi: 10.1091/mbc.E10-07-0617. [DOI] [PMC free article] [PubMed] [Google Scholar]
- 58.Fähling M, et al. Multilevel regulation of HIF-1 signaling by TTP. Mol Biol Cell. 2012;23:4129–41. doi: 10.1091/mbc.E11-11-0949. [DOI] [PMC free article] [PubMed] [Google Scholar]
- 59.Clark AR, Dean JL. The control of inflammation via the phosphorylation and dephosphorylation of tristetraprolin: a tale of two phosphatases. Biochem Soc Trans. 2016;44:1321–1337. doi: 10.1042/BST20160166. [DOI] [PMC free article] [PubMed] [Google Scholar]
- 60.Galbán S, et al. RNA-binding proteins HuR and PTB promote the translation of hypoxia-inducible factor 1alpha. Mol Cell Biol. 2008;28:93–107. doi: 10.1128/MCB.00973-07. [DOI] [PMC free article] [PubMed] [Google Scholar]
- 61.Blanco FF, et al. The mRNA-binding protein HuR promotes hypoxia-induced chemoresistance through posttranscriptional regulation of the proto-oncogene PIM1 in pancreatic cancer cells. Oncogene. 2016;35:2529–2541. doi: 10.1038/onc.2015.325. [DOI] [PMC free article] [PubMed] [Google Scholar]
- 62.Markert CL, Shaklee JB, Whitt GS. Evolution of a gene. Multiple genes for LDH isozymes provide a model of the evolution of gene structure, function and regulation. Science. 1975;189:102–114. doi: 10.1126/science.1138367. [DOI] [PubMed] [Google Scholar]
- 63.Tennessen JM, Baker KD, Lam G, Evans J, Thummel CS. The Drosophila estrogen-related receptor directs a metabolic switch that supports developmental growth. Cell Metab. 2011;13:139–148. doi: 10.1016/j.cmet.2011.01.005. [DOI] [PMC free article] [PubMed] [Google Scholar]
- 64.Tixier V, et al. Glycolysis supports embryonic muscle growth by promoting myoblast fusion. Proc Natl Acad Sci USA. 2013;110:18982–1887. doi: 10.1073/pnas.1301262110. [DOI] [PMC free article] [PubMed] [Google Scholar]
- 65.Lehmann FO, Schützner P. The respiratory basis of locomotion in Drosophila. J Insect Physiol. 2010;56:543–50. doi: 10.1016/j.jinsphys.2009.04.019. [DOI] [PubMed] [Google Scholar]
- 66.Pfeiffer T, Schuster S, Bonhoeffer S. Cooperation and competition in the evolution of ATP-producing pathways. Science. 2001;292:504–507. doi: 10.1126/science.1058079. [DOI] [PubMed] [Google Scholar]
- 67.Vander Heiden MG, Cantley LC, Thompson CB. Understanding the Warburg effect: the metabolic requirements of cell proliferation. Science. 2009;324:1029–1033. doi: 10.1126/science.1160809. [DOI] [PMC free article] [PubMed] [Google Scholar]
- 68.Zhou D, Haddad GG. Genetic analysis of hypoxia tolerance and susceptibility in Drosophila and humans. Annu Rev Genomics Hum Genet. 2013;14:25–43. doi: 10.1146/annurev-genom-091212-153439. [DOI] [PubMed] [Google Scholar]
- 69.de la Cova C, et al. Supercompetitor status of Drosophila Myc cells requires p53 as a fitness sensor to reprogram metabolism and promote viability. Cell Metab. 2014;19:470–483. doi: 10.1016/j.cmet.2014.01.012. [DOI] [PMC free article] [PubMed] [Google Scholar]
- 70.Shim H, et al. c-Myc transactivation of LDH-A: implications for tumor metabolism and growth. Proc Natl Acad Sci USA. 1997;94:6658–6663. doi: 10.1073/pnas.94.13.6658. [DOI] [PMC free article] [PubMed] [Google Scholar]
- 71.Jungmann RA, Huang D, Tian D. Regulation of LDH-A gene expression by transcriptional and posttranscriptional signal transduction mechanisms. J Exp Zool. 1998;282:188–195. doi: 10.1002/(SICI)1097-010X(199809/10)282:1/2<188::AID-JEZ21>3.0.CO;2-P. [DOI] [PubMed] [Google Scholar]
- 72.Jungmann RA, Kiryukhina O. Cyclic AMP and AKAP-mediated targeting of protein kinase A regulates lactate dehydrogenase subunit A mRNA stability. J Biol Chem. 2005;280:25170–25177. doi: 10.1074/jbc.M502514200. [DOI] [PubMed] [Google Scholar]
- 73.Vindry C, et al. dTIS11 Protein-dependent Polysomal Deadenylation Is the Key Step in AU-rich Element-mediated mRNA Decay in Drosophila Cells. J Biol Chem. 2012;287:35527–35538. doi: 10.1074/jbc.M112.356188. [DOI] [PMC free article] [PubMed] [Google Scholar]
- 74.Qiu P, et al. Mutation detection using Surveyor nuclease. BioTechniques. 2004;36:702–707. doi: 10.2144/04364PF01. [DOI] [PubMed] [Google Scholar]
- 75.Stoecklin G, et al. Genome-wide analysis identifies interleukin-10 mRNA as target of tristetraprolin. J Biol Chem. 2008;283:11689–11699. doi: 10.1074/jbc.M709657200. [DOI] [PMC free article] [PubMed] [Google Scholar]
- 76.Gueydan C, et al. Engagement of tumor necrosis factor mRNA by an endotoxin-inducible cytoplasmic protein. Mol Med. 1996;2:479–488. [PMC free article] [PubMed] [Google Scholar]
Associated Data
This section collects any data citations, data availability statements, or supplementary materials included in this article.