

Abstract
Despite considerable research on K‐Ras inhibitors, none had been established until now. We synthesized nuclease‐resistant synthetic miR‐143 (miR‐143#12), which strongly silenced K‐Ras, its effector signal molecules AKT and ERK, and the K‐Ras activator Sos1. We examined the anti‐proliferative effect of miR‐143#12 and the mechanism in human colon cancer DLD‐1 cell (G13D) and other cell types harboring K‐Ras mutations. Cell growth was markedly suppressed in a concentration‐dependent manner by miR‐143#12 (IC50: 1.32 nmol L−1) with a decrease in the K‐Ras mRNA level. Interestingly, this mRNA level was also downregulated by either a PI3K/AKT or MEK inhibitor, which indicates a positive circuit of K‐Ras mRNA expression. MiR‐143#12 silenced cytoplasmic K‐Ras mRNA expression and impaired the positive circuit by directly targeting AKT and ERK mRNA. Combination treatment with miR‐143#12 and a low‐dose EGFR inhibitor induced a synergistic inhibition of growth with a marked inactivation of both PI3K/AKT and MAPK/ERK signaling pathways. However, silencing K‐Ras by siR‐KRas instead of miR‐143#12 did not induce this synergism through the combined treatment with the EGFR inhibitor. Thus, miR‐143#12 perturbed the K‐Ras expression system and K‐Ras activation by silencing Sos1 and, resultantly, restored the efficacy of the EGFR inhibitors. The in vivo results also supported those of the in vitro experiments. The extremely potent miR‐143#12 enabled us to understand K‐Ras signaling networks and shut them down by combination treatment with this miRNA and EGFR inhibitor in K‐Ras‐driven colon cancer cell lines.
Keywords: epidermal growth factor receptor, K‐Ras, miR‐143, Ras inhibitor, Sos1
1. INTRODUCTION
The 3 classical mammalian ras genes, K‐ras, N‐ras and H‐ras, encode 21‐Kd proteins that are members of the guanine nucleotide‐binding protein superfamily.1, 2 The canonical properties of Ras are those of a small GTPase that normally cycles between a GTP‐bound active and a GDP‐bound inactive state.3, 4 This cycle is negatively regulated by GTPase‐activating proteins that stimulate the intrinsic GTPase activity and are positively regulated by guanine nucleotide exchange factors (GEF).5 Ras is normally present in the GDP‐bound inactive state, which can be changed to the activated state by extracellular stimuli such as the presence of mitogens, cytokines and growth factors.6 On activation, Ras exerts its functions through protein‐protein interactions with effectors, such as Raf kinase and PI3K, to promote cell growth and survival.7, 8
In 1982, mutant Ras genes were detected in human cancers, marking the first discovery of mutated genes in cancer patients.9 Indeed, Ras mutations are genetic events that have been detected in 30% of all human cancers, with the specific Ras isoform generally differing according to the cancer type.6 Mutations in K‐Ras account for approximately 85% of all Ras mutations, those in N‐Ras for approximately 15% and those in H‐Ras for less than 1%; these are single base missense mutations, mainly in codons 12, 13 or 61 of exons 2 and 3.5, 10, 11 In colon and rectal carcinomas, K‐Ras is also the predominantly mutated isoform, whereas N‐Ras mutations are infrequent, and H‐Ras mutations have not been detected.12 Cancer‐causing mutations impair the GTPase activity of Ras, causing Ras to accumulate in the GTP‐bound active state, which transmits strong downstream signals.6 The epidermal growth factor receptor (EGFR) is an important molecule involved in cancer biology and therapy.13 K‐Ras, which is an essential component of the EGFR signaling cascade, can activate downstream growth‐related signaling pathways Raf‐MAPK and PI3K/AKT.14 Both increased EGFR expression and elevated gene copy numbers are seen in colorectal cancers.15 For metastatic colorectal cancer patients that have not responded to chemotherapy, cetuximab, which is an IgG1 chimeric monoclonal antibody against EGFR, improves overall and progression‐free survival.16 Unfortunately, the effectiveness of cetuximab is currently limited to patients with wild‐type K‐Ras tumors.16 In patients with mutated K‐Ras tumors, there is no significant difference between those who were treated with cetuximab and those who received supportive care alone with respect to overall survival or progression‐free survival.16 So far, extensive efforts have been made to develop one or more small chemical compounds that could directly target and inhibit constitutively active K‐Ras.6, 17 However, direct pharmacological targeting of activated K‐Ras has been so unsuccessful for clinical use that Ras oncoproteins are considered to be “undruggable” cancer targets. Therefore, there is a need for the development of new strategies and technologies to attack mutated K‐Ras.
Recently, microRNA (miRNA), which is a small nucleic acid molecule, has begun to revolutionize the world of drug discovery.18, 19 Impairment of the intracellular levels of certain miRNA triggers the transmission of genetic information conductive to the development of disease.20, 21 We previously reported that tumor suppressor miR‐143 is downregulated in approximately 80% of human colorectal tumor samples from cancer and adenoma patients compared with its level in normal tissues.22 The basic concept of miRNA therapy is restoration of the normal condition by replacing downregulated miRNA in tumor cells.23, 24 For instance, MRX34, which is an miR‐34, was demonstrated to be somewhat effective in clinical trials on liver cancer patients.25 However, for clinical application, the problem of degradation by RNA nuclease must be solved; and more efficient modification of miRNA and their drug delivery system must be devised.26
In this present study, we synthesized mature miR‐143 (syn‐miR‐143) targeting K‐Ras mRNA,27 and others such as AKT and ERK mRNA.28, 29, 30 Among them, a chemically‐modified miR‐143 (miR‐143#12) induced growth inhibition of K‐Ras mutant colon cancer cell lines when tested at an extremely low concentration. In addition, miR‐143#12 effectively restored the anti‐cancer activity of cetuximab (anti‐EGFR antibody) against cancer cells by impairing of K‐Ras signaling networks. Presently, we found that miR‐143#12 inhibited the activation of K‐Ras by silencing Sos1, a Ras‐specific GEF, thus establishing a “positive circuit” for enhancement of K‐Ras mRNA expression by K‐Ras effector signaling, as disclosed by using this potent miR‐143#12. Our data indicated that the potent silencing of plural genes by RNase‐resistant miR‐143#12 is a reasonable strategy against mutant K‐Ras networks in K‐Ras‐driven cancers.
2. MATERIALS AND METHODS
2.1. Cell culture and cell viability
DLD‐1, SW48, HT29 and SW480 cells were purchased from the Japanese Collection Research Bioresources Cell Bank (Osaka, Japan). Cell line authentication was done by short tandem repeat (STR) analysis, which was performed by using primers of TH01, TPOX, vWA, amelogenin, CSF1PO, D16S539, D7S820, D13S317, D5S818 and D21S11 (GenePrint 10 System; Promega, Madison WI, USA). In addition, sequencing of the K‐Ras mutation in the hot regions was performed. These cell lines were used within 6 months of purchase and tested for mycoplasma contamination by using a MycoAlert Mycoplasma Detection Kit (LT07‐118, Lonza, Rockland, ME, USA). Cells of the human colon cancer cell lines were grown in RPMI‐1640 medium supplemented with 5% (v/v) heat‐inactivated FBS and 2 mmol L−1 l‐glutamine under an atmosphere of 95% air and 5% CO2 at 37°C. The number of viable cells was determined by performing the trypan blue dye‐exclusion test. The AKT inhibitor (AKT inhibitor IV) and MEK inhibitor (PD98059) were obtained from Merck Milipore (Darmstadt, Germany). In some experiments the cells were co‐incubated with DMSO or PBS alone as a control.
2.2. Assay for stability of miRNA in vitro
Am, #1 or #12 were incubated in FBS (Hyclone Laboratories, Logan, UT, USA) at 37°C for 0, 5, 10, 20, 30, 40 or 60 minutes. Then, total RNA was isolated; and real‐time reverse transcriptase PCR using TaqMan microRNA assay was performed to quantify the expression level of miR‐143, which was calculated using the ΔΔCt method.
2.3. Western blotting
Cells were homogenized in chilled lysis buffer comprising 10 mmol L−1 Tris‐HCl (pH 7.4), containing 1% NP‐40, 0.1% deoxycholic acid, 0.1% SDS, 150 mmol L−1 NaCl, 1 mmol L−1 EDTA and 1% Protease Inhibitor Cocktail (Sigma, Tokyo, Japan), and stood for 20 minutes on ice. After centrifugation at 11 300 g for 20 minutes at 4°C, the supernatants were collected as protein samples. Protein contents were measured with a DC Protein Assay Kit (Biorad, Hercules, CA, USA). Ten micrograms of lysate protein for western blotting was separated by SDS‐PAGE using a 7.5% or 10% polyacrylamide gel and electroblotted onto a PVDF membrane (Amersham Biosciences, Piscataway, NJ, USA). After blockage of nonspecific binding sites for 1 hour with 5% nonfat milk in PBS containing 0.1% Tween 20, the membrane was incubated overnight at 4°C with various primary antibodies raised against human proteins. The following antibodies were used in this study: anti‐Ras antibody, purchased from Abcam (Cambridge, MA, USA); anti‐Sos1, anti‐ERK5, anti‐phospho‐ERK1/2, anti‐ERK1/2, anti‐phospho‐AKT (Ser473), anti‐AKT, anti‐PARP‐1, anti‐EGFR and anti‐H‐Ras antibodies, obtained from Cell Signaling Technology (Santa Cruz, CA, USA); and anti‐ß‐actin antibody, purchased from Sigma. The membranes were then washed 3 times with PBS containing 0.1% Tween 20, incubated further with HRP‐conjugated sheep anti‐mouse or donkey anti‐rabbit IgG antibody (Cell Signaling Technology) at room temperature, and then washed 3 times with PBS containing 0.1% Tween 20. The immunoblots were visualized by use of an Enhanced Chemiluminescence Detection Kit (PerkinElmer, Waltham, MA, USA).
2.4. Cell transfection with miRNA or siRNA
DLD‐1, SW48, HT29 and SW480 cells were seeded into 6‐well plates at a concentration of 0.5 × 10⁵/1 mL/well on the day before the transfection. We used Pre‐miR‐143 (Applied Biosystems, Foster City, CA, USA), which has the same sequences as wild‐type miR‐143 (#1) and is generally available as a representative miR‐143 mimic. Transfection was achieved by using cationic liposomes, Lipofectamine RNAiMAX (Invitrogen, Carlsbad, CA, USA), according to the manufacturer's lipofection protocol. The sequences of the syn‐miR‐143 used in this study are shown in Figure 1A. The siRNA for K‐Ras (siR‐KRas: 2, 5 nmol L−1) and siRNA for Sos1 (siR‐Sos1: 2, 5 nmol L−1) was used for the transfection of the cells, which was achieved by using Lipofectamine RNAiMAX. The sequence of siRNA for K‐Ras was 5′‐UAUUGUCGGAUCUCCCUCACCAAUG‐3′ (siR‐KRas:ORF) and 5′‐AAUGCAUGACAACACUGGAUGACCG‐3′ (siR‐KRas:3′UTR), and that for Sos1 was 5′‐UAAACAGGCCUGUAGUACAGUGCCG‐3′ (siR‐Sos1:3′UTR). We used non‐specific control (NC) Duplex VII (57% GC content; Dharmacon Research, Lafayette, CO, USA) as a control. The effects manifested by the introduction of the mature miRNA or siRNA into the cells were assayed at 48 or 72 hours, respectively, after the transfection.
Figure 1.

Synthetic miR‐143 showed a marked growth inhibition in colon cancer DLD‐1 cells. A, Sequences of synthetic miR‐143 used in this study. F RNA, Fluoro‐RNA; Ome RNA, O‐Methyl RNA; PS, phosphorothioate. B, Remaining percentage of each miR‐143, Am, #1 and #12, remaining in the presence of FBS evaluated by performing RT‐qPCR. The 0‐min value of each miR‐143 is indicated as 100%. The mean value was taken for each time. C, DLD‐1 cells were transfected with control‐miR, Am, #1 or #12 for 72 h. The cell viability was estimated at 72 h after the transfection. The cell viability of the control is indicated as 100%. The IC50 values are indicated in the figure. D, Western blot analysis was performed to determine the levels of the ERK5, total Ras, ERK1/2 and AKT after transfection with each miR‐143 at 10 nmol L−1. β‐actin was used as an internal control. E, Expression levels of K‐Ras mRNA as relative ratios with respect to the GAPDH expression level. The expression level of mRNA was calculated using the ΔΔCt method. F, DLD‐1 cells were transfected with control‐miR, Am, #1 or #12 at 10 nmol L−1 for 72 h. The level of K‐Ras‐GTP was estimated by performing western blot analysis at 72 h after the transfection. The levels of GTP‐bound K‐Ras were quantified by densitometry scanning and normalized to the total levels of K‐Ras. *P < .05 vs control (Student's t test) in the figures
2.5. Quantitative RT‐PCR
Total RNA extracted from cells by TRIzol containing phenol/guanidium isothiocyanate (Invitrogen) was reverse‐transcribed to cDNA by using Super‐Script III Reverse Transcriptase (Invitrogen) according to the manufacturer's protocol. To examine the expression level of mature miR‐143 in detail, we performed TaqMan MicroRNA Assays (Applied Biosystems) using real‐time PCR.22 The threshold cycle (Ct) is defined as the fractional cycle number at which the fluorescence passes a fixed threshold. The expression level of the miRNA in each sample was measured and was normalized to RNU6B expression, which was used as an internal control. Calculation of the Ct value was done by using a second derivative maximum method, and relative quantification was done by the comparative Ct method. All reactions were run in triplicate. The PCR primer pairs for miR‐143 and U6 were obtained commercially from Applied Biosystems. For the detection of K‐Ras and Sos1 mRNA, semi‐quantitative RT‐PCR was performed by using the primer set of 5′‐CCTGCTCCATGCAGACTGTTA‐3′ (forward) and 5′‐TGGGGAGAGTGACCATGACT‐3′ (reverse) for K‐Ras and that of 5′‐CATTGGACCCCCTTCAGTATGTCTT‐3′ (forward) and 5′‐GGACACTCCTCCTATTTTGCTGA‐3′ (reverse) for Sos1.
2.6. K‐Ras‐GTP assay
DLD‐1 cells were seeded into 6‐well plates at a concentration of 0.5 × 10⁵/1 mL/well the day before transfection. The control‐miR, Am, #1, #12 or siR‐Sos1 were used for transfection of the cells by using Lipofectamine RNAiMAX (Invitrogen). After the transfection, K‐Ras‐GTP was measured by using a K‐Ras Activation Assay Kit (CELL BIOLABS). The supernatants were analyzed by immunoblotting with Anti‐K‐Ras Antibody (Proteintech).
2.7. Assay for luciferase activity
We constructed sensor vectors by joining the region with or without a possible binding site from the 3′UTR of human Sos1 (No.7182‐7538) with a luciferase reporter pMIR‐control vector (Ambion, Foster City, CA, USA) to examine the target sequence of miR‐143. To generate sensor vectors with 3 mutations in the binding site of the 3′UTR of human Sos1 (No. 7481‐7487) for miR‐143, we mutated seed regions from CATCTCA to CAGACCA (mt‐Sos1, PrimeSTAR Mutagenesis Basal Kit, TaKaRa). The sensor vector with these mutations was submitted to the Life Science Research Center, Gifu University for DNA sequencing. The cells were seeded in 96‐well plates at a concentration of 0.5 × 10⁵/100 μL/well the day before the transfection. The sensor vector (concentration: 0.5 μg/well) and #12 or nonspecific control‐miRNA (Dharmacon) were used for the co‐transfection of the cells by using Lipofectamine RNAiMAX (Invitrogen). Forty‐eight hours after the co‐transfection, luciferase activities were measured using a Dual‐Glo Luciferase Assay System (Promega, Madison, WI, USA) according to the manufacturer's protocol. Firefly luciferase activity was normalized to Renilla luciferase activity.
2.8. In vivo tumor model and administration of the syn‐miR‐143
BALB/cSlc‐nu/nu (nude) mice were obtained from Japan SLC (Hamamatsu, Japan). DLD‐1 (K‐RasG13D) cells were concentrated to 0.8 × 10⁶/100 μL and injected s.c. into the back of each mouse. The tumor volume was calculated using the following formula: 0.5236 L1 (L2)2, where L1 is the long axis and L2 is the short axis of the tumor. The evaluation of the tumors was performed after killing the mice at 19 days following transplantation of the tumor cells. For animal injection, miRNA were mixed with poly(ethylene glycol)‐poly(Ornithine) (a gift from Professor Kataoka) to obtain miRNA‐loaded polyionic copolymers (PIC) to deliver miRNA to the tumors.31 Tissue sections from the tumors were used for pathological evaluation, total protein extraction and total RNA extraction. Animal experimental protocols were approved by the Committee for Animal Research and Welfare of Gifu University.
2.9. Statistics
Differences were statistically evaluated by 1‐way ANOVA followed by the t test. A P‐value of less than .05 was considered to be statistically significant.
3. RESULTS
3.1. Growth inhibition by syn‐miR‐143 of K‐Ras mutant human colon cancer DLD‐1 (K‐RasG13D) cell line
To explore the use of miR‐143 as a possible K‐Ras inhibitor for K‐Ras mutant colon cancer cells, we designed and synthesized some miR‐143 having different structures of the double strand for acquiring nuclease resistance. The structures of 2 of these compounds are shown in Figure 1A. The miR‐143#1 (#1) has the same double‐strand RNA sequences as found in the wild‐type mature miR‐143. In contrast to #1, miR‐143#12 (#12) was chemically modified in its antisense strand. First, we examined the RNase resistance of syn‐miR‐143 compared with that of commercially available miR‐143 from Ambion (Am), which was used as a standard miR‐143 mimic in this study. As shown in Figure 1B, #12 was significantly stable, with almost 60% remaining after a 60‐minute exposure to FBS compared with the stability for Am and #1. This result indicated that #12 had acquired high resistance against RNA nuclease.
Next, we examined the growth inhibitory activity of syn‐miR‐143 at various concentrations against human colon cancer DLD‐1 cell line, as judged by use of the trypan blue dye‐exclusion test. The growth was significantly suppressed in a dose‐dependent manner by treatment with these syn‐miR‐143 (Figure 1C). The IC50 value of Am was over 60 nmol L−1, which was almost 50 times higher than that of #12 (IC50; 1.32 nmol L−1). Because the previous studies reported by us and other groups indicated that miR‐143 targets ERK5, K‐Ras, ERK1/2 and AKT mRNA,27, 28, 29, 30 we evaluated the effects of miR‐143 on these target genes by performing western blot analyses. As to Ras isoforms, DLD‐1 cells express K‐Ras as the major isoform and H‐Ras, moderately, at both mRNA and protein levels (Figure S1). #12 downregulated the expression of both K‐Ras and H‐Ras. Based on this finding, we consistently evaluated the total Ras protein level on the silenced K‐Ras and H‐Ras by miR‐143. The ectopic expression of syn‐miR‐143 decreased the protein expression levels of its target genes, as was the case with Am, in DLD‐1 cells (Figure 1D). MiR‐143 silenced not only total Ras, but also its effector signal molecules ERK1/2 and AKT. Importantly, syn‐miR‐143 extremely downregulated the level of K‐Ras mRNA at 10 nmol L−1 (Figure 1E). Furthermore, as demonstrated in Figure 1F, #1 and #12, but not Am, significantly decreased the level of active K‐Ras‐GTP at 72 hours. These results indicated that syn‐miR‐143 are potent growth suppressors at extremely low concentrations and possibly suppressed the expression and activation systems of K‐Ras in K‐Ras‐driven DLD‐1 colon cancer cells, which was not observed with Am.
3.2. K‐Ras effector signaling pathways enhanced the transcription of K‐Ras itself
It has been reported that silencing Ras by miR‐143 inhibits the growth of Ras mutant human cancer cell lines both in vitro and in vivo.32, 33 When we compared the effects of syn‐miR‐143 and siR‐KRas, the latter being considered to be equal to Ras inhibitors on the cell growth of K‐Ras mutant cells, we found, as shown in Figure 2A, that the expression level of K‐Ras was decreased by either of 2 different siRNA for K‐Ras, which bind to the ORF and 3′UTR regions of K‐Ras, respectively, at 5 nmol L−1. The growth was suppressed in a dose‐dependent manner by either siRNA (Figure 2B). Their IC50 values are shown in the figure. Based on these results, we used the siR‐KRas for the 3′UTR in subsequent experiments. To further disclose the mechanism of the downregulation of K‐Ras by syn‐miR‐143, we evaluated the effect of syn‐miR‐143 or siR‐KRas on the level of K‐Ras mRNA. We focused on the AKT and ERK1/2, which are effector signaling proteins of K‐Ras, because syn‐miR‐143 significantly decreased their expression levels. We examined the time‐dependent protein expression levels of total Ras, AKT and ERK1/2. The cells transfected with syn‐miR‐143 tended to show a decrease in the expression levels of Ras, AKT and ERK1/2 up to 72 hours, after which the levels were maintained at those reduced levels up to 96 hours (Figure 2C); however, this finding was not observed in the cells transfected with siR‐KRas at the same concentration (5 nmol L−1). In the case of siR‐KRas, the levels of Ras and its effector signaling proteins AKT and ERK were reversed from 48 to 96 hours (Figure S2). These results indicated that syn‐miR‐143 strongly inactivated the K‐Ras and its effector signaling pathways for a longer time compared with siR‐KRas. Therefore, we examined whether PI3K/AKT and/or MAPK/ERK1/2 signaling pathways induced the transcription of K‐Ras as a target gene by using AKT or MEK inhibitor. Both inhibitors showed growth suppression of DLD‐1 cells after a 24‐hour treatment (data not shown). The IC50 values of these inhibitors were 0.27 and 2.33 μmol L−1, respectively. When the cells were incubated for 24 hours with these inhibitors at nearly their IC50 values, the K‐Ras mRNA (Figure 2D,F) and protein (Figure 2E,G) expression levels were significantly decreased in a dose‐dependent manner. These findings were also observed in the case of SW480 cells (Figure S3). These results indicated that K‐Ras effector PI3K/AKT and MAPK/ERK1/2 signaling pathways also promoted the transcription of K‐Ras itself, thus indicating the establishment of a positive circuit directed for K‐Ras expression.
Figure 2.
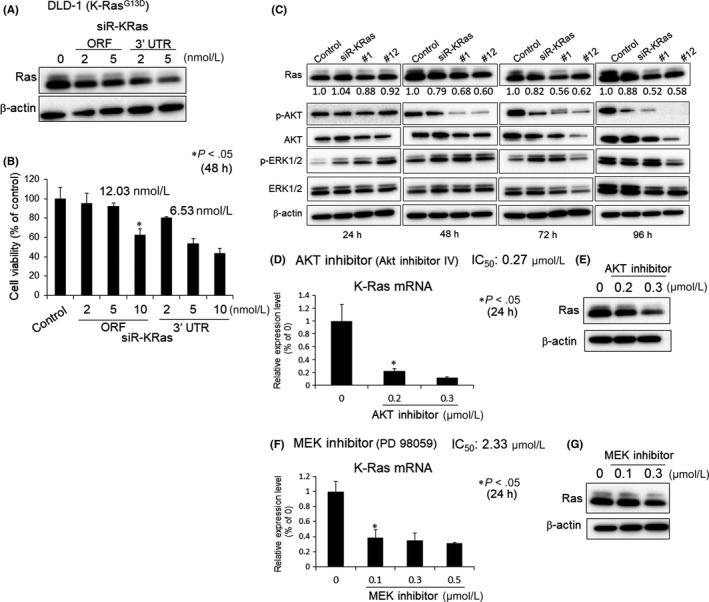
Contribution of K‐Ras to growth and its signaling networks. A, DLD‐1 cells were transfected with control‐miR or siR‐KRas (ORF or 3′UTR) for 48 h. Western blot analysis was performed to determine the level of total Ras. β‐actin was used as an internal control. B, DLD‐1 cells were transfected with control‐miR or siR‐KRas for 48 h. The cell viability was estimated at 48 h after the transfection. The cell viability of the control is indicated as 100%. C, DLD‐1 cells were transfected with control‐miR, siR‐KRas, #1 or #12 for 24, 48, 72 or 96 h. Western blot analysis was performed to determine the levels of Ras, p‐AKT, AKT, p‐ERK1/2 and ERK1/2. β‐actin was used as an internal control. The relative ratios of band density of Ras with respect to those of β‐actin were quantified by densitometry. Then, the comparative ratios of the controls as “1” are indicated in the Figure. D and F, DLD‐1 cells were treated with an AKT inhibitor (AKT inhibitor IV) or MEK inhibitor (PD98059) for 24 h. The K‐Ras mRNA level was estimated at 24 h after the treatment. The mRNA level of the control (0; DMSO alone) is indicated as 100%. E and G, Western blot analysis was performed to determine the levels of Ras at 24 h after the treatment. β‐actin was used as an internal control. *P < .05 vs control (Student's t test) in the figures
3.3. Syn‐miR‐143 silenced Sos1 by RNAi
In Figure 1F, we show that the ectopic expression of syn‐miR‐143 decreased the level of K‐Ras‐GTP. Among the Ras‐GEF families identified in mammals, the Sos proteins are the most widely expressed and functionally relevant for Ras activation by upstream cellular signals.34, 35 According to in silico prediction tools in TargetScan, Sos1 has an miR‐143 binding site in its 3′UTR. To validate Sos1 as a target gene of miR‐143, we performed a luciferase reporter assay. Co‐transfection with miR‐143#12 and the pMIR sensor vector that included the candidate target region bound by miR‐143#12 resulted in significant inhibition of the luciferase activity compared with the co‐transfection with control miRNA, but no inhibition was found in the case of the pMIR sensor vector that included the region without the binding site. Furthermore, mutations of the Sos1 3′UTR binding site significantly abolished the ability of miR‐143 to decrease the luciferase activity (Figure 3A). These results of this assay indicated that miR‐143#12 targets Sos1. Next, we evaluated the intracellular level of Sos1 at 48 and 72 hours after the transfection with Am or syn‐miR‐143 at 10 nmol L−1. We found that syn‐miR‐143, but not Am, significantly suppressed both mRNA and protein levels of Sos1 (Figure 3B,C). Although Am decreased the level of Sos1 mRNA, the protein level was almost unchanged compared with the cells transfected with control‐miRNA (Figure 3B,C). Furthermore, we examined the cancelling effect of miR‐143 inhibitor on the growth suppression after the transfection with syn‐miR‐143. The effect of growth suppression induced by syn‐miR‐143 was considerably cancelled in the cells co‐transfected with antagomirs at 10 nmol L−1 (Figure 3D). As shown in Figure 3E, the inhibitor at 10 nmol L−1 partially reversed the downregulation of ERK5 and Sos1 induced by syn‐miR‐143. These results altogether indicated that syn‐miR‐143 targeted Sos1. Next, we examined the effect of Sos1 on growth and the expression of total Ras. The cell viability at 48 hours was significantly suppressed by silencing of Sos1 using siRNA for Sos1 (siR‐Sos1; Figure 3F). However, the effector signaling of K‐Ras (ie PI3K/AKT and MAPK/ERK1/2) remained unchanged at 48 hours after the transfection (Figure 3G). The expression level of Ras was slightly decreased at both protein and mRNA levels (Figure 3G,H). The K‐Ras‐GTP levels were markedly suppressed at 10 nmol L−1 (Figure 3I). These results indicated that the knockdown of Sos1 induced growth suppression, but barely caused a decrease in the expression level of K‐Ras. Therefore, the knockdown of Sos1 did not affect the K‐Ras effector signaling directly (Figure 3G). It is possible that the EGF/EGFR/K‐Ras signaling may have functioned for residual K‐Ras activation. These results altogether indicated that syn‐miR‐143 decreased the expression level of K‐Ras through inactivating both PI3K/AKT and MAPK/ERK1/2 signal pathways, and also by silencing Sos1 (Figure4).
Figure 3.

Sos‐1 is a target of the miR‐143. A, Vector with the binding site for miR‐143 is indicated as Wild; and that without it as Mutant. DLD‐1 cells were transfected with Wild/control‐miR, Wild/#12, Mutant/control‐miR or Mutant/#12 for 48 h. The luciferase activities were estimated at 48 h after the transfection. The luciferase activity of the control (Cont; control‐miR) is indicated as 100%. B, DLD‐1 cells were transfected with control‐miR, A, #1 or #12 at 10 nmol L−1 for 48 h or 72 h. The expression level of Sos1 mRNA, given as relative ratios with respect to the GAPDH expression level, was evaluated by RT‐qPCR. The expression level of control (Cont; control‐miR alone) is indicated as “1.” C, Western blot analysis was performed to determine the level of Sos1. β‐actin was used as an internal control. D, DLD‐1 cells were co‐transfected with anti‐miR‐143 inhibitor and/or each miR for 72 h. The cell viability was estimated at 72 h after the transfection. The cell viability control (Control: control‐miR alone) is indicated as 100%. E, Western blot analysis was performed to determine the levels of ERK5 and Sos1. β‐actin was used as an internal control. The relative ratios of the band density of ERK5 and Sos1 with respect to those of β‐actin were quantified by densitometry. Then, the comparative ratios of the controls as “1” are indicated in the Figure. F, DLD‐1 cells were transfected with siR‐Sos1 (2, 5 nmol L−1) for 48 h. The cell viability was estimated at 48 h after the transfection. The cell viability control (0; control‐miR alone) is indicated as 100%. G, Western blot analysis was performed to determine the levels of Sos1, Ras, p‐AKT, AKT, p‐ERK1/2 and ERK1/2 proteins. β‐actin was used as an internal control. H, DLD‐1 cells were transfected with siR‐Sos1 (2, 5 nmol L−1) for 48 h. The expression level of K‐Ras mRNA as relative ratios with respect to the GAPDH expression level was evaluated by RT‐qPCR. The expression level of control (0; control‐miR alone) is indicated as “1.” I, DLD‐1 cells were transfected with control or siR‐Sos1 for 48 h. The level of K‐Ras‐GTP was estimated by performing western blot analysis at 48 h after the transfection. The levels of GTP‐bound K‐Ras were quantified by densitometry scanning and normalized to the total levels of K‐Ras. *P < .05 vs control (Student's t test) in the figures
Figure 4.

Schematic diagram indicating the “positive circuit” of K‐Ras mRNA expression and the target genes of miR‐143#12
3.4. Growth inhibition by combined treatment with syn‐miR‐143 and cetuximab
The effectiveness of cetuximab is now limited to patients with K‐Ras wild‐type tumors.16 Above we showed that the ectopic expression of syn‐miR‐143 significantly decreased the levels of K‐Ras mRNA and K‐Ras‐GTP through perturbation of the positive circuit and activation of K‐Ras‐GDP. However, the upstream signaling via EGFR was still functional even though the miR‐143 downregulated EGFR somewhat (Figure4 and Figure S4). Therefore, we evaluated whether syn‐miR‐143 could restore the effect of EGFR inhibitors such as anti‐EGFR antibody (cetuximab) or the low‐molecular‐weight lapatinib on the DLD‐1 cell line. First, we examined the growth inhibitory effect of cetuximab or lapatinib on DLD‐1 cells. The IC50 value for cetuximab is indicated in Figure 5A. For the combination treatment with syn‐miR‐143 and cetuximab, the concentration of cetuximab was fixed at 20 and 40 nmol L−1, which did not inhibit the growth of the cells and did not affect the expression levels of total Ras (Figure S5). The combination treatment with syn‐miR‐143 and low‐dose cetuximab resulted in synergistic growth suppression of DLD‐1 cells (Figure 5B). At the same time, we evaluated the downstream signaling of K‐Ras by performing western blot analysis. The expression levels of Ras, ERK1/2 and AKT proteins were markedly decreased (Figure 5C). In addition, we evaluated the restoration effect of cetuximab by using siR‐KRas alone in the same experiment. The combined treatment with siR‐KRas and cetuximab showed approximately 40% growth suppression; however, the synergistic effect was not significant (Figure 5D). The levels of p‐AKT and p‐ERK1/2 were clearly decreased by the combination treatment with siR‐KRas and cetuximab (Figure 5E). In contrast to syn‐miR‐143, the expression levels of AKT and ERK1/2 were unchanged, and also the downregulated K‐Ras by siR‐KRas alone was recovered even in combination treatment with cetuximab. It is likely that the increased expression levels of ERK1/2 and AKT may have stimulated the K‐Ras positive circuit, which would have been resistant to the EGFR inhibitor. Some compensatory pathways leading to a positive circuit could be at work when K‐Ras alone is silenced. Next, we evaluated the effect of syn‐miR‐143 on lapatinib, the first dual inhibitor of EGFR. The IC50 value of lapatinib is indicated in Figure 5F. The combination treatment with syn‐miR‐143 and lapatinib also exhibited a significant growth suppression of the cells (Figure 5G). These results indicated that syn‐miR‐143 restored the effect of anti‐EGFR antibody (cetuximab) and EGFR inhibitor (lapatinib) on K‐Ras mutant human colon cancer cell line through marked downregulation of K‐Ras networks.
Figure 5.

Ectopic expression of Syn‐miR‐143 recovered the efficacy of EGFR inhibitors. A, DLD‐1 cells were treated with cetuximab for 24 h. The cell viability was estimated at 24 h after the treatment. The cell viability of the control (0; PBS alone) is indicated as 100%. B, DLD‐1 cells were transfected with control‐miR, #1 or #12 for 48 h and then treated with cetuximab for 24 h. The cell viability was estimated at 72 h after the transfection. The cell viability of the control (Control; control‐miR and PBS) is indicated as 100%. C, Western blot analysis was performed to determine the levels of ERK5, Ras, p‐ERK1/2, ERK1/2, p‐AKT, AKT and PARP‐1 proteins. β‐actin was used as an internal control. D, DLD‐1 cells were transfected with siR‐KRas (3′UTR) for 48 h and then treated with cetuximab for 24 h. The cell viability was estimated at 72 h after the transfection. The cell viability of the control (Control; control‐miR and PBS) is indicated as 100%. E, Western blot analysis was performed to determine the levels of ERK5, Ras, p‐ERK1/2, ERK1/2, p‐AKT, AKT and PARP‐1 proteins. β‐actin was used as an internal control. F, DLD‐1 cells were treated with lapatinib for 24 h. The cell viability was estimated at 24 h after the treatment. The cell viability was estimated at 72 h after the transfection. The cell viability of the control (0; PBS alone) is indicated as 100%. G, DLD‐1 cells were transfected with control‐miR, #1 or #12 for 48 h and then treated with lapatinib for 24 h. The cell viability was estimated at 72 h after the transfection. The cell viability of the control (Control; control‐miR and PBS) is indicated as 100%. *P < .05 vs control (Student's t test) in the figures
3.5. Tumor suppressive effect of syn‐miR‐143 on in vivo experiment
To further validate the growth inhibitory effect of syn‐miR‐143, we performed an in vivo study in which control‐miR or syn‐miR‐143 were administrated systemically every 72 hours (750 μg/kg/administration) 4 times to nude mice that had been subcutaneously inoculated with DLD‐1 (K‐RasG13D) cells. At day 10 (before the 2nd administration), obvious suppression of tumor growth was already observed in the group injected with syn‐miR‐143 compared with the growth in the control miR‐injected group (Figure 6A). We evaluated the benefit of high‐dose (1125 μg/kg) #12 (#12 × 1.5 times). As a result, the group injected with it showed a more potent tumor suppressive effect than the low‐dose group; and this effect was prolonged up to the final day 19 (Figure 6A). The loss of body weight was not observed in any of the groups (Figure 6B). The expression levels of Ras and K‐Ras effector signaling molecules were extremely decreased in the samples from syn‐miR‐143‐treated tumors, estimated as protein expression by western blot analysis (Figure 6C).
Figure 6.

Tumor suppressive effect of the miR‐143 on DLD‐1 cell xenografted mice. A, DLD‐1 cells were injected subcutaneously into BALB/c nude mice. When the tumor volume had reached 100 mm3, 8 mice were sorted into each group. Then, control‐miR, #1 or #12 was intravenously injected every 72 h. At the second administration of #12, cetuximab was intraperitoneally injected every 72 h. The tumor volume was calculated as 0.5236 L1 (L2)2, where L1 is the long axis and L2 is the short axis of the tumor. C vs #1; P = .03 (day 16), C vs #12; P = .02 (day 13), C vs #12 + E; P = .05 (day 10), #12 vs #12 + E; P = .04 (day 19). The dose of 750 μg/kg/injection was given intravenously to each treated mouse every 3 d. The protocol is shown in the figure. B, The body weight was measured at every administration time. C, Western blot analysis was performed to determine the levels of K‐Ras, p‐AKT, AKT, p‐ERK1/2, ERK1/2 and ERK5 proteins in the xenografted tumor samples. β‐actin was used as an internal control. *P < .05 vs control (Student's t test)
Next, we re‐evaluated whether syn‐miR‐143 restored the effect of anti‐EGFR antibody (cetuximab) as seen in the in vitro study. The concentration of cetuximab was fixed at 10 mg/kg, which was equal to that used clinically.36 Importantly, the combination treatment with #12 and cetuximab resulted in a significant anti‐tumor effect compared with the administration of #12 alone, even after the final injection (Figure 6A). The expression levels of Ras and K‐Ras effector signaling molecules were also decreased in #12 + cetuximab‐treated tumors to a greater extent than those in the control‐miR‐treated tumors (Figure 6C). These results indicated that syn‐miR‐143 induced potent suppression of tumor growth and restored the effect of anti‐EGFR antibody (cetuximab) through the impairment of K‐Ras networks including the positive circuit, in vivo as well as in vitro.
3.6. Effects of syn‐miR‐143 in other K‐Ras mutation harboring colon cancer cell lines
To further validate the effects of syn‐miR‐143 on other K‐Ras wild and mutant human colon cancer cell lines, we performed the same experiments by using SW48 (K‐RasWild/B‐RafWild), HT29 (K‐RasWild/B‐Raf V600E) and SW480 (K‐RasG12V/B‐RafWild) cells. The growth of the colon cancer cell lines was significantly suppressed in a concentration‐dependent manner by treatment with syn‐miR‐143 (Figure 7A‐C). The IC50 values of syn‐miR‐143 are shown in each figure. #12 exhibited the lowest concentrations of IC50 among syn‐miR‐143 in all cell lines tested. Importantly, #12 was more effective (ie lower IC50) against the K‐Ras mutant cells (SW480) than against the wild‐type SW48 cells. Next, we evaluated whether syn‐miR‐143 could restore the effect of EGFR inhibitors such as cetuximab or low‐molecular lapatinib in these cell lines. The IC50 values of cetuximab and lapatinib for SW48 cells (K‐RasWild/B‐RafWild) were approximately 0.17 and 4.34 μmol L−1, respectively (Figure 7D,H). The sensitivity of SW48 cells to cetuximab was 10 times higher than that of HT29 cells (K‐RasWild/B‐RafV600E). The degrees of growth suppression effects were similar to those in clinical trials. Furthermore, the combination treatment with syn‐miR‐143 and cetuximab resulted in synergistic growth suppression (Figure 7E‐G). Similar results were also observed for the cells treated with syn‐miR‐143 and lapatinib (Figure 7I‐K). As a result, the synergistic effect was remarkably induced in K‐Ras and/or B‐Raf mutant colon cancer cell lines. These results indicated that the additional block of upstream stimulation mediated‐EGFR receptors by using EGFR inhibitors was necessary to shut down the K‐Ras networks completely in K‐Ras mutant colon cancer cells.
Figure 7.

Effects of the miR‐143 on other types of K‐Ras mutant cells. A, B and C, SW48, HT29 and SW480 cells, respectively, were transfected with control‐miR, #1 or #12 for 72 h. The cell viability was estimated at 72 h after the transfection. The cell viability of the control is indicated as 100%. D and H, SW48, HT29 and SW480 cells were treated with cetuximab or lapatinib for 24 h. The cell viability was estimated at 24 h after the treatment. The cell viability of the control (0; PBS alone) is indicated as 100%. E, F and G, SW48, HT29 and SW480 cells, respectively, were transfected with #1 or #12 for 48 h and then treated with cetuximab for 24 h. The cell viability was estimated at 72 h after the transfection. The cell viability of the control (Control; control‐miR and PBS) is indicated as 100%. I, J and K, SW48, HT29 and SW480 cells, respectively, were transfected with #1 or #12 for 48 h and then treated with lapatinib for 24 h. The cell viability was estimated at 72 h after the transfection. The cell viability of the control (Control; control‐miR and PBS) is indicated as 100%. *P < .05 vs control (Student's t test)
4. DISCUSSION
We demonstrated that chemically‐modified miR‐143#12 exhibited a potent suppressive effect on K‐Ras networks and that K‐Ras‐mutant colon cancer DLD‐1 cells established a positive circuit through the constitutive K‐Ras activation‐stimulation of effector signaling pathways, resulting in enhanced nuclear K‐Ras transcription, which was clearly disclosed by using the potent chemically‐modified miR‐143#12 (Figures 1 and 4). This positive circuit was also true in the case of another K‐Ras mutant, one in SW480 cells (Figure S3). The miR‐143#12 impaired K‐Ras networks including the positive circuit by silencing the key molecules of the networks. The miR‐143#12 was chosen in view of its having the greatest growth inhibitory activity and RNase resistance among more than 20 chemically‐modified miR‐143. In the current study, we newly identified the K‐Ras activator Sos1 as a target gene of miR‐143#12. Mir‐143#12 also impaired the K‐Ras/Sos1 relationship. In addition, our results suggested that inhibitors of K‐Ras may not suppress the positive circuit completely, because the compensatory networks to activate K‐Ras effector pathways could be induced when K‐Ras alone was silenced.
Furthermore, our data indicated that the upstream signaling pathway to K‐Ras via EGFR was still functional for K‐Ras expression, because of the synergistic effects on growth suppression and protein expression profiles by the combination treatment with miR‐143#12 and EGFR inhibitor in vitro and in vivo. In this case, the concentrations of EGFR inhibitor were extremely low, because miR‐143#12 impaired the K‐Ras signaling networks efficiently and moderately silenced the EGFR (Figure S4). Both in vivo and in vitro data revealed that the higher dose of miR‐143#12 exerted the higher anti‐tumor activity. These findings indicated that all signaling pathways into K‐Ras, which increase the K‐Ras mRNA level and K‐Ras activation by Sos1, should be suppressed and that the effect of EGFR inhibitors could be recovered only by the combination treatment with miR‐143#12, not siR‐KRas. Thus, the potent miR‐143#12 could perturb the K‐Ras expression networks by silencing EGFR, AKT, ERK and Sos1, as well as K‐Ras, for which silencing could be accomplished only by miR‐143#12. MiR‐143#12 enabled us to better understand the K‐Ras signaling networks and to show the possibility of development of an RNA medicine for K‐Ras‐driven cancers. We also showed that miR‐143#12 exhibited a potent anti‐proliferative activity toward other K‐Ras mutant colon cancer cells. K‐Ras mutant cells were more sensitive to miR‐143#12 than the cancer cells with wild‐type miR‐143, indicating the dependency on K‐Ras mutations as a driver gene. Even though the mutations of PI3K and Raf, which are upstream signaling molecules of Akt and ERK, respectively, exist, miR‐143#12 can affect the Ras networks. An earlier study of ours showed that miR‐143 downregulates c‐myc through directly silencing ERK and AKT,28, 29, 30 whose signaling pathways increase the levels of c‐myc mRNA.37 C‐myc is downregulated by the ectopic expression of the synthetic miR‐143. C‐myc is positively associated with maintenance of the Warburg effect through overexpression of PKM splicer PTBP1,38, 39 which enables the PKM gene to promote the expression of PKM2 rather than that of PKM1. This axis is crucial to glycolysis‐dominant energy metabolism, referred to as the “Warburg effect.” In addition, miR‐143#12 targets the mRNA of hexokinase‐2 (HK2),40 a glycolysis‐associated gene and that of the Bcl‐2 gene.41 It is suggested that miR‐143#12 may impair the Warburg effect to block the escape from apoptosis. Thus, the data suggest that the ectopic expression of miR‐143#12 induces apoptosis through the decreased expression of bcl‐2 and c‐myc, which partly controls cell death and cancer‐specific energy metabolism. MiR‐143 is also known to silence the upstream activator of metastasis‐related genes such as MMP, CD44 and PKC.42 So far, many medicines targeting molecules associated with Ras networks have been developed; however, the outcomes have not been favorable, especially in Ras‐driven cancer cells. Our data may account for the reason.
MiRNA is a fine‐tuner for modulating gene expression at the translational step. However, our data clearly indicated that the fully chemically‐modified miR‐143 could systematically attack the plural important genes of the K‐Ras functional networks to induce profound growth inhibition. MiR‐143#12 silenced the expressions of such genes as Sos1, AKT and ERK, as well as K‐Ras, whose silencing was not accomplished by the standard Ambion miR‐143 or by conventional molecule‐targeted agents. It will be necessary to clarify in more detail the machinery of K‐Ras networks in future experiments. MiR‐143#12 will be useful for such clarification. Furthermore, a well‐modified drug delivery system will be required to distribute miR‐143#12 into tumors as an RNA medicine against Ras‐driven cancers.
CONFLICT OF INTEREST
The authors have no conflict of interest to declare.
Supporting information
ACKNOWLEDGMENTS
We thank Professor Kataoka (The University of Tokyo) and Professor Nishiyama (Tokyo Institute of Technology) for giving us the polyionic copolymers. This work was performed with the support of SHIONOGI.
Akao Y, Kumazaki M, Shinohara H, et al. Impairment of K‐Ras signaling networks and increased efficacy of epidermal growth factor receptor inhibitors by a novel synthetic miR‐143. Cancer Sci. 2018;109:1455–1467. https://doi.org/10.1111/cas.13559
Funding information
Project for Cancer Research and Therapeutic Evolution, Japan Agency for Medical Research and Development.
REFERENCES
- 1. Tetlow AL, Tamanoi F. The Ras superfamily G‐proteins. Enzymes. 2013;33:1‐14. [DOI] [PubMed] [Google Scholar]
- 2. Pylayeva‐Gupta Y, Grabocka E, Bar‐Sagi D. RAS oncogenes: weaving a tumorigenic web. Nat Rev Cancer. 2011;11:761‐774. [DOI] [PMC free article] [PubMed] [Google Scholar]
- 3. Burns MC, Sun Q, Daniels RN, et al. Approach for targeting Ras with small molecules that activate SOS‐mediated nucleotide exchange. Proc Nat Acad Sci USA. 2014;111:3401‐3406. [DOI] [PMC free article] [PubMed] [Google Scholar]
- 4. Campbell SL, Khosravi‐Far R, Rossman KL, Clark GJ, Der CJ. Increasing complexity of Ras signaling. Oncogene. 1998;17:1395‐1413. [DOI] [PubMed] [Google Scholar]
- 5. Prior IA, Lewis PD, Mattos C. A comprehensive survey of Ras mutations in cancer. Cancer Res. 2012;72:2457‐2467. [DOI] [PMC free article] [PubMed] [Google Scholar]
- 6. Cox AD, Fesik SW, Kimmelman AC, Luo J, Der CJ. Drugging the undruggable RAS: mission possible? Nat Rev Drug Discov. 2014;13:828‐851. [DOI] [PMC free article] [PubMed] [Google Scholar]
- 7. Marshall CJ. Cell signalling. Raf gets it together. Nature. 1996;383:127‐128. [DOI] [PubMed] [Google Scholar]
- 8. McKay MM, Morrison DK. Integrating signals from RTKs to ERK/MAPK. Oncogene. 2007;26:3113‐3121. [DOI] [PubMed] [Google Scholar]
- 9. Cox AD, Der CJ. Ras history: the saga continues. Small GTPases. 2010;1:2‐27. [DOI] [PMC free article] [PubMed] [Google Scholar]
- 10. Irahara N, Baba Y, Nosho K, et al. NRAS mutations are rare in colorectal cancer. Diagn Mol Pathol. 2010;19:157‐163. [DOI] [PMC free article] [PubMed] [Google Scholar]
- 11. Downward J. Targeting RAS signalling pathways in cancer therapy. Nat Rev Cancer. 2003;3:11‐22. [DOI] [PubMed] [Google Scholar]
- 12. Vaughn CP, Zobell SD, Furtado LV, Baker CL, Samowitz WS. Frequency of KRAS, BRAF, and NRAS mutations in colorectal cancer. Genes Chromosom Cancer. 2011;50:307‐312. [DOI] [PubMed] [Google Scholar]
- 13. Walther A, Johnstone E, Swanton C, Midgley R, Tomlinson I, Kerr D. Genetic prognostic and predictive markers in colorectal cancer. Nat Rev Cancer. 2009;9:489‐499. [DOI] [PubMed] [Google Scholar]
- 14. Baselga J. The EGFR as a target for anticancer therapy–Focus on cetuximab. Eur J Cancer. 2001;37(Suppl. 4):S16‐S22. [DOI] [PubMed] [Google Scholar]
- 15. Lievre A, Bachet JB, Le Corre D, et al. KRAS mutation status is predictive of response to cetuximab therapy in colorectal cancer. Cancer Res. 2006;66:3992‐3995. [DOI] [PubMed] [Google Scholar]
- 16. Karapetis CS, Khambata‐Ford S, Jonker DJ, et al. K‐ras mutations and benefit from cetuximab in advanced colorectal cancer. New Engl J Med. 2008;359:1757‐1765. [DOI] [PubMed] [Google Scholar]
- 17. Hiraoka K, Inoue T, Taylor RD, et al. Inhibition of KRAS codon 12 mutants using a novel DNA‐alkylating pyrrole‐imidazole polyamide conjugate. Nat Commun. 2015;6:6706. [DOI] [PubMed] [Google Scholar]
- 18. Vidic S, Markelc B, Sersa G, et al. MicroRNAs targeting mutant K‐ras by electrotransfer inhibit human colorectal adenocarcinoma cell growth in vitro and in vivo. Cancer Gene Ther. 2010;17:409‐419. [DOI] [PubMed] [Google Scholar]
- 19. Taniguchi K, Sugito N, Kumazaki M, et al. MicroRNA‐124 inhibits cancer cell growth through PTB1/PKM1/PKM2 feedback cascade in colorectal cancer. Cancer Lett. 2015;363:17‐27. [DOI] [PubMed] [Google Scholar]
- 20. Sayed D, Abdellatif M. MicroRNAs in development and disease. Physiol Rev. 2011;91:827‐887. [DOI] [PubMed] [Google Scholar]
- 21. Ardekani AM, Naeini MM. The role of microRNAs in human diseases. Avicenna J Med Biotechnol. 2010;2:161‐179. [PMC free article] [PubMed] [Google Scholar]
- 22. Akao Y, Nakagawa Y, Hirata I, et al. Role of anti‐oncomirs miR‐143 and ‐145 in human colorectal tumors. Cancer Gene Ther. 2010;17:398‐408. [DOI] [PubMed] [Google Scholar]
- 23. Wang V, Wu W. MicroRNA‐based therapeutics for cancer. BioDrugs. 2009;23:15‐23. [DOI] [PubMed] [Google Scholar]
- 24. Price C, Chen J. MicroRNAs in cancer biology and therapy: current status and perspectives. Genes Dis. 2014;1:53‐63. [DOI] [PMC free article] [PubMed] [Google Scholar]
- 25. Beg MS, Brenner AJ, Sachdev J, et al. Phase I study of MRX34, a liposomal miR‐34a mimic, administered twice weekly in patients with advanced solid tumors. Invest New Drugs. 2017;35:180‐188. [DOI] [PMC free article] [PubMed] [Google Scholar]
- 26. Zeng X, Morgenstern R, Nystrom AM. Nanoparticle‐directed sub‐cellular localization of doxorubicin and the sensitization breast cancer cells by circumventing GST‐mediated drug resistance. Biomaterials. 2014;35:1227‐1239. [DOI] [PubMed] [Google Scholar]
- 27. Chen X, Guo X, Zhang H, et al. Role of miR‐143 targeting KRAS in colorectal tumorigenesis. Oncogene. 2009;28:1385‐1392. [DOI] [PubMed] [Google Scholar]
- 28. Akao Y, Nakagawa Y, Iio A, Naoe T. Role of microRNA‐143 in Fas‐mediated apoptosis in human T‐cell leukemia Jurkat cells. Leuk Res. 2009;33:1530‐1538. [DOI] [PubMed] [Google Scholar]
- 29. Noguchi S, Mori T, Hoshino Y, et al. MicroRNA‐143 functions as a tumor suppressor in human bladder cancer T24 cells. Cancer Lett. 2011;307:211‐220. [DOI] [PubMed] [Google Scholar]
- 30. Noguchi S, Yasui Y, Iwasaki J, et al. Replacement treatment with microRNA‐143 and ‐145 induces synergistic inhibition of the growth of human bladder cancer cells by regulating PI3K/Akt and MAPK signaling pathways. Cancer Lett. 2013;328:353‐361. [DOI] [PubMed] [Google Scholar]
- 31. Kim HJ, Zheng M, Miyata K, Kataoka K. Preparation of polyion complex micelles using block copolymers for SiRNA delivery. Methods Mol Biol. 2016;1364:89‐103. [DOI] [PubMed] [Google Scholar]
- 32. Brummelkamp TR, Bernards R, Agami R. Stable suppression of tumorigenicity by virus‐mediated RNA interference. Cancer Cell. 2002;2:243‐247. [DOI] [PubMed] [Google Scholar]
- 33. Lim KH, Counter CM. Reduction in the requirement of oncogenic Ras signaling to activation of PI3K/AKT pathway during tumor maintenance. Cancer Cell. 2005;8:381‐392. [DOI] [PubMed] [Google Scholar]
- 34. Konstantinopoulos PA, Karamouzis MV, Papavassiliou AG. Post‐translational modifications and regulation of the RAS superfamily of GTPases as anticancer targets. Nat Rev Drug Discov. 2007;6:541‐555. [DOI] [PubMed] [Google Scholar]
- 35. Hennig A, Markwart R, Wolff K, et al. Feedback activation of neurofibromin terminates growth factor‐induced Ras activation. J Cell Commun Signal. 2016;14:5. [DOI] [PMC free article] [PubMed] [Google Scholar]
- 36. Seiwert TY, Melotek JM, Blair EA, et al. Final results of a randomized phase 2 trial investigating the addition of cetuximab to induction chemotherapy and accelerated or hyperfractionated chemoradiation for locoregionally advanced head and neck cancer. Int J Rad Oncol Biol Phys. 2016;96:21‐29. [DOI] [PubMed] [Google Scholar]
- 37. Takaoka Y, Shimizu Y, Hasegawa H, et al. Forced expression of miR‐143 represses ERK5/c‐Myc and p68/p72 signaling in concert with miR‐145 in gut tumors of Apc(Min) mice. PLoS ONE. 2012;7:e42137. [DOI] [PMC free article] [PubMed] [Google Scholar]
- 38. Sugiyama T, Taniguchi K, Matsuhashi N, et al. MiR‐133b inhibits growth of human gastric cancer cells by silencing pyruvate kinase muscle‐splicer polypyrimidine tract‐binding protein 1. Cancer Sci. 2016;107:1767‐1775. [DOI] [PMC free article] [PubMed] [Google Scholar]
- 39. Taniguchi K, Ito Y, Sugito N, et al. Organ‐specific PTB1‐associated microRNAs determine expression of pyruvate kinase isoforms. Sci Rep. 2015;5:8647. [DOI] [PMC free article] [PubMed] [Google Scholar]
- 40. Zhou P, Chen WG, Li XW. MicroRNA‐143 acts as a tumor suppressor by targeting hexokinase 2 in human prostate cancer. Am J Cancer Res. 2015;5:2056‐2063. [PMC free article] [PubMed] [Google Scholar]
- 41. Huang C, Huang J, Ma P, Yu G. microRNA‐143 acts as a suppressor of hemangioma growth by targeting Bcl‐2. Gene. 2017;628:211‐217. [DOI] [PubMed] [Google Scholar]
- 42. Yang Z, Chen D, Nie J, et al. MicroRNA143 targets CD44 to inhibit breast cancer progression and stem cell‐like properties. Mol Med Rep. 2016;13:5193‐5199. [DOI] [PubMed] [Google Scholar]
Associated Data
This section collects any data citations, data availability statements, or supplementary materials included in this article.
Supplementary Materials