

Abstract
Sonodynamic therapy (SDT), which is based on photodynamic therapy (PDT), is a new cancer treatment modality. Unlike PDT, which has poor tissue penetration, ultrasound can penetrate deeply into tissues and largely target tumor tissue to mediate the cytotoxicity of sonosensitizers. We hypothesize that, similar to PDT, SDT may perform effectively as a cancer vaccine. Thus, we developed a therapeutic strategy to explore whether SDT can eliminate primary tumors, inhibit metastases, and prevent tumor relapse. In the present study, we found that HiPorfin (HPD)‐induced SDT killed tumor cells, promoted calreticulin expression on the cell surface and elicited immune responses. Meanwhile, we observed that SDT induced functional antitumor vaccination and abscopal effects in H22 tumor‐bearing mice. Furthermore, this strategy conferred an immunological memory, which could protect against tumor recurrence after the elimination of the initial tumor. These results showed important effects of SDT on immune responses.
Keywords: abscopal effect, cancer, immune response, photodynamic therapy, sonodynamic therapy
1. INTRODUCTION
Cancer is one of the deadliest diseases worldwide. Current therapeutic modalities have enhanced therapeutic effects in patients suffering from cancer; however, the curative effect remains unsatisfactory in patients with advanced cancer. In addition, the high recurrence rate of cancer has driven investigators to explore novel cancer treatment strategies.
Photodynamic therapy (PDT) can effectively eradicate cancer cells by producing reactive oxygen species (ROS) and causing cell apoptosis as a result of the transfer of energy from photons to photosensitizers in tissues.1 Also, recent studies2, 3 have shown that tumor cells treated in vitro with PDT can be used to generate potent cancer vaccines. Maturation was induced in dendritic cells (DC), which were activated to express interleukin (IL)‐12 by PDT‐generated tumor cell lysates. Tumor growth can be inhibited in vitro with a vaccine generated from PDT‐treated tumor cells of the same origin.4
However, poor tissue penetration of PDT has limited its use to superficial lesions.5 Thus, investigators have sought alternative types of energy that can deeply penetrate tissues. Emerging evidence has indicated that ultrasound‐activating sensitizers (sonosensitizers) can significantly damage malignant tumor cells.6 Meanwhile, ultrasound has a stronger penetration ability in biological tissues compared to photons.6, 7 Therefore, sonodynamic therapy (SDT) is considered to be a promising modality for treating malignancies.8 Non‐thermal ultrasound reaches non‐superficial objects and focuses on targeted tissues, inducing local cytotoxicity by activating sonosensitizers while minimizing undesirable injury to surrounding normal tissues.6
The most important problem in the development of SDT is the proper choice of parameters that primarily determine its therapeutic efficacy. Currently, experts are exploring a variety of parameters;9, 10 however, no specific criterion has yet been determined. The choice of ultrasound parameters may be one of the reasons restricting the use of SDT.11, 12 Satisfactory therapeutic performance cannot be achieved without appropriate parameters.
Recent studies of SDT have shown its effectiveness in killing tumor cells,13, 14 and a few of these studies have even investigated SDT in clinical practice.15, 16 However, the antitumor effect of SDT is often limited to tumor growth inhibition instead of tumor shrinkage.17 Therefore, the question for us is whether tumor shrinkage can be induced if the number of irradiation cycles is increased. Moreover, although the differences between PDT and SDT are not yet clear, the principles, processes, drugs needed and mechanisms of action of PDT and SDT are similar. Therefore, we hypothesize that similar to tumor cell lysates generated from PDT, SDT‐generated tumor cell lysates can elicit an immune reaction against tumor cells of the same origin. However, the establishment of systemic immune memory may be related to the number of cycles of SDT. Hence, we investigated the effect of SDT applied in 4 or 6 cycles on the induction of systemic immune responses in mice to determine its killing effect on tumor cells and its immunogenicity in tumor‐bearing mice.
2. MATERIALS AND METHODS
2.1. Sensitizer
HiPorfin (HPD, C34H38N4O6, 598.7, 25 mg/5 mL) was purchased from Huading Modern Bio‐pharmaceutical, Co., Ltd (Chongqing, China). Stock solutions at concentrations of 5, 10 and 20 μg/mL were made with normal saline (NS) and kept in the dark at −20°C until use.
2.2. Cell lines and animals
Human liver cancer cell line Hep3b was obtained from the Cell Library of Laboratory Animal Center, Sun Yat‐sen University (Guangzhou, China). Mouse liver cancer cell line H22 and S180 were obtained from Otwo Biotech Inc. (Guangzhou, China). Athymic male/female nude mice (6 weeks old, 25‐30 g) and KM mice (6 weeks old, 25‐30 g) were provided by the Laboratory Animal Center of Sun Yat‐sen University.
All animal studies were conducted in accordance with the principles and procedures outlined in the Southern Medical University Guide for the Care and Use of Animals under assurance number SCXK (Guangdong) 2016‐0167.
2.3. Antibodies
The following antibodies were used in this study: anti‐calreticulin (anti‐CRT) [EPR3924]‐ER Marker (Alexa Fluor 488) (ab196158), anti‐CD8 antibody (ab203035) (Abcam, Cambridge, UK); rabbit polyclonal anti‐CD4 (11056‐AP), rabbit polyclonal anti‐CD8 (25747‐1‐AP), rabbit polyclonal anti‐CD163 (16646‐1‐AP), rabbit polyclonal anti‐FoxP3 (22228‐1‐AP) (Proteintech), and rabbit anti‐IL‐2RA/CD25 (bs‐0577R) (Bioss).
2.4. Ultrasound irradiation system
Ultrasound therapeutic apparatus (Haphel, XK‐2011R) was purchased from XingKang Medical Apparatus Co. (Wuhan, China). The transducer (diameter 3.5 cm, resonance frequency 1.0 MHz) was placed in a degassed water bath, and the cells or mice were placed at a vertical distance of 5 cm from the transducer (Figure 1).
Figure 1.

Experimental set‐up for ultrasound irradiation
2.5. Optimal parameters for SDT
To investigate the efficacy of SDT, the 4 parameters: photosensitizer concentration, ultrasound intensity, irradiation time, and ultrasound frequency, were set at 3 levels (Table 1). An orthogonal experimental approach was adopted using these 4 parameters (Table 2). MTT analysis, cell apoptosis, intracellular ROS in vitro, and anticancer efficacy in vivo were conducted to explore the optimal parameters for SDT. All experiments were carried out avoiding light.
Table 1.
Four parameters set at three levels
| Factors levels | A Photosensitizer concentration (μg/mL) | B Ultrasound intensity (W/cm2) | C Ultrasound frequency (%) | D Irradiation time (min) |
|---|---|---|---|---|
| 1 | 5 | 0.25 | 20 | 5 |
| 2 | 10 | 0.75 | 30 | 20 |
| 3 | 20 | 1 | 50 | 30 |
Four factors were set at three levels to explore the effects of different combinations.
Table 2.
Orthogonal experimental protocol representing the 3 levels for each of the 4 parameters
| Group | Photosensitizer concentration | Ultrasound intensity | Ultrasound frequency | Irradiation time |
|---|---|---|---|---|
| 1 | A1 | B2 | C3 | D3 |
| 2 | A2 | B3 | C3 | D1 |
| 3 | A2 | B1 | C2 | D3 |
| 4 | A1 | B3 | C2 | D2 |
| 5 | A3 | B2 | C2 | D1 |
| 6 | A3 | B3 | C1 | D3 |
| 7 | A1 | B1 | C1 | D1 |
| 8 | A3 | B1 | C3 | D2 |
| 9 | A2 | B2 | C1 | D2 |
According to orthogonal experimental design method, the 3 levels of the 4 parameters were divided into 9 groups.
2.5.1. MTT analysis
Hep3b cells were incubated with HPD (5, 10 or 20 μg/mL). After 4 hours of incubation, the cells were exposed to ultrasound of various intensities (ie, 0.25, 0.75 or 1.0 W/cm2) for durations of 5, 20 or 30 minutes. Finally, the treated cells (5 × 10³ cells/well) were seeded in 96‐well microplates and then incubated at 37°C for 24 hours. Cytotoxicity was then determined using MTT assay. Optical density (OD) at 490 nm was then measured using Gen5 CHS 2.07 software. Killing rate was calculated using the following equation:
2.5.2. Analysis of cell apoptosis in vitro
Hep3b cells were incubated for 24 hours after various treatments, washed 3 times with PBS and resuspended in 100 μL 1× Annexin‐binding buffer. After adding 5 μL Alexa Fluor 488 Annexin V and 10 μL propidium iodide (PI) working solution to each cell suspension, the cells were incubated at room temperature for 15 minutes. Then, 400 μL of 1× Annexin‐binding buffer was added, and the solution was analyzed immediately using a flow cytometer (Becton, Dickinson and Company, Franklin Lakes, NJ, USA). Cells labeled with Annexin V‐FITC were considered early apoptotic cells, whereas the cells stained with both Annexin V‐FITC and PI were considered late apoptotic cells. Annexin V‐FITC Apoptosis Detection Kit was purchased from Beyotime Co. (Shanghai, China).
2.5.3. Detection of intracellular ROS
Production of ROS was measured using dichlorodihydrofluorescein diacetate (DCFH‐DA). Briefly, the treated cells were harvested, washed with PBS, and stained with 20 μm DCFH‐DA (Beyotime Co.) for 20 minutes at 37°C in the dark. Fluorescence signals were detected with a FACSVerse flow cytometer (Becton, Dickinson and Company).
2.5.4. Analysis of anticancer efficacy in vivo
Tumors were established in mice through s.c. inoculation of Hep3b cell suspensions (5 × 10⁶ cells per mouse) into the left flank of 6‐week‐old mice. Five groups of mice were compared: PBS with irradiation served as the control group and there were 4 groups with optimal SDT parameters according to the results above in 0, 1, 2, 3, and 4 cycles with HPD. When the tumors reached 100 mm3 in volume, HPD was injected into the animals. Four hours after injection, the mice were anesthetized with 2.5% (ip) phenobarbital, and tumors were exposed to 1.0 W/cm2 ultrasound for 2 hours. Tumor growth and body weight of mice were monitored. Tumor size was measured daily with a digital caliper. Tumor volumes were calculated as follows: (width2 × length)/2. All above experiments were repeated 3 times.
2.6. Evaluation of in vitro immunogenic cell death
Immunofluorescence and flow cytometry were used to evaluate immunogenic cell death (ICD) induced by SDT.
2.6.1. Immunofluorescence
Hep3b cells were seeded at 5 × 10⁵ cells/well in 6‐well plates and further cultured for 24 hours. The cells were incubated with HPD at an equivalent dose of 20 μL/mL in 2 aliquots, whereas those incubated with PBS served as the controls. One hour later, the cells were irradiated with ultrasound at 1.0 W/cm2 for 2 hours. After washing with PBS, the cells were fixed with 4% paraformaldehyde (PFA), incubated with Alexa Fluor 488‐CRT antibody for 2 hours, stained with DAPI and observed using confocal laser‐scanning microscopy (CLSM; LSM 800 basic operation) with 405‐ and 488‐nm lasers to visualize nuclei and membrane expression of CRT, respectively.
2.6.2. Flow cytometry
Hep3b cells were seeded at 1 × 10⁶ cells per well in 6‐well plates. After treatment with SDT and a further 4‐hour incubation, the cells were collected, incubated with Alexa Fluor 488‐CRT antibody for 2 hours and stained with PI. The samples were analyzed with flow cytometry (Becton, Dickinson and Company) to identify cell surface CRT. Fluorescence intensity of stained cells was determined based on PI‐negative cells. All experiments were repeated 3 times.
2.7. Evaluation of anticancer effect in a mouse model of liver cancer
Tumors were established by s.c. inoculation with H22 cell suspension (5 × 10⁶ cells per mouse) into the left flanks of 6‐week‐old KM mice. Six groups of mice were compared to explore the effects of multiple parameters of SDT: PBS with irradiation as the control; HPD with ultrasound irradiation for 6 cycles; ultrasound irradiation for 6 cycles; HPD with ultrasound irradiation for 4 cycles; ultrasound irradiation for 4 cycles; and HPD without ultrasound irradiation. When the tumors reached 200‐300 mm3 in volume, HPD was injected into the animals. Four hours later, the mice were anesthetized with 2.5% (ip) phenobarbitone, and the tumors were irradiated with 1.0 W/cm2 ultrasound for 2 hours in 1 cycle.
Tumor growth was monitored. Tumor size was measured daily with a digital caliper. Tumor volumes were calculated as follows: (width2 × length)/2.
2.8. Enzyme‐linked immunosorbent assay
Tumors were established through s.c. inoculation with an H22 cell suspension (5 × 10⁶ cells per mouse) into the left flanks of 6‐week‐old KM mice. According to the study results we selected ultrasound irradiation for 6 cycles to explore immune responses as a result of SDT. Four groups of mice were compared: PBS with irradiation as a control; HPD with ultrasound irradiation for 6 cycles; ultrasound irradiation for 6 cycles; and HPD without ultrasound irradiation. Each group contained 10 mice. When the tumors reached 200‐300 mm3 in volume, HPD was injected into the animals. Four hours later, the mice were anesthetized with 2.5% (ip) phenobarbitone, and the tumors were irradiated with 1.0 W/cm2 ultrasound for 2 hours in 1 cycle.
In these tumor models, blood from 3 mice per group was collected on days 7, 10, 14, 17, 20 and 24. Serum IL‐2, interferon (IFN)‐γ and IL‐10 levels were determined through ELISA (Cloud‐Clone Corp.) to evaluate the immunogenic responses evoked by the treatments.
2.9. Hematoxylin and eosin staining for pathological analysis
Three randomly chosen mice per group were killed on day 24. Tumors were stained with H&E for histopathological analysis. Livers, lungs, kidneys and hearts excised from the mice were embedded in optimal cutting temperature medium, cut into sections of 4‐μm thickness, stained with H&E and observed for toxicity by light microscopy (Panoramic Scan Whole Slide Scanner; Perkin Elmer, Waltham, MA, USA).
2.10. Primary tumor tissue immunohistochemical staining
Excised tumors were fixed in 4% PFA, dehydrated in a graded ethanol series, cleared in dimethylbenzene, and embedded in paraffin. Tissue blocks were sectioned to 4‐μm sections and the sections were mounted on glass slides. Tissue sections were deparaffinized rehydrated, heated in citrate buffer (0.01 mol/L, pH 6.0), and treated with endogenous peroxidase at room temperature. After blocking in 10% goat serum, the sections were stained with primary antibodies against CD4, CD8, CD68, CD163, CD25, and FoxP3, and incubated overnight at 4°C. The sections were incubated with secondary antibodies and stained with diaminobenzidine (DAB) reagent. Finally, all sections were observed under a positive fluorescence microscope (BX43; Olympus, Tokyo, Japan). Immunopositivity of cells was quantified using integrated OD (IOD) values with Image‐Pro Plus 6.0.
2.11. Analysis of the abscopal effect in an H22 tumor model
Forty KM mice were s.c. injected with 5 × 10⁶ H22 cells in the left flank (primary tumor) and 5 × 10⁶ H22 cells in the right flank (secondary tumor). Four groups of mice were compared: PBS with irradiation as a control; HPD with ultrasound irradiation for 6 cycles; ultrasound irradiation for 6 cycles; and HPD without ultrasound irradiation. When the primary tumor reached 200~300 mm3 in volume, HPD was injected (ip) into the animals (a total of 6 injections). Four hours after the injections, the mice were anesthetized with 2.5% (ip) phenobarbitone, and primary tumors were irradiated with 1.0 W/cm2, 1.0 MHz ultrasound. Primary and secondary tumor sizes and mouse body weights were monitored every 3 days. Tumor size was measured with a digital caliper and calculated as follows: (width2 × length)/2.
2.12. Analysis of CTL‐specific response to tumor cells
Mice of 4 groups were killed. Spleens were removed to pulverize under aseptic conditions, filtered through a 120‐mesh sieve, washed 3 times, and RPMI 1640 medium was then used with serum matching to create a 1 × 10⁶/L cell suspension. Using spleen cells as effector cells, H22 and S180 cells (1 × 10⁶/L) were used as target tumor cells. The spleen cells and tumor cells with an E:T (Effector cells: Target cells) ratio of 100:1, 50:1, and 25:1 were seeded in 96‐well plates at 37°C and 5% CO2 incubation for 4 hours. And set the lactate dehydrogenase (LDH) release biggest hole (join 2% Triton to tumor cells) and natural release hole (join culture medium to tumor cells) to evaluate the experimental release of LDH in three kinds of cells. LDH Cytotoxicity Assay Kit was purchased from Beyotime Co. All results were repeated 3 times. Percent cytotoxicity was calculated as follows:
2.13. Distant tumor tissue immunohistochemical staining
The basic procedures are the same as that for primary tumor tissues. All sections were stained with CD4, CD8 antibodies and observed under a positive fluorescence microscope (BX43; Olympus). Immunopositivity of cells was quantified using IOD values with Image‐Pro Plus 6.0.
2.14. Statistical analysis
Statistical analyses were carried out using SPSS 20.0. Between‐groups differences were compared through analysis of variance (ANOVA), and P < .05 indicated a significant difference.
3. RESULTS
3.1. Optimal parameters for SDT
Optimal parameters are the foundation for SDT and can maximize therapeutic effects and minimize side‐effects. Therefore, we designed experimental schemes based on 4 primary parameters: concentration of photosensitizers (μg/mL), intensity of ultrasound (W/cm2), frequency of ultrasound (%) and irradiation time (minutes) (Tables 1 and 2), designated A, B, C and D, respectively. Hep3b cells were incubated for 24 hours to assess the effect of different parameters for ultrasound irradiation on the cells.
Relative survival rates of Hep3b cells in the presence of 1 mL HPD and ultrasound irradiation are shown in Figure 2A and Table 1. The highest relative survival in Hep3b cells was observed in group 7 at 1.0969 ± 0.4420, and the lowest survival was observed in group 9 at 0.7777 ± 0.8623. Results of univariate analysis indicated significant between‐groups differences at various HPD concentrations (P < .001), ultrasound intensities (P = .008), ultrasound frequencies (P = .396) and irradiation times (P = .002). In addition, the efficacy of SDT was affected by the parameters in the following order A > D > B > C. Orthogonal analysis indicated that for HPD concentration, A2 was the least effective (rate = 0.830), and the effects of A2 and A3 differed markedly from those of A1, whereas there was no significant difference between the effects of A2 and A3. B2 showed the least effective (relative survival rate = 0.817), and the effects of B1 and B3 differed markedly from those of B2, whereas there was no significant difference between the effects of B1 and B3. C3 showed the least effective ultrasound frequency (rate = 0.855), and there was no significant difference between the effects of the 3 frequencies; and for irradiation time, D3 was the least effective (rate = 0.816), and neither the effects of D1 nor D3 differed from those of D2, although the effects of D1 and D3 were significantly different. Therefore, according to the results of the MTT assay, the ideal parameters were A2, B2, C3, and D3.
Figure 2.
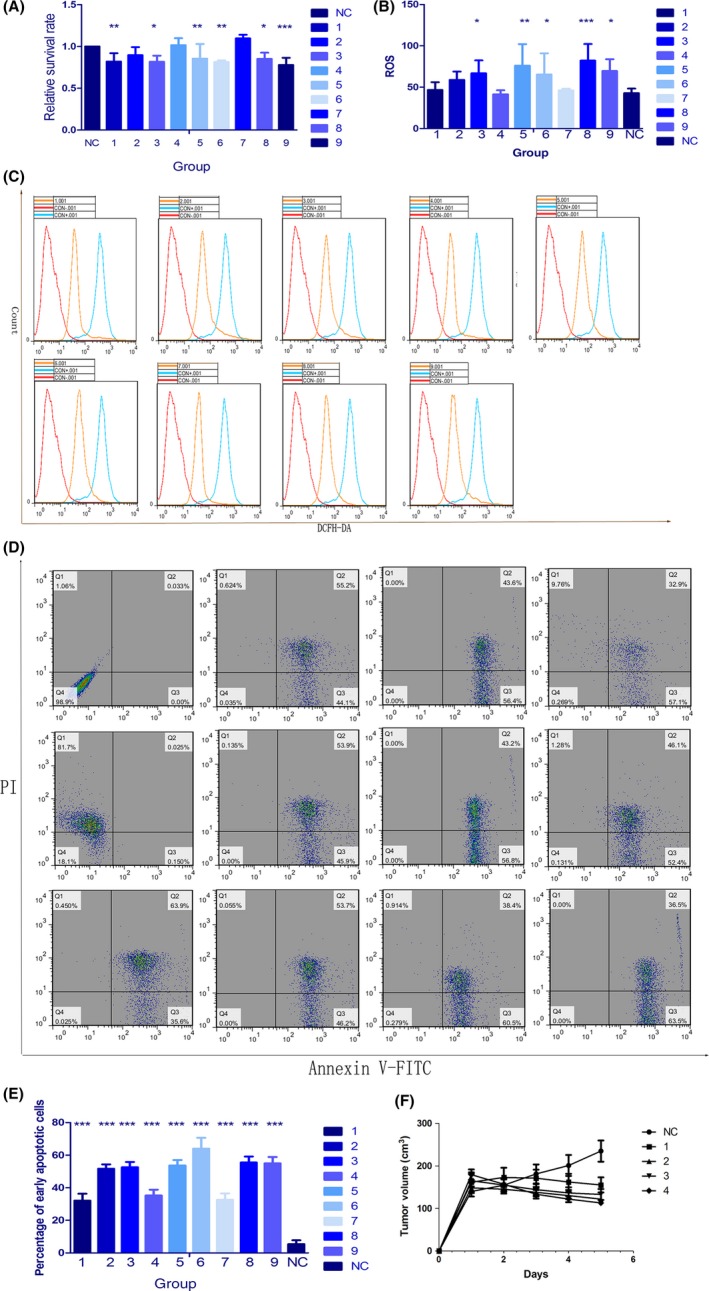
Optimal parameters for sonodynamic therapy (SDT). A, Cell viability in the 9 groups (Tables 1 and 2) was determined using the MTT assay. B, C, Reactive oxygen species (ROS) levels were measured using dichlorodihydrofluorescein diacetate (DCFH‐DA). Fluorescence signals were detected with a FACSVerse flow cytometer. D, E, Apoptotic cell death (Annexin V/propidium iodide [PI] staining) was measured using flow cytometry in the 9 groups of Hep3b cells cotreated with HiPorfin (HPD) and ultrasound. F, Changes in tumor volume in 40 mice. Nude mice bearing s.c. tumors on the right flank were randomly divided into 5 groups and irradiated for 0, 1, 2, 3 and 4 cycles to explore the relationship between the number of irradiation cycles and therapeutic effects (n = 8). Results were calculated and presented as the means ± standard deviation (SD). Student's t tests and ANOVA were carried out, and levels of significance are indicated as *P < .05; **P < .01; and ***P < .001. NC, control group
Generation of ROS is considered the primary mechanism of action of SDT. Therefore, the production of ROS was analyzed with DCFH‐DA staining followed by flow cytometry. Compared with that in the negative control group, level of ROS increased in the experimental groups (Figure 2B,C). Results of 1‐way ANOVA indicated significant differences among groups (P = .004). Univariate analysis showed that the production of ROS was primarily determined by the concentration of HPD (P < .001). For HPD concentration, A3 was the most effective (ROS = 74.508), and the effects of A2 and A3 were markedly different from those of A1, whereas there was no significant difference between the effects of A2 and A3. Therefore, the efficacy of SDT is optimal with 20 μg/mL HPD.
To investigate the differences in apoptosis among the various groups, percentage of apoptotic cells was determined through flow cytometry. Results for the 9 experimental groups (Figure 2D,E) differed significantly from the results for the control group (P < .001). All treatments of 9 groups were able to kill more than 95% of the tumor cells. The highest percentage of early apoptotic Hep3b cells was observed in group 6 at 64.052 ± 6.627%, and the lowest percentage was observed in group 1 at 32.094 ± 4.295%. Univariate analysis indicated significant differences for the various values of ultrasound intensity (P = .039), ultrasound frequency (P = .022) and HPD concentration (P < .0001). Efficacy of SDT was affected by the parameters in the following order: A > C > D > B. Orthogonal analysis indicated that for HPD, A3 was the most effective (percentage of apoptotic cells = 57.74067%), and there was a significant difference among the effects of the 3 concentrations. For ultrasound intensity, B3 was the most effective (percentage of apoptotic cells = 50.33000%), and the effects of B1 and B2 were markedly different from those of B3, whereas there was no significant difference between the effects of B1 and B2. For ultrasound frequency, C1 was the most effective (percentage of apoptotic cells = 50.50467%), and the effects of both C2 and C3 differed markedly from the effects of C1. There was no significant difference in effects between C2 and C3. For irradiation time, D3 was the most effective (percentage of apoptotic cells = 49.59533%), and the effects of D1 and D3 were not different from those of D2, although the effects of D1 and D3 were significantly different. Therefore, according to the percentage of apoptotic cells, the ideal parameters were A3, B3, C1, and D3.
For Hep3b cells, the optimal parameters for SDT were 1.0 W/cm2 ultrasound irradiation for 30 minutes with 20 μg/mL HPD. Because of the lack of difference between the third ultrasound frequencies, we used 50% frequency in subsequent experiments.
To explore the relation between the number of successive irradiation cycles and therapeutic effect, 40 nude mice were randomly divided into 5 groups and irradiated for 0, 1, 2, 3 and 4 cycles. When the primary tumors reached 100‐200 mm3 in volume, we began irradiation and measured tumor size. Interestingly, tumor size in the group that had been irradiated for 4 cycles was clearly smaller than that in the other groups (P = .001) (Figure 2F). Therefore, in subsequent experiments, we used 1.0 W/cm2 and 50% ultrasound irradiation for 2 hours.
3.2. Investigation of CRT expression
Calreticulin is a distinct marker on the surface of cells undergoing ICD.18, 19 ICD activate the immune responses through a prominent pathway against cancer cells, which then determines the long‐term effect of anticancer therapies.20 Using flow cytometry (Figure 3A) and immunofluorescence (Figure 3B), we evaluated CRT expression on cells subjected to SDT and compared the results with those in cells treated with PBS, ultrasound, HPD alone and HPD with ultrasound. We collected and stained the cells with Alexa Flour 488‐CRT antibody and PI for flow cytometry and determined the fluorescence intensity of CRT‐expressing cells gated based on PI‐negative cells. The ultrasound group and the SDT group showed an increase, but the difference was small. In order to determine which group expressed more CRT, the cells were stained with Alexa Fluor 488‐CRT and DAPI and examined by CLSM. Significant expression of CRT was detected on the surface of cells treated with HPD and ultrasound. HPD induced CRT expression on cell membranes upon ultrasound irradiation, indicating that SDT can induce ICD. CRT translocates to the cell surface during cellular stress and tumorigenesis, and cell surface CRT is an ‘eat me’ signal, which induces immune responses.21 Therefore, SDT can elicit immune responses.
Figure 3.

Sonodynamic therapy (SDT) induces immunogenic cell death (ICD). A, Calreticulin (CRT) expression on the surface of Hep3b cells was assessed through flow cytometry after treatment with PBS, ultrasound, HiPorfin (HPD) and HPD with ultrasound. Fluorescence intensity was determined based on propidium iodide (PI)‐negative cells. B, Hep3b cells were collected, fixed and subjected to immunofluorescence staining after treatment with PBS, ultrasound, HPD and HPD with ultrasound. White arrows indicate CRT. CRT expression on the cell surface was the most noticeable in the HPD with ultrasound group. Scale bar, 100 μm
3.3. In vivo antitumor immunity caused by SDT with HPD
In response to antigen stimulus, T cells are induced to differentiate into 2 types of helper T (Th) cells, namely, Th1 and Th2 cells.22 Th1 cells can secrete cytokines such as IL‐2 and IFN‐γ, which participate in cell‐mediated immune reactions, whereas Th2 cells can secrete cytokines, such as IL‐10, which are involved in systemic immune responses.23 Earlier studies have shown that tumor tissues can secrete Th2 cytokines. In addition, induction of Th2 cytokine production is one of the mechanisms of tumor immune escape.24 Therefore, we assessed the serum levels of cytokines in KM mice subjected to SDT and observed a shift from Th1 to Th2 cells. To evaluate the antitumor immunity evoked by SDT and HPD, we collected blood every 3 days from syngeneic tumor‐bearing mice, beginning on the first day of HPD injection (day 7 after tumor inoculation) to day 17. Sera were isolated and analyzed by ELISA to determine the concentration of IFN‐γ (Figure 4A), IL‐2 (Figure 4B) and IL‐10 (Figure 4C). No significant differences were observed in the 3 pro‐inflammatory cytokine levels among the control, HPD and ultrasound groups during the experimental period. However, significantly higher levels of IL‐2 (P = .001, vs control), IFN‐γ (P < .0001, vs control) and lower levels of IL‐10 (P < .0001, vs control) were observed in mice treated by ultrasound irradiation with HPD on day 10 after continuous irradiation, suggesting that SDT could successfully activate innate immune responses, cause inflammation and promote the switch from Th2 to Th1 cells in tumors.
Figure 4.
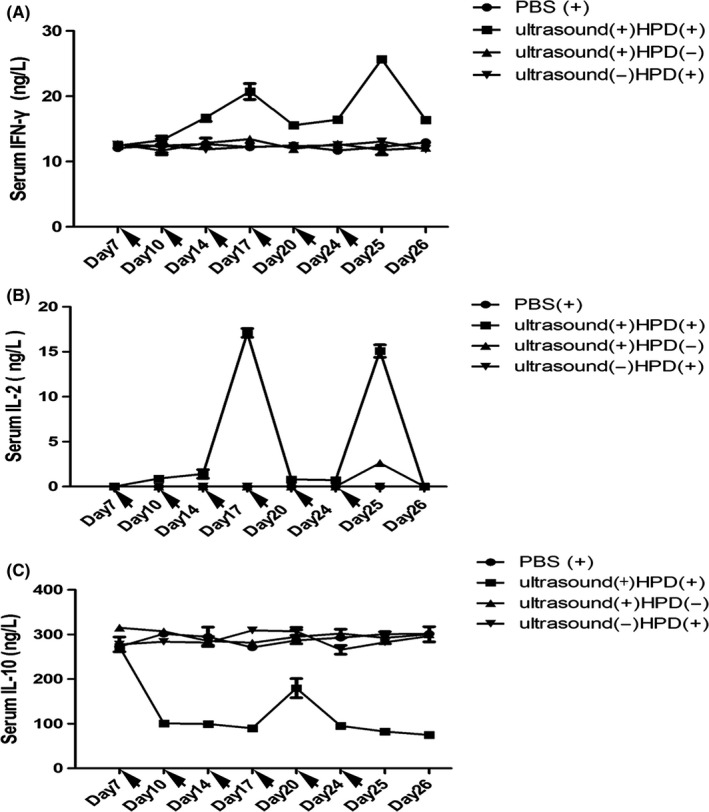
Pro‐inflammatory cytokine levels in the sera of mice treated by ultrasound with HiPorfin (HPD) for 6 cycles. Syngeneic H22 tumor‐bearing mice were injected (ip) with PBS and with or without HPD, then ultrasound(+) and ultrasound(+)HPD(+) groups were followed by ultrasound irradiation (1.0 W/cm2, 50%, 2 h). Blood was collected every 3 days from day 1, when the mice received their first ip, injection of HPD, through day 8. Serum was isolated, and the concentrations of (A) interferon (IFN)‐γ, (B) interleukin (IL)‐2 and (C) IL‐10 were determined by ELISA. Data are expressed as the means ± SD (n = 3)
3.4. Anticancer effect in a murine liver cancer model
H22 tumor‐bearing mice were used to assess the in vivo anticancer effects of SDT with HPD. Tumor‐bearing mice were i.v. injected with: (i) PBS, (ii) HPD, (iii) HPD with ultrasound or (iv) HPD without ultrasound. The mice were treated for a total of 6 cycles (Figure 5A) or 4 cycles (Figure 5B). Twenty‐four hours post‐injection, the mice were anesthetized with 2.5% (v/v) isoflurane, and the tumors were exposed to 1.0 W/cm2, 50% ultrasound irradiation for 2 hours. As shown in Figure 5, HPD combined with ultrasound irradiation effectively inhibited tumor growth in the treatment groups, and the mice that were exposed to 6 treatment cycles (P < .001, vs control) experienced better antitumor effects than did the mice that were exposed to 4 cycles (P < .001, vs control). Without HPD, ultrasound irradiation exerted moderate anticancer effects when given either for 4 (P = .051) or 6 (P < .001) cycles. No significant difference was observed between the control and HPD‐only groups. Therefore, monotherapy with ultrasound inhibited tumor growth, and tumor inhibition by HPD was triggered by ultrasound.
Figure 5.
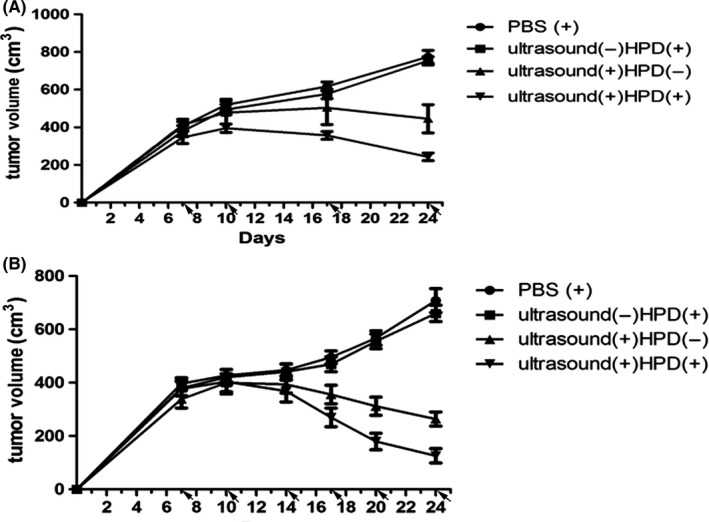
In vivo antitumor activity of sonodynamic therapy (SDT) for different numbers of cycles. PBS with or without HiPorfin (HPD) was injected (ip) into H22 tumor‐bearing mice for 4 or 6 cycles, then ultrasound(+) and ultrasound(+)HPD(+) groups were followed by ultrasound irradiation (1.0 W/cm2, 50%, 2 h) 4 h after each injection. Tumor growth inhibition curves for the H22 xenograft treated with (A) 4 (P < .05) or (B) 6 (P < .05) cycles. Data are expressed as the means ± SD (n = 10)
3.5. Abscopal effect in a murine liver cancer model
Next, we examined whether SDT with HPD could potentially be used in vaccination strategies to improve anticancer efficacy and antitumor immunity. A bilateral H22 tumor model was developed by s.c. injecting H22 cells into the left and right flanks of KM mice. The tumors on the left were designated primary tumors for local ultrasound irradiation, and the tumors on the right were designated distant (abscopal) tumors. When the primary tumors reached 200~300 mm2 in volume, the mice were randomly divided into 4 groups. HPD was injected into the animals every 3 days for a total of 6 injections, followed by ultrasound irradiation on primary tumors (1.0 W/cm2, 2 hours, 50%) 24 hours post‐injection. In the absence of ultrasound irradiation (Figure 6), HPD did not inhibit the primary nor distant tumors relative to the tumors injected with PBS. In contrast, HPD plus ultrasound caused a significant growth delay in distant tumors (P < .0001, vs control). Therefore, a total of 10 mice showed abscopal responses in response to SDT, and 2 mice showed complete abscopal responses, indicating that the combination of HPD with ultrasound can successfully elicit antitumor immunity.
Figure 6.

Abscopal effect of sonodynamic therapy (SDT). A, Bilateral H22 tumor model was made by s.c. injecting cancer cells into the right and left flanks of each animal. Tumors on the left were treated as primary tumors for ultrasound irradiation, and tumors on the right were treated as distant tumors which did not receive ultrasound irradiation. PBS or HiPorfin (HPD) was injected (ip) into the H22 tumor‐bearing mice for 4 or 6 cycles, followed by ultrasound irradiation (1.0 W/cm2, 50%, 2 h) 4 h after each injection. B, Tumor growth inhibition curves for H22 xenograft models after 6 treatment cycles (P < .05). Data are expressed as the means ± SD (n = 10)
3.6. Re‐challenge of cured mice
After successful SDT, 2 tumor‐free mice were re‐challenged with 5 × 10⁶ H22 cells 30 days after the treatment. To compare tumor growth in control mice of the same age, 2 naive mice of the same age (9‐11 weeks) were inoculated with 5 × 10⁶ H22 cells per mouse. All of the cured mice were completely resistant to the re‐challenge; neither primary tumors nor metastatic tumors were observed in these mice. However, all the control mice developed primary and metastatic tumors and died approximately 60 days after the tumor inoculation.
3.7. Immunohistochemical analysis of tumor tissues
After treatment, tumor tissues were collected and analyzed by histochemical assays using tumor‐selective antibodies. T cells can be classified into ‘helper’ (CD4) and ‘cytotoxic’ (CD8) T cells after being activated by tumor antigens. CD68 is the common glycogenic antigen expressed on macrophages and, thus, antibodies against CD163 can be used for the detection of different classes of tumor‐associated macrophages (TAM), namely, M1 and M2 (immune‐suppressive).25, 26 In the present study, we chose CD163 and CD68 to identify M2 macrophages and thus observed the effect of SDT on the differentiation of TAM. In addition, regulatory T cells mediating immunoregulation is one of the most important mechanisms for maintaining self‐tolerance. When they are induced, they express CD25 and FoxP3. By evaluating the expression of CD25 and FoxP3 in tumor tissues, we identified the effects of SDT on the immune system. As seen in Figure 7A, results showed that the expressions of CD4 and CD8 in the SDT group were increased, which were assessed as moderately positive by immunohistochemistry and as moderate infiltration within tumor issues, whereas no or less tumor‐infiltrating CD4 and CD8 were observed in tissues of the other 3 groups. At the same time, CD68 was more highly expressed in the SDT group, whereas CD163 was observed at a lower expression in this group compared with the other groups. Expressions of CD25 and FoxP3 followed similar trends to that of CD163.
Figure 7.
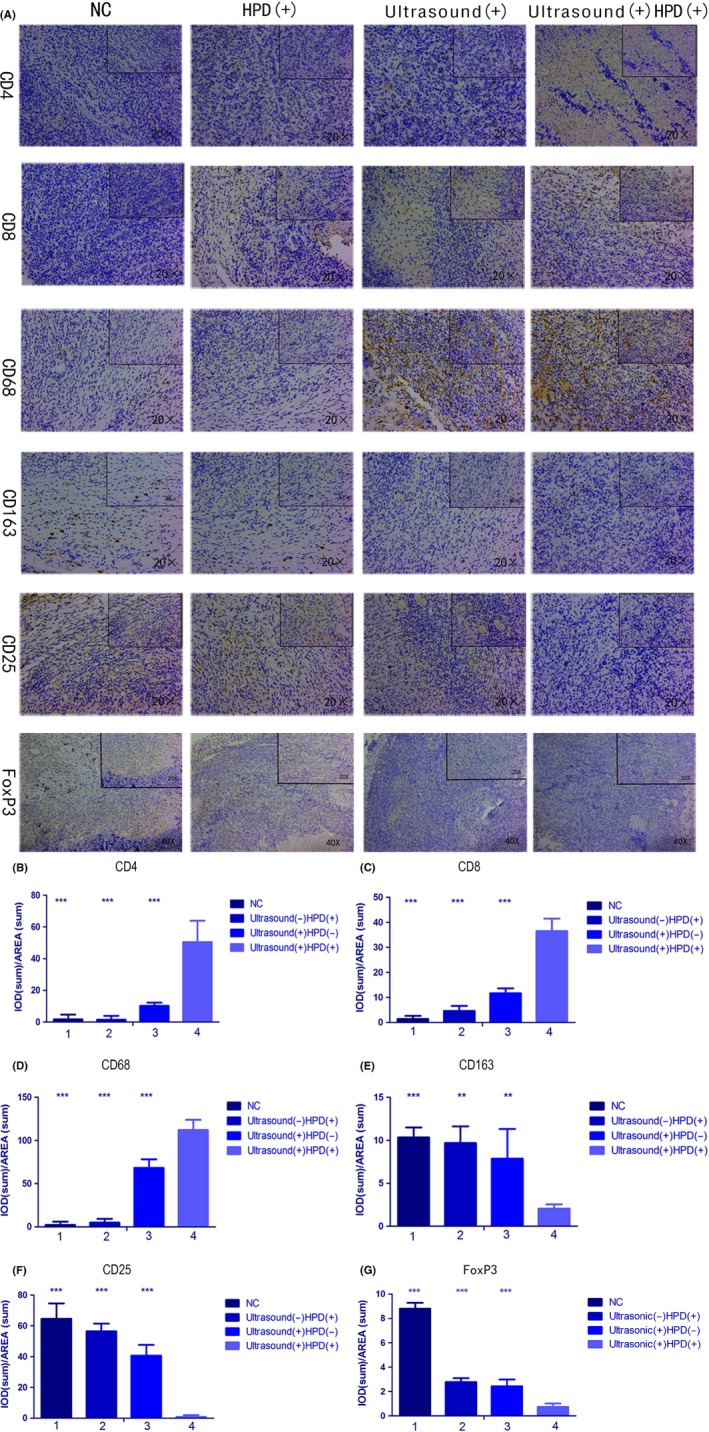
Immunohistochemical analysis of primary tumor tissues. A, Analysis of CD4, CD8, CD68, CD163, CD25, and FoxP3 expression in tissues after 6 cycles of treatment with PBS, ultrasound, HiPorfin (HPD) and HPD and ultrasound. Magnification, 20× and 40×. B‐F, Immunopositivity in cells was quantified based on integrated optical density (IOD) values with Image‐Pro Plus 6.0. Values were calculated as the IOD/area and presented as means ± SD (n = 3). t tests and ANOVA were carried out, and levels of significance for each group vs the sonodynamic therapy (SDT) group are indicated as **P < .01; and ***P < .001. NC, control group
Immunopositivity of cells was quantified based on IOD values by using Image‐Pro Plus 6.0. Results of 1‐way ANOVA indicated significant differences between groups (CD4, P < .001; CD8, P < .001; CD68, P < .001; CD163, P = .005; CD25, P < .001; and FoxP3, P < .0001) (Figure 7B‐G). Significant differences were observed within groups for the various SDT parameters. Tumor tissues subjected to SDT showed high expression levels of CD4, CD8, and CD68 and low expression levels of CD163, CD25, and FoxP3, which suggested that SDT could activate T cells, promote a shift from M2 to M1 macrophages and induce immune responses.26
3.8. Specific immune effect in a murine liver cancer model
Bilateral H22 tumor models in the SDT group showed both primary and distant tumor shrinkage, which suggested that SDT may have elicited an immune response. To further study whether the immune response was specific, we used (LDH) release experiments to evaluate the killing ability of CTL to H22 tumor cells specifically. LDH is an enzyme present in the cell cytoplasm that cannot penetrate the cell membrane under normal conditions. When target cells are attacked by effector cells, the cell membrane is damaged and its permeability is changed, allowing LDH to be released into the media.27 Through measurements of extracellular LDH, we could evaluate the killing ability and specificity of CTL for each group. Results showed that for H22 tumor cells (Figure 8A), the ability of CTL cells of the SDT group was obviously higher than that of the other 3 groups (P < .0001). When the E:T ratio was 100:1 (P < .0001), CTL cells had the strongest ability to kill tumor cells. On the contrary, for S180 tumor cells (Figure 8B), the killing capability of CTL cells showed no significant difference between the 4 groups (P = .123). CD4 and CD8 CTL are important when an immune response is produced. Also, CTL cells are the primary cells for killing tumor cells in tumor tissue. Therefore, we detected infiltration of CD4 and CD8 T cells in distant tumor tissue to confirm a specific immune response. A strong infiltration of CD4 and CD8 T cells could be found in the SDT group (Figure 9), which were quantified based on IOD values by using Image‐Pro Plus 6.0 (CD4, P < .0001; CD8, P < .0001). Results showed that SDT can cause a specific immune response in mice after treatment, and tumors eventually reduce or disappear.
Figure 8.
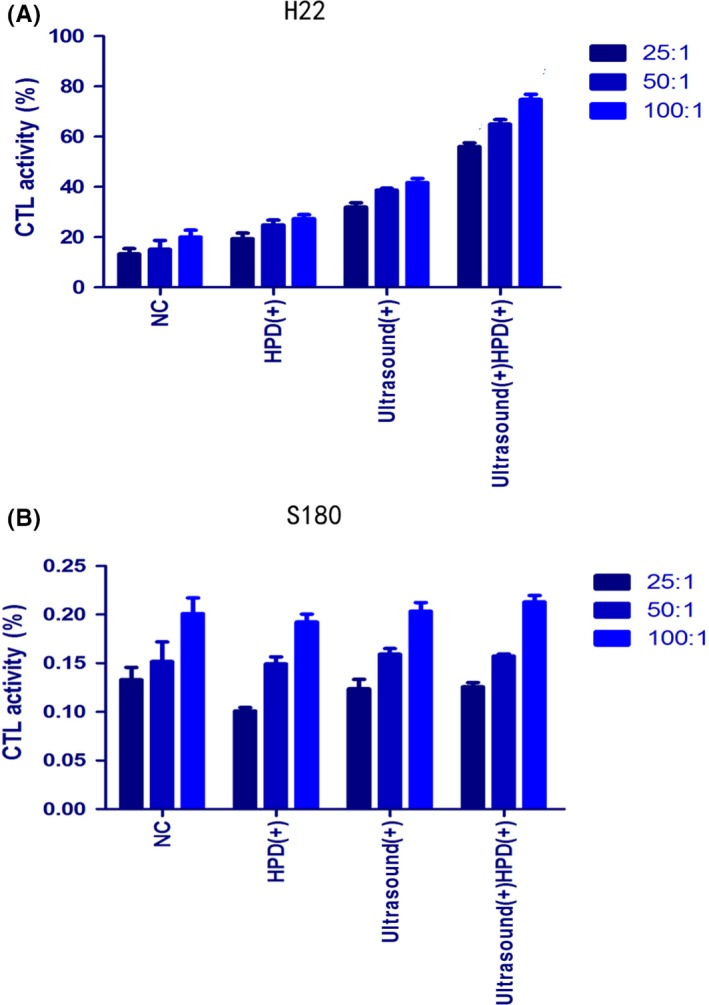
Specific CTL responses to (A) H22 and (B) S180 tumor cells. Spleen cells were collected as effector cells, and H22/S180 cells as target tumor cells. Spleen cells and tumor cells combined in an E:T ratio of 100:1, 50:1, and 25:1 were seeded in 96‐well plates at 37°C and 5% CO 2 incubator for 4 h. CTL activity was determined by lactate dehydrogenase releasing assay. All the experiments were carried out in triplicate, and the results are presented as the means ± SD (n = 3). t tests and ANOVA were carried out. NC, control group
Figure 9.
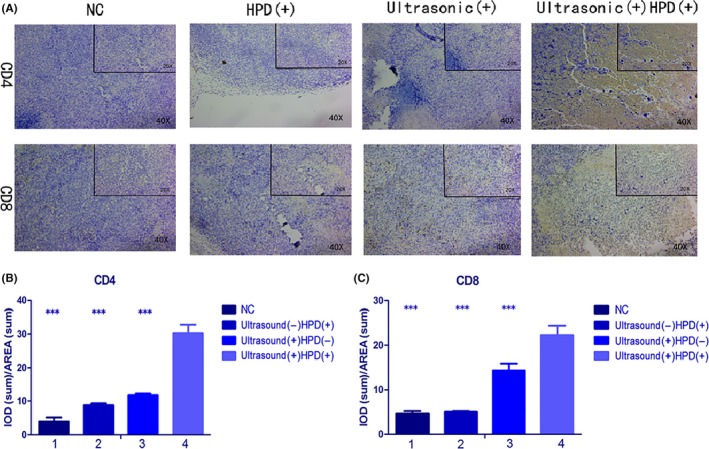
A, Immunohistochemical analysis of distant tumor tissues. Analysis of CD4 and CD8 expression in distant tissues after 6 cycles of treatment with PBS, ultrasound, HiPorfin (HPD) and HPD and ultrasound. Magnification, 20× and 40×. B, C, Immunopositivity in cells was quantified based on integrated optical density (IOD) values with Image‐Pro Plus 6.0. Values were calculated as the IOD/area and presented as the means ± SD (n = 3). t tests and ANOVA were carried out, and the levels of significance for each group vs the sonodynamic therapy (SDT) group are indicated as ***P < .001. NC, control group
3.9. H&E staining for pathological analysis
Cytotoxicity, including acute nephrotoxicity, cardiotoxicity and hepatotoxicity, as a result of SDT was assessed by H&E staining to determine the effect of SDT on the kidneys, hearts and livers of mice. In the current study, the groups subjected to 4 or 6 treatments showed normal renal glomeruli (Figure 10C), tubules and interstitium, with distinct epithelial cell boundaries in the renal tubule (particularly the proximal tubule). In addition, the liver cells (Figure 10B) maintained an intact structure, with the nuclei arranged in the center of the cells and the cytoplasm free of any sign of degradation or necrosis. Furthermore, the structure of myocardial cells was also normal (Figure 10A), with intact muscle fibers and without any inflammatory infiltration, necrosis, or myocardial fibrosis. Additionally, there was no lymphocyte infiltration or myocardial necrosis. Therefore, SDT is not cytotoxic and causes minimal undesirable injury to the surrounding normal tissues.
Figure 10.
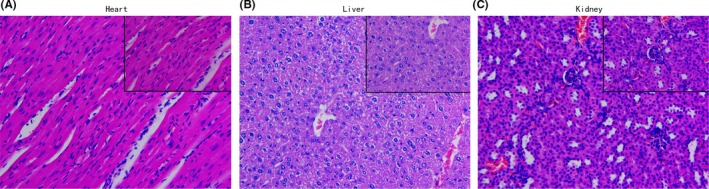
H&E staining for pathological analysis. Cytotoxicity, including acute nephrotoxicity, cardiotoxicity and hepatotoxicity of sonodynamic therapy was assessed by H&E staining to determine the effect on (A) heart, (B) liver and (C) kidney tissues after 6 cycles of treatment (magnification, 40×)
4. DISCUSSION
Because a great proportion of patients with cancer die from metastatic disease, it is important to develop effective treatments that eradicate primary tumors and control metastatic tumors. In the present study, SDT with HPD achieved superior anticancer efficacy in subcutaneous tumor models in mice after an increase in the number of repeat exposures and optimization of parameters. The results showed that SDT could activate the immune system, which contains acute innate and prolonged adaptive immune responses. SDT with HPD acts as an effective local therapy to inhibit primary tumor growth and elicit systemic antitumor immunity.
Based on the results, SDT can induce cell death by triggering apoptosis and stimulating the expression of CRT, a significant marker for ICD.19 CRT expression on the cell surface sends an ‘eat me’ signal to DC and macrophages, resulting in their activation and maturation,28, 29 and they then migrate to the lymph nodes where they convert naive T cells into effector T cells; finally, they migrate to the tumor microenvironment.30, 31 Promotion of CRT expression, validated by flow cytometry and CLSM, and successful protection against tumor challenge by SDT showed effective ICD induction as a result of the treatment.
Despite being localized, SDT exerts a systemic effect by promoting the secretion of cytokines, which activate the immune system to generate anticancer effects. We observed elevated expression of pro‐inflammatory cytokines, such as IFN‐γ and IL‐2, and decreased expression of the anti‐inflammatory cytokine IL‐10 in response to SDT, followed by a rapid restoration in cytokine levels. In addition, SDT promoted the expression of immune cell differentiation markers, as indicated by immunohistochemistry, in the primary tumor; the expressions of CD4, CD8, and CD68 were higher and the expressions of CD163, CD25, and FoxP3 were lower in the SDT group than in the other groups. At the same time, higher levels of CD4 and CD8 in distant tumor tissues were found in the SDT group. LDH release experiments showed that toxicity of CTL cells caused a specific response in H22 cells, but had no effect on S180, which showed that the immune response induced by SDT in mice is specific to H22 cells. SDT promotes cancer cell death through apoptosis and necrosis. DC and macrophages engulf stressed and necrotic tumor cells and present tumor‐derived antigenic peptides to T cells, thereby stimulating a tumor‐specific T‐cell response. We can thus speculate that lysates from apoptotic cancer cells generated after SDT can activate inflammatory and immunological responses. Thus, mature DC activate naive T cells in the tumor microenvironment to induce a systemic immune response. In addition, SDT can promote tumor‐related macrophages to shift from an M2 to an M1 phenotype to regulate immune responses. The progress of SDT exerting a systemic effect is shown in Figure 11.
Figure 11.
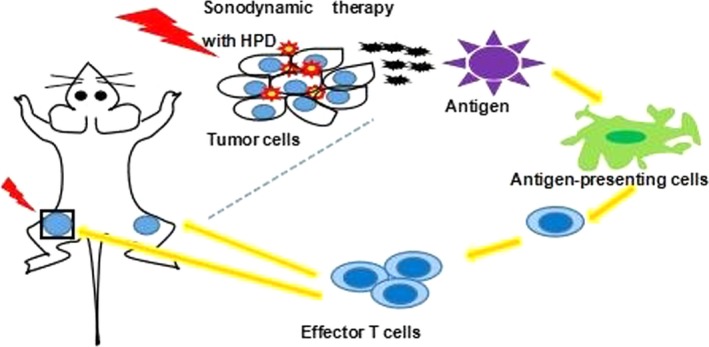
Sonodynamic therapy (SDT) with HiPorfin (HPD) induces systemic antitumor immunity. SDT with HPD induces immunogenic cell death and inflammation at the primary tumor site, leading to maturity and infiltration of dendritic cells and macrophages, which eventually elicit the proliferation of tumor‐specific effector T cells in the tumor microenvironment. Generation and infiltration of tumor‐specific effector T cells in primary and distant tumors, results in inhibition of the primary tumor, as well as systemic antitumor immune responses to reject distant tumors
Compared with previous studies of SDT,12, 32 our study identified 4 parameters (ie, photosensitizer concentration, ultrasound intensity, irradiation time and ultrasound frequency) using an orthogonal experimental method and optimization of them to maximize the therapeutic effect and to minimize side‐effects of SDT. Compared with the current application of SDT,33 we determined that increasing the number of SDT cycles can improve therapeutic efficacy. We speculate that repeated irradiation during SDT can result in the formation of immune memory in mice, which is the equivalent to vaccination. Compared with conventional studies of SDT, which have shown that SDT kills cancer cells through ROS generation and cavitation effects,34 we focused on an immune‐oriented mechanism of action for SDT that remained unclear until now. Nevertheless, demonstration of the effect of SDT is preliminary, thus the mechanism must be examined in detail, and the effect of SDT on DC in draining lymph nodes and the proportion of CD4+/CD8+ T cells in the blood should be further confirmed.
In summary, we propose that SDT can induce vaccine‐like immune responses that could be combined with immune adjuvants and immune checkpoint inhibitors to design a highly effective cancer immunotherapy. Moreover, we examined the antitumor effects of SDT in both subcutaneous tumor and artificially engineered metastatic tumor models. Although the immune‐oriented efficacy of SDT is not yet particularly robust, the results of the present study indicate the potential of SDT for generating effective cancer vaccines. In addition, the combination of SDT and immune adjuvant therapy may be promising as a systemic treatment modality, which may be able to eradicate primary and metastatic tumors and evoke immune memory to prevent tumor relapse. Furthermore, this treatment could be suitable not only for superficial cancers but also for deep‐seated tumors.
CONFLICTS OF INTEREST
Authors declare no conflicts of interest for this article.
ACKNOWLEDGMENTS
This work was supported by the Natural Science Foundation of Guangdong province (Grant number 2016A030313526).
Zhang Q, Bao C, Cai X, et al. Sonodynamic therapy‐assisted immunotherapy: A novel modality for cancer treatment. Cancer Sci. 2018;109:1330–1345. https://doi.org/10.1111/cas.13578
Funding information
Natural Science Foundation of Guangdong Province (Grant/Award Number: 2016A030313526).
REFERENCES
- 1. Wilson BC, Patterson MS. The physics, biophysics and technology of photodynamic therapy. Phys Med Biol. 2008;53:R61‐R109. [DOI] [PubMed] [Google Scholar]
- 2. Korbelik M, Stott B, Sun J. Photodynamic therapy‐generated vaccines: relevance of tumour cell death expression. Br J Cancer. 2007;97:1381‐1387. [DOI] [PMC free article] [PubMed] [Google Scholar]
- 3. Gollnick SO, Vaughan L, Henderson BW. Generation of effective antitumor vaccines using photodynamic therapy. Cancer Res. 2002;62:1604‐1608. [PubMed] [Google Scholar]
- 4. Zitvogel L, Kepp O, Kroemer G. Decoding cell death signals in inflammation and immunity. Cell. 2010;140:798‐805. [DOI] [PubMed] [Google Scholar]
- 5. Josefsen LB, Boyle RW. Photodynamic therapy and the development of metal‐based photosensitisers. Met‐Based Drugs. 2008;2008:1‐24. [DOI] [PMC free article] [PubMed] [Google Scholar]
- 6. Kuroki M, Hachimine K, Abe H, et al. Sonodynamic therapy of cancer using novel sonosensitizers. Anticancer Res. 2007;27:3673‐3678. [PubMed] [Google Scholar]
- 7. Rosenthal I, Sostaric JZ, Riesz P. Sonodynamic therapy––a review of the synergistic effects of drugs and ultrasound. Ultrason Sonochem. 2004;11:349‐363. [DOI] [PubMed] [Google Scholar]
- 8. Trendowski M. The promise of sonodynamic therapy. Cancer Metastasis Rev. 2014;33:143‐160. [DOI] [PubMed] [Google Scholar]
- 9. Barati AH, Mokhtari‐Dizaji M, Mozdarani H, Bathaie Z, Hassan ZM. Effect of exposure parameters on cavitation induced by low‐level dual‐frequency ultrasound. Ultrason Sonochem. 2007;14:783‐789. [DOI] [PubMed] [Google Scholar]
- 10. Barati AH, Mokhtari‐Dizaji M, Mozdarani H, Bathaie SZ, Hassan ZM. Treatment of murine tumors using dual‐frequency ultrasound in an experimental in vivo model. Ultrasound Med Biol. 2009;35:756‐763. [DOI] [PubMed] [Google Scholar]
- 11. Wang H, Liu Q, Zhang K, et al. Comparison between sonodynamic and photodynamic effect on MDA‐MB‐231 cells. J Photochem Photobiol, B. 2013;127:182‐191. [DOI] [PubMed] [Google Scholar]
- 12. Barati AH, Mokhtari‐Dizaji M. Ultrasonic dose fractionation in sonodynamic therapy. Ultrasound Med Biol. 2010;36:880‐887. [DOI] [PubMed] [Google Scholar]
- 13. Jia Y, Wang X, Liu Q, Leung AW, Wang P, Xu C. Sonodynamic action of hypocrellin B triggers cell apoptoisis of breast cancer cells involving caspase pathway. Ultrasonics. 2017;73:154‐161. [DOI] [PubMed] [Google Scholar]
- 14. Li Y, Zhou Q, Deng Z, et al. IR‐780 dye as a sonosensitizer for sonodynamic therapy of breast tumor. Sci Rep. 2016;6:1‐10. [DOI] [PMC free article] [PubMed] [Google Scholar]
- 15. Inui T, Makita K, Miura H, et al. Case report: a breast cancer patient treated with GcMAF, sonodynamic therapy and hormone therapy. Anticancer Res. 2014;34:4589‐4594. [PubMed] [Google Scholar]
- 16. Wang X, Zhang W, Xu Z, Luo Y, Mitchell D, Moss RW. Sonodynamic and photodynamic therapy in advanced breast carcinoma: a report of 3 cases. Integr Cancer Ther. 2009;8:283‐287. [DOI] [PubMed] [Google Scholar]
- 17. Gao Z, Zheng J, Yang B, et al. Sonodynamic therapy inhibits angiogenesis and tumor growth in a xenograft mouse model. Cancer Lett. 2013;335:93‐99. [DOI] [PubMed] [Google Scholar]
- 18. Raghavan M, Wijeyesakere SJ, Peters LR, Del Cid N. Calreticulin in the immune system: ins and outs. Trends Immunol. 2013;34:13‐21. [DOI] [PMC free article] [PubMed] [Google Scholar]
- 19. Obeid M, Tesniere A, Ghiringhelli F, et al. Calreticulin exposure dictates the immunogenicity of cancer cell death. Nat Med. 2007;13:54‐61. [DOI] [PubMed] [Google Scholar]
- 20. Kroemer G, Galluzzi L, Kepp O, Zitvogel L. Immunogenic cell death in cancer therapy. Annu Rev Immunol. 2013;31:51‐72. [DOI] [PubMed] [Google Scholar]
- 21. Nagata S, Hanayama R, Kawane K. Autoimmunity and the clearance of dead cells. Cell. 2010;140:619‐631. [DOI] [PubMed] [Google Scholar]
- 22. Kidd P. Th1/Th2 balance: the hypothesis, its limitations, and implications for health and disease. Altern Med Rev. 2003;8:223‐247. [PubMed] [Google Scholar]
- 23. Gómez D, Correa PA, Gómez LM, Cadena J, Molina JF, Anaya JM. Th1/Th2 cytokines in patients with systemic lupus erythematosus: is tumor necrosis factor a protective? Semin Arthritis Rheum. 2004;33:404‐413. [DOI] [PubMed] [Google Scholar]
- 24. Agaugué S, Carosella ED, Rouas‐Freiss N. Role of HLA‐G in tumor escape through expansion of myeloid‐derived suppressor cells and cytokinic balance in favor of Th2 versus Th1/Th17. Blood. 2011;117:7021‐7033. [DOI] [PubMed] [Google Scholar]
- 25. Sun L, Chen B, Jiang R, Li J, Wang B. Resveratrol inhibits lung cancer growth by suppressing M2‐like polarization of tumor associated macrophages. Cell Immunol. 2017;311:86‐93. [DOI] [PubMed] [Google Scholar]
- 26. Zhang WJ, Chen C, Zhou ZH, et al. Hypoxia‐inducible factor‐1 alpha correlates with tumor‐associated macrophages infiltration, influences survival of gastric cancer patients. J Cancer. 2017;8:1818‐1825. [DOI] [PMC free article] [PubMed] [Google Scholar]
- 27. Ou X, Cai S, Liu P, et al. Enhancement of dendritic cell‐tumor fusion vaccine potency by indoleamine‐pyrrole 2,3‐dioxygenase inhibitor, 1‐MT. J Cancer Res Clin Oncol. 2008;134:525‐533. [DOI] [PMC free article] [PubMed] [Google Scholar]
- 28. Tesniere A, Schlemmer F, Boige V, et al. Immunogenic death of colon cancer cells treated with oxaliplatin. Oncogene. 2010;29:482‐491. [DOI] [PubMed] [Google Scholar]
- 29. Panaretakis T, Kepp O, Brockmeier U, et al. Mechanisms of pre‐apoptotic calreticulin exposure in immunogenic cell death. EMBO J. 2009;28:578‐590. [DOI] [PMC free article] [PubMed] [Google Scholar]
- 30. Obeid M, Panaretakis T, Joza N, et al. Calreticulin exposure is required for the immunogenicity of c‐irradiation and UVC light‐induced apoptosis. Cell Death Differ. 2007;14:1848‐1850. [DOI] [PubMed] [Google Scholar]
- 31. Panaretakis T, Joza N, Modjtahedi N, et al. The co‐translocation of ERp57 and calreticulin determines the immunogenicity of cell death. Cell Death Differ. 2008;15:1499‐1509. [DOI] [PubMed] [Google Scholar]
- 32. Soltani A, Soliday C. Effect of ultrasound on enzymatic activity of selected plasminogen activators. Thromb Res. 2007;119:223‐228. [DOI] [PubMed] [Google Scholar]
- 33. Trendowski M, Yu G, Wong V, Acquafondata C, Christen T, Fondy TP. The real deal: using cytochalasin B in sonodynamic therapy to preferentially damage leukemia cells. Anticancer Res. 2014;34:2195‐2202. [PubMed] [Google Scholar]
- 34. Hiraoka W, Honda H, Feril LB Jr, Kudo N, Kondo T. Comparison between sonodynamic effect and photodynamic effect with photosensitizers on free radical formation and cell killing. Ultrason Sonochem. 2006;13:535‐542. [DOI] [PubMed] [Google Scholar]