

Abstract
To maintain iron homoeostasis, the iron regulatory hormone hepcidin is tightly controlled by BMP‐Smad signalling pathway, but the physiological role of Smad7 in hepcidin regulation remains elusive. We generated and characterized hepatocyte‐specific Smad7 knockout mice (Smad7 Alb/Alb), which showed decreased serum iron, tissue iron, haemoglobin concentration, up‐regulated hepcidin and increased phosphor‐Smad1/5/8 levels in both isolated primary hepatocytes and liver tissues. Increased levels of hepcidin lead to reduced expression of intestinal ferroportin and mild iron deficiency anaemia. Interestingly, we found no difference in hepcidin expression or phosphor‐Smad1/5/8 levels between iron‐challenged Smad7 Alb/Alb and Smad7 flox/flox, suggesting other factors assume the role of iron‐induced hepcidin regulation in Smad7 deletion. We performed RNA‐seq to identify differentially expressed genes in the liver. Significantly up‐regulated genes were then mapped to pathways, revealing TGF‐β signalling as one of the most relevant pathways, including the up‐regulated genes Smad6, Bambi and Fst (Follistatin). We found that Smad6 and Bambi—but not Follistatin—are controlled by the iron‐BMP–Smad pathway. Overexpressing Smad6, Bambi or Follistatin in cells significantly reduced hepcidin expression. Smad7 functions as a key regulator of iron homoeostasis by negatively controlling hepcidin expression, and Smad6 and Smad7 have non‐redundant roles. Smad6, Bambi and Follistatin serve as additional inhibitors of hepcidin in the liver.
Keywords: Bambi, follistatin, hepcidin, iron deficiency, Smad6, Smad7
1. INTRODUCTION
Maintaining iron homoeostasis is essential for maintaining normal cellular function. To avoid pathological iron overload and/or deficiency, iron levels are tightly regulated by the liver‐derived peptide hepcidin.1, 2 At the systemic level, hepcidin maintains iron homoeostasis by binding to and degrading the protein ferroportin, the sole exporter of cellular iron.3 Conversely, both circulating iron and tissue iron provide specific signals that modulate hepcidin expression.
Perturbations in hepcidin expression can lead to a variety of iron‐related disorders. For example, reduced hepcidin level causes iron overload in hereditary haemochromatosis (HH) and iron‐loading anaemia, which is induced by ineffective erythropoiesis.4 In HH types I, II and III, mutations either in the hepcidin‐encoding gene HAMP or in genes that encode hepcidin regulators can reduce the expression of hepcidin, thereby increasing duodenal iron absorption and causing clinical iron overload.5, 6, 7 In contrast, increased hepcidin expression causes iron restriction in a variety of inflammatory conditions, including autoimmune disease, critical illness, certain types of cancers and chronic kidney disease.8 Therefore, considerable effort has been devoted to developing agents that target hepcidin and/or its regulators in order to develop novel therapeutic strategies for treating iron‐related disorders.9 In addition, hepcidin and hepcidin agonists can exert a protective effect on the liver, heart and other vital organs by redistributing iron into macrophages in the liver and spleen. Thus, given the high therapeutic potential of hepcidin, understanding how hepcidin is regulated in vivo is essential.
In hepatocytes, hepcidin expression is regulated by the BMP‐Smad signalling pathway. Binding of BMP ligands (eg BMP6) to BMP receptors on the surface of hepatocytes triggers the downstream phosphorylation of Smad proteins.10, 11 Under dietary iron stimulation, hepatic BMP6 triggers the phosphorylation of Smad1/5/8, together with Smad4, to translocate to the nucleus, where they activates hepcidin expression.12 Therefore, both Bmp6‐deficient mice and mice with liver‐specific Smad4 deletion have reduced hepcidin expression and develop an severe iron‐overload phenotype.12, 13 Results obtained from studying patients with HH types I, II or III—together with their corresponding genetic mouse models—support the notion that defective BMP‐Smad signalling leads to hepcidin insufficiency.6, 7, 14, 15, 16, 17
Smad7 is a negative regulators of BMP‐Smad signalling, and the function of Smad7 protein in iron metabolism is poorly understood, although a growing body of in vitro evidence supports the notion that inhibitory Smads regulate hepcidin expression.18, 19 Based on a genomewide liver transcription profiling study, the expression of Smad7 was found to be up‐regulated by iron‐enriched diet.20 However, whether—and how—the Smad7 regulates dietary iron intake and hepcidin expression in the liver is currently unknown. Therefore, in this study, we generated and characterized a hepatocyte‐specific Smad7‐knockout mouse model to investigate the physiological role of Smad7 in regulating iron metabolism.
2. MATERIALS AND METHODS
2.1. Animals and treatments
Conditional Smad7‐floxed 21 mice were backcrossed with wild‐type C57BL/6 mice (SLRC Laboratory Animal Co., Ltd., Shanghai, China) for at least seven generations, then crossed with albumin‐Cre (Alb) transgenic mice (on a C57BL/6 background) to obtain hepatocyte‐specific Smad7‐knockout (Smad7 Alb/Alb) mice. The Smad7‐knockout mice used in this study were 8 week old of littermates. Hfe −/− mice were kindly provided by Dr. Nancy C. Andrews,22 and Smad4 Alb/Alb mice were kindly provided by Dr. Chu‐xia Deng.12 The Hfe −/− and Smad4 Alb/Alb mice were maintained on the 129/SvEvTac background, and 8‐week‐old mice were used in this study. All mice were housed under specific pathogen‐free conditions and fed a standard rodent diet (SLRC Laboratory Animal Co., Ltd, Shanghai, China) containing 232 mg/kg iron.23 The iron‐rich diet used for the iron‐challenged experiments was composed of standard diet containing 8.3 g/kg carbonyl iron. All animal protocols were approved by the Animal Studies Committee of Zhejiang University and the Institute for Nutritional Sciences, Shanghai Institutes for Biological Sciences, Chinese Academy of Sciences.
2.2. Measurement of haematological parameters, serum iron and tissue non‐haem iron
Whole blood (100 μL) was obtained by cardiac puncture and collected in a tube containing the anticoagulant ethylenediaminetetraacetic acid (EDTA). Haematological parameters were measured at the Xuhui District Central Hospital (Shanghai, China) using a Sysmex XS‐800i Automated Hematology Analyzer (Sysmex Corporation, Kobe, Japan). Serum iron (SI) and unsaturated iron‐binding capacity (UIBC) were measured using a commercially available colorimetry‐based detection kit (Pointe Scientific). Total iron‐binding capacity (TIBC) and transferrin saturation (TS) were calculated from SI and UIBC as follows: TIBC = SI + UIBC and TS = (SI/TIBC × 100). Tissue non‐haem iron concentration was measured as previously described.24
2.3. Ferroportin immunohistochemistry
Intestinal ferroportin detection using immunohistochemistry and Perls’ Prussian blue iron staining was performed as previously described.23
2.4. Isolation and culture of primary hepatocyte
Primary hepatocytes were isolated as previously described,25 cultured for 16 hours in Dulbecco's modified Eagle's medium (DMEM, Gibco) containing 10% foetal bovine serum (v/v), and then collected for experiments. Where indicated, the cells were cultured with human recombinant BMP6 (R&D Systems) and/or human holo‐Transferrin (Sigma‐Aldrich).
2.5. Plasmid generation and overexpression in cell lines
The open reading frames of the Smad6, Smad7, Bambi and Fst mRNAs (NCBI reference sequences NM_005585.4, NM_001042660.1, NM_012342.2 and NM_006350.3, respectively) were amplified from a cDNA library of the HepG2 cell line and inserted into the pCMV‐3tag‐3A vector (Stratagene). All constructs and their protein products were confirmed using DNA sequencing and Western blot analysis, respectively. Huh7 cells, a human hepatoma cell line, were plated in 12‐well plates and cultured at 37°C in 5% CO2 with 1 mL/well DMEM (Gibco) containing 15% (v/v) heat‐inactivated foetal bovine serum (Gibco). The cells were then transfected with the respective plasmid using X‐tremeGENE HP DNA transfection reagents (Roche). Where indicated, 36 hours after transfection, human recombinant BMP6 (R&D systems) was added to the wells to a final concentration of 10 ng/mL. After incubating for an additional 12 hours, the cells were collected for the following analyses.
2.6. Western blot analysis
Cultured cells were lysed using RIPA lysis buffer, and total protein (40 μg/sample) was loaded on a 10% sodium dodecyl sulphate polyacrylamide gel. The following primary antibodies were used in this study: rabbit anti‐L‐ferritin (Alpha Diagnostics International), rabbit anti‐phosphor–Smad1/5/8 (Cell Signaling Technology), rabbit anti‐Smad1 antibody (Cell Signaling Technology), rabbit anti‐phosphor–Stat3 (Cell Signaling Technology), rabbit anti‐Stat3 (Cell Signaling Technology) and mouse anti‐β‐actin (Sigma‐Aldrich).
2.7. RNA extraction and real‐time PCR analysis
RNA extraction and real‐time PCR analysis of gene expression were performed as previously described.26 Relative expression was normalized to internal control β‐actin. The primer sequences are listed in Table S1.
2.8. RNA‐seq data analysis
Eight‐week‐old female Smad7 flox/flox and Smad7 Alb/Alb mice were fed an iron‐rich diet for 3 days. Total RNA was then isolated from the livers (3 mice per genotype), and RNA sequencing libraries were generated using the TruSeq RNA Sample Preparation Kit (Illumina). The Illumina HiSeq 2000 platform was used with 100‐bp paired‐end reads in accordance with the manufacturer's instructions. RNA‐seq reads were mapped to the mouse reference genome (mm9, NCBI build 37) using TopHat.27 Only uniquely aligned reads were used for gene and exon quantification. The Cufflinks tool was used to quantify isoform expression.28 Genes that were significantly up‐regulated (q < 0.05) are listed in Table S2. These genes were then mapped to signalling pathways using the KEGG pathway mapping tool (http://www.genome.jp/kegg/tool/map_pathway1.html).
2.9. Statistical analysis
All summary data are presented as the mean ± SD. The Student's t test was used to compare two groups. For multiple group comparisons, we used an ANOVA followed by Tukey's post hoc test. If data did not meet the assumption of homogeneity of variance (Bartlett's test), log‐transformed values were used in ANOVA. Differences were considered significant if P < .05. Statistical analyses were performed using R (http://www.r-project.org).
3. RESULTS
3.1. Liver‐specific deletion of Smad7 caused increased hepcidin expression and iron deficiency
Smad7 interacts with the TGF‐β type I receptor via the MH2 domain, preventing phosphorylation of effector Smad proteins.29 To generate mice with hepatocyte‐specific Smad7 deletion, mice carrying the Smad7 conditional knockout allele (Smad7 flox/flox)21 were backcrossed with wild‐type C57BL/6 mice at least seven generations and then crossed with albumin‐Cre (Alb) transgenic mice, yielding Smad7 liver‐specific knockout mice in which the MH2 domain in exon 4 of Smad7 is deleted. Heterozygous hepatocyte‐specific knockout mice (Smad7 WT/Alb) were used to generate Smad7 flox/flox and Smad7 Alb/Alb mice. Primary hepatocytes were isolated from Smad7 Alb/Alb mouse livers and had a 98% reduction in Smad7 expression (Figure S1).
Compared with control mice, both male and female Smad7 Alb/Alb mice had reduced levels of non‐haem iron in the liver and spleen (Figure 1A‐C). Smad7 Alb/Alb mice also had reduced levels of ferritin‐L protein in the liver, indicating decreased iron stores (Figure 1D). Smad7 Alb/Alb mice showed no significant change in Bmp6 expression (Figure 1E). Moreover, no difference was observed with respect to the ratio of Bmp6 to liver non‐haem iron concentration (Bmp6/LIC ratio) (Figure S2) or Tmprss6 expression (Figure S3). Smad7 Alb/Alb mice had increased expression of hepcidin in the liver (Figure 1F) and an increased ratio of hepcidin to liver non‐haem iron concentration (hepcidin/LIC ratio) (Figure 1G). Consistently, Smad7 Alb/Alb mice had increased levels of phosphor‐Smad1/5/8 (pSmad1/5/8) in the liver (Figure 1H).
Figure 1.
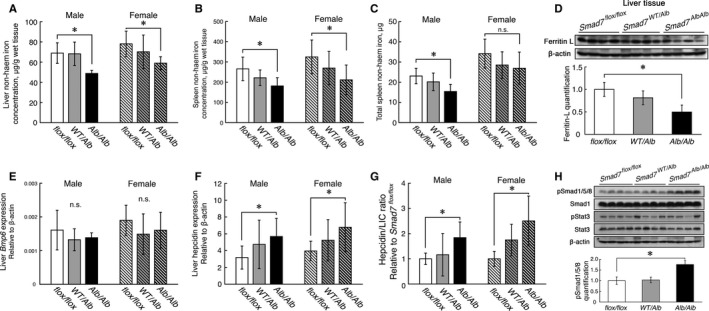
Hepatocyte‐specific Smad7‐knockout (Smad7 Alb/Alb) mice have increased liver hepcidin expression and develop an iron deficiency phenotype. Both male and female Smad7 Alb/Alb mice have A, decreased liver; B, spleen tissue non‐haem iron concentrations; and C, total spleen iron (mice number: male, Smad7 flox/flox=8, Smad7 WT /Alb=8, Smad7 Alb/Alb=7; female, Smad7 flox/flox=20, Smad7 WT /Alb=9, Smad7 Alb/Alb=9). D, Smad7 Alb/Alb mice have reduced levels of hepatic Ferritin‐L protein. E, Smad7 Alb/Alb mice have unchanged Bmp6 expression levels; F, increased levels of hepatic hepcidin (Hamp1) expression; and G, increased hepcidin expression/liver non‐haem iron concentration (hepcidin/LIC) ratio (mice number: male, Smad7 flox/flox=8, Smad7 WT /Alb=8, Smad7 Alb/Alb=7; female, Smad7 flox/flox=10, Smad7 WT /Alb=9, Smad7 Alb/Alb=9). H, Smad7 Alb/Alb mice have increased levels of hepatic phosphor‐Smad1/5/8. *P < .05 vs Smad7 flox/flox (ANOVA and Tukey's post hoc test; P‐values of hepcidin, Bmp6, hepcidin/LIC ratio were calculated from log‐transformed values)
Isolated hepatocytes from Smad7 Alb/Alb mice had significantly higher hepcidin expression and phosphor‐Smad1/5/8 levels (Figure 2A and B). Consistent with these results, Smad7 Alb/Alb mice had decreased levels of ferroportin in the intestine and spleen (Figure 2C and D, respectively); decreased ferroportin in the intestines of Smad7 Alb/Alb mice was confirmed using immunohistochemistry (Figure 2E). Perls’ Prussian blue staining indicates increased iron retention in the spleen (Figure 2F).
Figure 2.
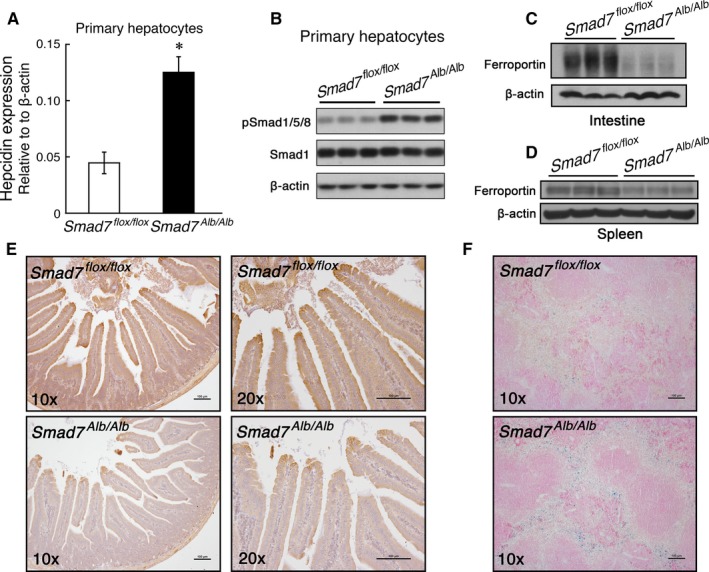
Smad7 Alb/Alb mice have increased hepcidin expression in primary hepatocytes and decreased ferroportin protein levels in the intestine and spleen. A, Hepcidin (Hamp1) mRNA and B, Phosphor‐Smad1/5/8 levels in primary hepatocytes isolated from Smad7 flox/flox and Smad7 Alb/Alb mice (n = 3 mice/group; *P < .05, Student's t test). C, Intestinal and D, Splenic ferroportin protein was measured in Smad7 flox/flox and Smad7 Alb/Alb mice using Western blot analysis. E, Immunohistochemistry of ferroportin in the intestine tissues of Smad7 flox/flox and Smad7 Alb/Alb mice. F, Perls’ Prussian blue staining indicates iron retention in the spleen tissue of Smad7 Alb/Alb mice
An analysis of serum samples revealed that Smad7 Alb/Alb mice have decreased serum iron (SI) and transferrin saturation (TS) levels (Table 1). Moreover, Smad7 Alb/Alb mice have an altered haematological profile, including decreased haemoglobin concentration, mean corpuscular volume (MCV), mean corpuscular haemoglobin (MCH) and mean corpuscular haemoglobin concentration (MCHC). Taken together, these serum and haematology results indicate that Smad7 Alb/Alb mice have mild iron deficiency anaemia. The serum and haematology data are summarized in Table 1.
Table 1.
Serum and haematological parameters of Smad7 flox/flox, Smad7 WT/Alb and Smad7 Alb/Alb mice
| Smad7 flox/flox | Smad7 WT/Alb | Smad7 Alb/Alb | ||||
|---|---|---|---|---|---|---|
| Mean ± SD | n | Mean ± SD | n | Mean ± SD | n | |
| Serum parameters | ||||||
| Serum iron, μg/dL | 106.34 ± 16.74 | 18 | 95.30 ± 19.36 | 7 | 76.86 ± 12.35a | 7 |
| UIBC, μg/dL | 223.86 ± 44.97 | 18 | 296.33 ± 49.90a | 7 | 302.18 ± 52.41a | 7 |
| TIBC, μg/dL | 330.21 ± 38.78 | 18 | 387.04 ± 46.45a | 7 | 379.04 ± 41.51a | 7 |
| TS, % | 32.70 ± 6.60 | 18 | 23.80 ± 5.32a | 7 | 20.72 ± 5.24a | 7 |
| Haematology | ||||||
| Haemoglobin, g/L | 133.67 ± 5.56 | 18 | 125.29 ± 4.72a | 7 | 122.29 ± 8.92a | 7 |
| RBC | 8.49 ± 0.43 | 18 | 8.30 ± 0.40 | 7 | 8.74 ± 1.16 | 7 |
| Haematocrit, % | 40.85 ± 2.41 | 18 | 39.96 ± 1.76 | 7 | 38.79 ± 3.45 | 7 |
| MCV, fL | 48.13 ± 1.24 | 18 | 48.14 ± 1.25 | 7 | 44.63 ± 2.76a | 7 |
| MCH, pg | 15.76 ± 0.48 | 18 | 15.10 ± 0.46a | 7 | 14.06 ± 0.62a | 7 |
| MCHC, g/L | 327.72 ± 12.47 | 18 | 313.71 ± 9.29a | 7 | 315.71 ± 10.40a | 7 |
MCH, mean corpuscular haemoglobin; MCHC, mean corpuscular haemoglobin concentration; MCV, mean corpuscular volume; TIBC, total iron‐binding capacity; TS, transferrin saturation; UIBC, unsaturated iron‐binding capacity.
P < .05, compared with Smad7 flox/flox mice; P‐values were calculated using ANOVA and Tukey's post hoc test.
3.2. Smad7Alb/Alb mice fed an iron‐rich diet had up‐regulated expressions of Smad6, Fst and Bambi
The expression of Smad7 has been linked to dietary iron.19, 20, 30 We thus have been suggested that feeding Smad7 Alb/Alb mice with an iron‐rich diet might induce a more robust phenotype. According to the report, the hepcidin level reached to its peak at the 3rd day of iron‐rich diet treatment.30 We therefore choose a 3‐day iron‐rich diet treatment for the following experiments.
Although iron‐challenged Smad7 Alb/Alb mice had considerably higher liver non‐haem iron concentrations compared with Smad7 Alb/Alb mice that were fed a normal diet, these mice still had a lower liver non‐haem iron concentration compared with iron‐challenged Smad7 flox/flox mice (Figure 3A). Interestingly, we found no difference in hepcidin expression, Id1 expression or phosphor‐Smad1/5/8 levels between iron‐challenged Smad7 flox/flox and iron‐challenged Smad7 Alb/Alb mice (Figure 3B‐E). With respect to hepcidin/LIC ratio, consuming an iron‐rich diet reduced the difference between Smad7 Alb/Alb and Smad7 Alb/Alb mice (Figure 3F). These data suggest other factors could compensate Smad7's function in repressing hepcidin expression.
Figure 3.
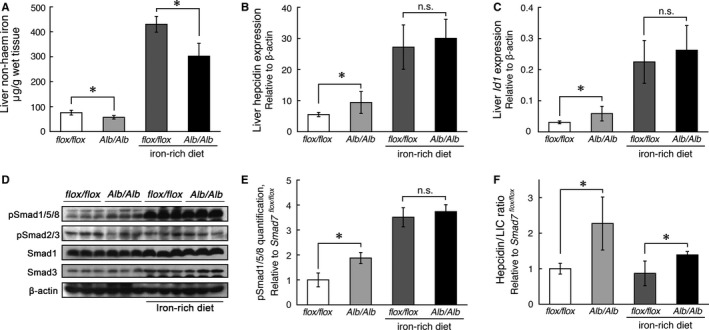
Hepcidin expression is similar between iron‐challenged Smad7 flox/flox and iron‐challenged Smad7 Alb/Alb mice. Smad7 flox/flox and Smad7 Alb/Alb mice were fed an iron‐rich diet for 3 days, after which A, liver non‐haem iron concentration; B, hepcidin; C, Id1; and D, phosphor‐Smad1/5/8 (pSmad1/5/8) and phosphor‐Smad2/3 (pSmad2/3) were measured. E, Quantification of hepatic phosphor‐Smad1/5/8 (pSmad1/5/8) using Western blot analysis. F, Summary of hepcidin expression/liver non‐haem iron concentration (hepcidin/LIC) ratio in Smad7 flox/flox and Smad7 Alb/Alb mice. *P < .05 vs the corresponding Smad7 flox/flox (ANOVA and Tukey's post hoc test). In A‐C and E‐F, n = 5‐6 female mice/group
To identify these potential factors, we performed RNA‐seq analysis and examined which genes were differentially expressed in the liver between Smad7 Alb/Alb mice and Smad7 flox/flox mice under iron‐rich dietary condition. A total of 52 genes were significantly up‐regulated in Smad7 Alb/Alb mice (q < 0.05) and were selected for further analysis; these 52 genes are listed in Table S2. The genes were mapped to signalling pathways using the KEGG pathway mapping, and the pathways with ≥5 hits are summarized in Table 2; all pathways with ≥3 hits are summarized in Table S3.
Table 2.
TGF‐β signalling pathway is one of the most hit pathways (hits ≥ 5) in all significantly up‐regulated genes in Smad7 Alb/Alb mice liver under iron‐rich diet
| Gene | Fold change | q value | Rank (by q value)a | |
|---|---|---|---|---|
| Metabolic pathways | ||||
| Pnpla3 | patatin‐like phospholipase domain containing 3 | 8.58 | <2.54E‐11 | 1/6484 |
| Mvd | mevalonate (diphospho) decarboxylase | 3 | 8.16E‐05 | 14/6484 |
| Gck | glucokinase | 2.65 | 8.49E‐04 | 20/6484 |
| Acsl3 | acyl‐CoA synthetase long‐chain family member 3 | 2.58 | 7.03E‐03 | 35/6484 |
| Itpk1 | inositol 1,3,4‐triphosphate 5/6 kinase | 3 | 7.35E‐03 | 36/6484 |
| Hmgcr | 3‐hydroxy‐3‐methylglutaryl‐Coenzyme A reductase | 2.41 | 0.03 | 47/6484 |
| TGF‐β signalling pathway | ||||
| Smad6 | SMAD family member 6 | 4.42 | 1.04E‐08 | 4/6484 |
| Bambi | BMP and activin membrane‐bound inhibitor | 4.09 | 1.13E‐06 | 7/6484 |
| Id4 | inhibitor of DNA binding 4 | 6.6 | 8.60E‐06 | 10/6484 |
| Fst | Follistatin | 3.17 | 1.00E‐03 | 21/6484 |
| Id2 | inhibitor of DNA binding 2 | 2.41 | 5.83E‐03 | 32/6484 |
| Longevity regulating pathway | ||||
| Hspa1b | heat‐shock protein 1B | 4.09 | 1.00E‐07 | 5/6484 |
| Foxa2 | forkhead box A2 | 2.38 | 4.39E‐03 | 30/6484 |
| Adcy1 | adenylate cyclase 1 | 5.38 | 4.63E‐04 | 19/6484 |
| Hspa1a | heat‐shock protein 1A | 3.21 | 0.02 | 45/6484 |
| Hspa2 | heat‐shock protein 2 | 2.46 | 0.02 | 46/6484 |
q values of differentially expressed genes in RNA sequencing were calculated by Cufflink. Full list of significantly up‐regulated genes (q value < 0.05) was summarized in Table S2. Full list of pathways with hits ≥ 3 genes was summarized in Table S3. Genes were mapped into pathways using KEGG pathway mapping.
in all up‐regulated genes.
Among the top‐rated pathways (Table 2), metabolic or longevity regulating pathways are not typical signal transduction pathways. Only the TGF‐β family members share similarities in both function and conservativeness across species. In addition, TGF‐beta family members are the most relevant molecules in regulating hepcidin. Particularly, the proteins encoded by the Smad6, Bambi and Fst genes are negative regulators of TGF‐β signalling. Bambi interacts with membrane BMP receptors to inhibit BMP signal transduction,31 and Smad6 inhibits the phosphorylation of Smad proteins. Fst encoding protein Follistatin binds to activin and BMPs, thereby blocking downstream signalling.32 Based on these functions, we investigated whether these proteins played a role in limiting iron‐induced hepcidin expression in the absence of Smad7.
3.3. Smad6, Bambi and Fst are differentially controlled by the iron‐BMP–Smad pathway
Because we found no detectable change in phosphor‐Smad2/3 levels (Figure 3D) or activin expression (Figure S4) in iron‐challenged Smad7 Alb/Alb mice, we tested whether the BMP6‐Smad1/5/8 pathway controls these putative negative regulators of hepcidin. Accordingly, we measured the mRNA levels of Smad6, Bambi and Fst in Hfe −/− and Smad7 Alb/Alb mice fed either a normal iron diet or an iron‐rich diet; we selected these two mouse lines because Hfe −/− mice have impaired BMP6‐Smad1/5/8 signalling, whereas Smad7 Alb/Alb mice have enhanced signalling.
We found decreased hepatic expression of Smad6 in Hfe −/− mice (Figure 4A) and increased hepatic expression of Smad6 in Smad7 Alb/Alb mice (Figure 4B). Moreover, Smad6 expression changed in response to an iron‐rich diet (Figure 4A and B) and BMP6 treatment (Figure 4C) in mice and primary hepatocytes, respectively. Similarly, Bambi expression decreased slightly in Hfe −/− mice but increased in iron‐challenged Smad7 Alb/Alb mice (Figure 4A and B). Bambi expression also increased in primary hepatocytes in response to 10 ng/mL BMP6 (Figure 4C), which indicates that Bambi is also regulated by the BMP6‐Smad1/5/8 pathway. In contrast, the expression of Fst (Follistatin) was not affected by either an iron‐rich diet or BMP6 treatment (Figure 4A‐C), with the exception of increased Fst expression in Smad7 Alb/Alb mice fed an iron‐rich diet (Figure 4B); this finding suggests that up‐regulation of Follistatin only occurs at Smad7‐deficient condition. Treating primary hepatocytes with holo‐Transferrin had no effect on Smad6, Bambi or Fst expressions (Figure 4D), and overexpressing Smad7 had no effect on Smad6, Bambi or Fst expressions either (Figure S5). These results indicate that only Smad6 and Bambi are regulated by the BMP6‐Smad1/5/8 pathway.
Figure 4.
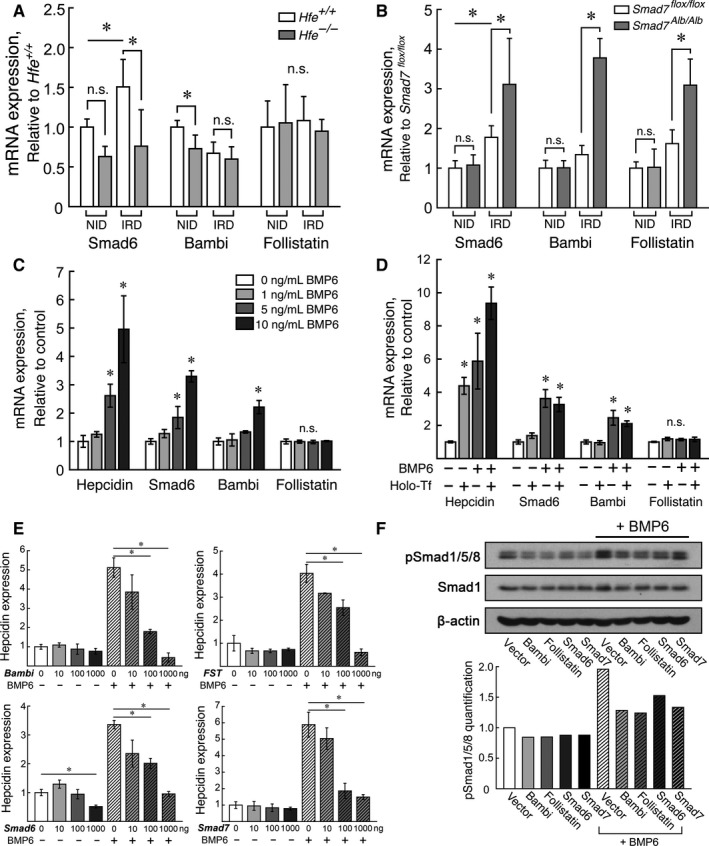
Smad6, Bambi and Follistatin are differentially controlled by the iron‐BMP–Smad pathway. Under either a normal iron diet (NID) or an iron‐rich diet (IRD), Smad6, Bambi and Fst (Follistatin) expressions were measured in A, male Hfe −/− mice and B, female Smad7 Alb/Alb mice; n = 5‐6 mice/group. C, The expressions of hepcidin, Smad6 and Bambi—but not Fst (Follistatin) —are up‐regulated in mouse primary hepatocytes after 10 ng/mL BMP6 treatment for 6 h (n = 3 replicates/group). D, Hepcidin, Smad6, Bambi and Fst (Follistatin) expressions were measured in primary hepatocytes treated with 10 ng/mL BMP6 and/or 50 μmol/L holo‐Transferrin for 12 h (n = 3 replicates/group). E‐F, Huh7 cells were transfected with 0, 10, 100 or 1000 ng of plasmid encoding Smad6, Smad7, Bambi or Follistatin; 36 h after transfection, the cells were incubated for 12 h in the absence or presence of 10 ng/mL BMP6, after which (E) hepcidin expression and (F) phosphor‐Smad1/5/8 (pSmad1/5/8) levels were measured. In (F), the cells were transfected with 1000 ng of the indicated plasmid. β‐actin was used as an internal control, and the results are presented relative to control vector‐transfected, untreated cells. *P < .05 (ANOVA and Tukey's post hoc test)
3.4. Overexpression of Smad6, Bambi or Fst decreases hepcidin expression
To further investigate whether Smad6, Bambi and/or Follistatin are negative regulators of hepcidin expression, we overexpressed Smad6, Smad7, Bambi and Follistatin in Huh7 cells. Forty‐eight hours after transfection, hepcidin mRNA and phosphor‐Smad1/5/8 levels were decreased compared with control‐transfected cells (Figure 4E and F). Moreover, overexpressing either Bambi or Follistatin abrogated BMP6‐induced hepcidin expression (Figure 4E). These findings suggest that under normal iron conditions, these inhibitory factors cannot fully replace the inhibitory function of Smad7; however, when the system is challenged by an iron‐rich diet, Bambi, Follistatin and Smad6 can assume the inhibitory role of Smad7 in regulating hepcidin expression (Figure 5).
Figure 5.
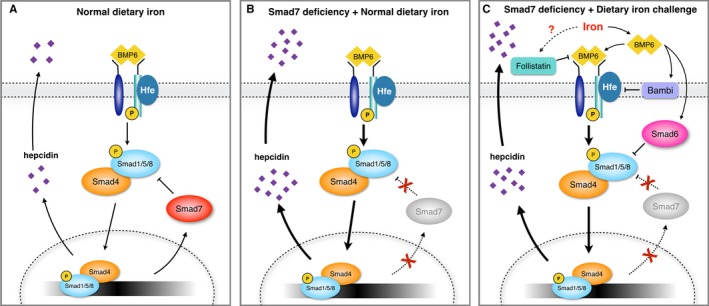
Proposed model describing the regulatory pathway between Smad7 and hepcidin expression in hepatocytes. A, Under normal conditions, hepcidin expression is regulated by BMP6 signalling via a complex comprised of Smad4 and phosphor‐Smad1/5/8. Smad7 inhibits hepcidin expression by targeting the Smad4‐phosphor‐Smad1/5/8 complex. B, Deletion of Smad7 in hepatocytes leads to increased hepcidin expression. C, During dietary iron overload, Smad6, Bambi and Follistatin assume the inhibitory function of Smad7, thereby functionally taking the place of Smad7 in inhibiting BMP‐Smad signalling
4. DISCUSSION
Hepcidin, a liver‐derived antimicrobial peptide, is a key regulator of iron homoeostasis and anaemia of inflammation. At the mechanistic level, intracellular iron sequestration is mediated by the hepcidin‐induced internalization and degradation of ferroportin, the only iron exporter identified to date.3 The hepcidin‐ferroportin axis is therefore a promising therapeutic target for treating many iron disorders, including haemochromatosis, β‐thalassaemia, anaemia of chronic disease and iron‐refractory iron deficiency anaemia.9
Hepcidin expression is tightly regulated by the BMP‐Smad signalling pathway. Although Smad7 has been suggested to regulate hepcidin expression based on in vitro studies, 18, 19 this function has not been investigated in vivo. In cell lines, overexpressing Smad7 reduced hepcidin expression.18 Thus, Smad7 may serve as a negative feedback regulator of hepcidin expression. Global Smad7‐knockout (Smad7 −/−) mice have reduced viability,21, 33 impaired cardiovascular development,21 exacerbated liver injury34 and altered immune cell responses.35 To investigate the physiological role of Smad7 in regulating both hepcidin expression and iron metabolism, we generated hepatocyte‐specific Smad7‐knockout (Smad7 Alb/Alb) mice. Consistent with a previous study by Zhu et al,36 a small subset of Smad7 Alb/Alb mice are slightly smaller in size compared with control mice. Zhu et al reported that 30% of Smad7 Alb/Alb mice displayed spontaneous liver dysfunction and increased serum levels of AST and ALT. However, we did not observe any liver damage as measured by serum AST and ALT (Figure S6). The difference between 2 studies could be attributed to several aspects. First, the genetic background differs. In our study, Smad7 Alb/Alb mice were backcrossed with C57BL/6 for at least 7 generations, whereas Zhu et al used a mixed background without any backcrossing. Second, the age of the mice differs. We used 8‐week‐old mice, whereas they used 10~12‐week‐old mice.
Both liver tissue and primary hepatocytes obtained from Smad7 Alb/Alb mice have increased hepcidin expression and increased phosphor‐Smad1/5/8 levels, which is consistent with increased phosphor‐Smad1/5/8 levels reported in other cell types obtained from Smad7 −/− mice.37 Increased hepcidin expression in Smad7 Alb/Alb mice leads to impaired iron metabolism, including decreased serum iron levels, decreased transferrin saturation and decreased tissue non‐haem iron concentration. Moreover, we found decreased levels of ferroportin protein in the intestine of Smad7 Alb/Alb mice, which suggests impaired absorption of dietary iron, thereby explaining the iron deficiency phenotypes present in Smad7 Alb/Alb mice. Interestingly, we also observed a slight reduction in total splenic ferroportin protein levels. Although reduced splenic ferroportin levels will cause iron retention in splenic macrophages (Figure 2F), splenic non‐haem iron concentration was still lower in the Smad7 Alb/Alb mice. Thus, we conclude that the slight reduction in splenic ferroportin cannot fully counteract the systemic iron deficiency in Smad7 Alb/Alb mice. Moreover, we measured reduced haematological parameters in both homozygous and heterozygous hepatocyte‐specific knockout mice. Heterozygotes (Smad7 WT/Alb) mice displayed significant reductions in TIBC, haemoglobin, MCH and MCHC compared with Smad7 flox/flox mice. However, tissue iron concentrations and hepatic hepcidin expression remain unchanged, which suggest that blood iron parameters are more sensitive to iron deficiency. Similarly, deleting Tmprss6, which encodes a serine protease that represses hepcidin expression, causes decreased liver non‐haem iron concentration and decreased mean corpuscular volume; however, Tmprss6 knockout mice developed a more severe phenotype than Smad7 Alb/Alb mice.38 In addition, a recent study suggested that Tmprss6 plays a key role in erythroferrone‐mediated hepcidin suppression.39 In contrast, hepatic expression of Tmprss6 remains unchanged in our Smad7 Alb/Alb mice (Figure S3). Taken together, these data indicate that Smad7 together with other hepcidin‐negative regulators plays an essential role in maintaining iron homoeostasis.
Smad7 expression is up‐regulated in mice fed an iron‐rich diet and down‐regulated in mice fed an iron‐deficient diet.20 Given its role as a negative regulator of hepcidin, we have been suggested that deleting Smad7 would increase hepcidin's response to dietary iron. Interestingly, however, we found no difference in hepcidin up‐regulation between Smad7 Alb/Alb and Smad7 flox/flox mice after 3 days on an iron‐rich diet; phosphor‐Smad1/5/8 and phosphor‐Smad2/3 levels were not affected, either. On the other hand, our RNA‐seq analysis revealed that Smad6, Bambi and Follistatin are inhibitory factors of the TGF‐β signalling pathway.
Our finding indicates that deleting either Hfe or Smad4 significantly reduced Smad6 expression and abolished the iron‐induced increase in Smad6 expression (Figure 4A and Figure S7), which supports the notion that Smad6 is a downstream target of BMP‐Smad signalling. In addition, we found that Smad6 expression was unchanged in Smad7 Alb/Alb mice compared with wild‐type mice, which indicates that Smad6 cannot fully replace the role of Smad7 in the BMP‐Smad–hepcidin axis, even though both Smad6 and Smad7 are well‐characterized inhibitory Smads. This notion is supported by the non‐overlapping phenotypes between Smad7‐knockout mice and Smad6‐knockout mice.21 Our in vivo data therefore suggest that inhibitory Smads have non‐redundant functions.
The bone morphogenetic protein Bambi exerts its inhibitory effect by interacting with TGF‐β type I receptors (including BMP receptors), thereby preventing the formation of the receptor complex and downstream phosphorylation of Smad proteins.31 We found that overexpressing Bambi inhibited Smad1/5/8 phosphorylation and reduces hepcidin expression. The promotor in the Bambi gene contains a BMP‐responsive element,40 and 10 ng/mL BMP6 significantly up‐regulated Bambi expression. In contrast, although iron is believed to up‐regulate hepatic Bmp6 expression, we found no change in Bambi expression in response to an iron‐rich diet in our mouse models. This discrepancy may be explained by the different conditions used; dietary iron causes a relatively mild (2.5‐fold) increase in BMP6, whereas treating cultured hepatocytes with 10 ng/mL BMP6 represents a 20‐fold increase in BMP6 concentration.41
Follistatin can bind directly to BMPs, thereby inhibiting a variety of functions.32 Unlike Bambi, Follistatin expression did not respond to BMP6 treatment in primary hepatocytes. Therefore, up‐regulation of Follistatin expression requires additional, currently unknown physiological changes induced in the liver by dietary iron. One possible candidate is Nrf2, a transcription factor that is activated during oxidative stress and can direct bind to the Fst promoter to drive Follistatin expression.42 Iron deposition can induce oxidative stress and the nuclear translocation of Nrf2.43 It is therefore possible that the combined effects of deleting Smad7 and activating Nrf2 lead to Follistatin expression, which may also explain the slight increase in hepatic Follistatin levels in Smad4 Alb/Alb mice. Smad4 mediates the transcription of Smad7, and deleting Smad4 reduces Smad7 expression.44, 45 Thus, the increased levels of hepatic Follistatin in Smad4 Alb/Alb mice may have been caused by the combination of high iron deposition and reduced Smad7 expression.
Our data suggest that Smad6, Bambi and Follistatin collectively form a negative feedback circuit to suppress hepcidin expression via BMP‐Smad1/5/8 phosphorylation. Consistent with this notion, overexpressing Smad6, Bambi or Follistatin in Huh7 cells suppressed hepcidin expression, even in the presence of BMP6. However, Smad6, Bambi and Follistatin exert their inhibitory effects in different cellular compartments—Follistatin inhibits extracellular BMP ligand activity, Bambi inhibits the BMP receptor at the cell membrane, and Smad6 inhibits the phosphorylation of intracellular Smad proteins (see Figure 5).
In conclusion, we report that hepatic Smad7 plays an essential role in maintaining iron homoeostasis by negatively regulating the expression of hepcidin under basal (ie, normal dietary iron) conditions. When Smad7 is absent, Smad6, Bambi and Follistatin can take over the role of regulating hepcidin induction during high iron conditions by inhibiting BMP‐Smad1/5/8 signalling. The identification of Smad6, Bambi and Follistatin as novel‐negative regulators of hepcidin expression may have clinical implications regarding the treatment of iron‐related disorders.
CONFLICT OF INTEREST
The authors confirm that there are no conflict of interests.
AUTHOR CONTRIBUTIONS
FW and JM designed the study. YC provided mice with Smad7 conditional allele. PA, HW, QW, JW, ZX, XW and XH performed the animal experiments. HW, PA, QW, XW and XH performed cell experiments. PA, HW and ZX performed data analyses. PA, HW, JM and FW drafted the manuscript.
Supporting information
ACKNOWLEDGEMENTS
We would like to thank Dr. Nancy C. Andrews for providing the Hfe −/− mice and Dr. Chu‐Xia Deng for providing the Smad4 Alb/Alb mice. This work was supported by the research grants from The National Natural Science Foundation of China (31330036 and 31530034 to F.W.; 31570791 and 91542205 to J.M.; 31500960 to P.A.; 31701035 to H.W.; 31501181 to Z.X.), Zhejiang Provincial Natural Science Foundation (LZ15H160002 to J.M.; LQ15C110002 to X.W.) and the Fundamental Research Funds for the Central Universities (2017QNA7019 to X.W.).
An P, Wang H, Wu Q, et al. Smad7 deficiency decreases iron and haemoglobin through hepcidin up‐regulation by multilayer compensatory mechanisms. J Cell Mol Med. 2018;22:3035–3044. https://doi.org/10.1111/jcmm.13546
Peng An and Hao Wang contributed equally to this study
Contributor Information
Junxia Min, Email: junxiamin@zju.edu.cn.
Fudi Wang, Email: fudiwang.lab@gmail.com, Email: fwang@zju.edu.cn.
REFERENCES
- 1. Park CH, Valore EV, Waring AJ, et al. Hepcidin, a urinary antimicrobial peptide synthesized in the liver. J Biol Chem. 2001;276:7806‐7810. [DOI] [PubMed] [Google Scholar]
- 2. Krause A, Neitz S, Mägert HJ, et al. LEAP‐1, a novel highly disulfide‐bonded human peptide, exhibits antimicrobial activity. FEBS Lett. 2000;480:147‐150. [DOI] [PubMed] [Google Scholar]
- 3. Nemeth E, Tuttle MS, Powelson J, et al. Hepcidin regulates cellular iron efflux by binding to ferroportin and inducing its internalization. Science. 2004;306:2090‐2093. [DOI] [PubMed] [Google Scholar]
- 4. Fleming RER, Ponka PP. Iron overload in human disease. N Engl J Med. 2012;366:348‐359. [DOI] [PubMed] [Google Scholar]
- 5. Bridle KR, Frazer DM, Wilkins SJ, et al. Disrupted hepcidin regulation in HFE‐associated haemochromatosis and the liver as a regulator of body iron homoeostasis. Lancet. 2003;361:669‐673. [DOI] [PubMed] [Google Scholar]
- 6. Niederkofler V, Salie R, Arber S. Hemojuvelin is essential for dietary iron sensing, and its mutation leads to severe iron overload. J Clin Invest. 2005;115:2180‐2186. [DOI] [PMC free article] [PubMed] [Google Scholar]
- 7. Nemeth E, Roetto A, Garozzo G, et al. Hepcidin is decreased in TFR2 hemochromatosis. Blood. 2005;105:1803‐1806. [DOI] [PubMed] [Google Scholar]
- 8. Ruchala P, Nemeth E. The pathophysiology and pharmacology of hepcidin. Trends Pharmacol Sci. 2014;35:155‐161. [DOI] [PMC free article] [PubMed] [Google Scholar]
- 9. Ganz T, Nemeth E. The hepcidin‐ferroportin system as a therapeutic target in anemias and iron overload disorders. Hematology Am Soc Hematol Educ Program. 2011;2011:538‐542. [DOI] [PMC free article] [PubMed] [Google Scholar]
- 10. Andriopoulos B Jr, Corradini E, Xia Y, et al. BMP6 is a key endogenous regulator of hepcidin expression and iron metabolism. Nat Genet. 2009;41:482‐487. [DOI] [PMC free article] [PubMed] [Google Scholar]
- 11. Meynard D, Kautz L, Darnaud V, et al. Lack of the bone morphogenetic protein BMP6 induces massive iron overload. Nat Genet. 2009;41:478‐481. [DOI] [PubMed] [Google Scholar]
- 12. Wang R‐H, Li C, Xu X, et al. A role of SMAD4 in iron metabolism through the positive regulation of hepcidin expression. Cell Metab. 2005;2:399‐409. [DOI] [PubMed] [Google Scholar]
- 13. Steinbicker AU, Bartnikas TB, Lohmeyer LK, et al. Perturbation of hepcidin expression by BMP type I receptor deletion induces iron overload in mice. Blood. 2011;118:4224‐4230. [DOI] [PMC free article] [PubMed] [Google Scholar]
- 14. Zhou XY, Tomatsu S, Fleming RE, et al. HFE gene knockout produces mouse model of hereditary hemochromatosis. Proc Natl Acad Sci USA. 1998;95:2492‐2497. [DOI] [PMC free article] [PubMed] [Google Scholar]
- 15. Huang FW, Pinkus JL, Pinkus GS, et al. A mouse model of juvenile hemochromatosis. J Clin Invest. 2005;115:2187‐2191. [DOI] [PMC free article] [PubMed] [Google Scholar]
- 16. Ahmad KA, Ahmann JR, Migas MC, et al. Decreased liver hepcidin expression in the Hfe knockout mouse. Blood Cells Mol Dis. 2002;29:361‐366. [DOI] [PubMed] [Google Scholar]
- 17. Kawabata H, Fleming RE, Gui D, et al. Expression of hepcidin is down‐regulated in TfR2 mutant mice manifesting a phenotype of hereditary hemochromatosis. Blood. 2005;105:376‐381. [DOI] [PubMed] [Google Scholar]
- 18. Mleczko‐Sanecka K, Casanovas G, Ragab A, et al. SMAD7 controls iron metabolism as a potent inhibitor of hepcidin expression. Blood. 2010;115:2657‐2665. [DOI] [PubMed] [Google Scholar]
- 19. Vujić Spasić M, Sparla R, Mleczko‐Sanecka K, et al. Smad6 and Smad7 are co‐regulated with hepcidin in mouse models of iron overload. Biochim Biophys Acta. 2013;1832:76‐84. [DOI] [PMC free article] [PubMed] [Google Scholar]
- 20. Kautz L, Meynard D, Monnier A, et al. Iron regulates phosphorylation of Smad1/5/8 and gene expression of Bmp6, Smad 7, Id1, and Atoh8 in the mouse liver. Blood. 2008;112:1503‐1509. [DOI] [PubMed] [Google Scholar]
- 21. Chen Q, Chen H, Zheng D, et al. Smad7 is required for the development and function of the heart. J Biol Chem. 2009;284:292‐300. [DOI] [PMC free article] [PubMed] [Google Scholar]
- 22. Finberg KE, Whittlesey RL, Andrews NC. Tmprss6 is a genetic modifier of the Hfe‐hemochromatosis phenotype in mice. Blood. 2011;117:4590‐4599. [DOI] [PMC free article] [PubMed] [Google Scholar]
- 23. Zhang Z, Zhang F, An P, et al. Ferroportin1 deficiency in mouse macrophages impairs iron homeostasis and inflammatory responses. Blood. 2011;118:1912‐1922. [DOI] [PubMed] [Google Scholar]
- 24. Zhang F, Tao Y, Zhang Z, et al. Metalloreductase Steap3 coordinates the regulation of iron homeostasis and inflammatory responses. Haematologica. 2012;97:1826‐1835. [DOI] [PMC free article] [PubMed] [Google Scholar]
- 25. Wang Q, Jiang L, Wang J, et al. Abrogation of hepatic ATP‐citrate lyase protects against fatty liver and ameliorates hyperglycemia in leptin receptor‐deficient mice. Hepatology. 2008;49:1166‐1175. [DOI] [PubMed] [Google Scholar]
- 26. Zhang Z, Zhang F, Guo X, et al. Ferroportin1 in hepatocytes and macrophages is required for the efficient mobilization of body iron stores in mice. Hepatology. 2012;56:961‐971. [DOI] [PubMed] [Google Scholar]
- 27. Trapnell C, Pachter L, Salzberg SL. TopHat: discovering splice junctions with RNA‐Seq. Bioinformatics. 2009;25:1105‐1111. [DOI] [PMC free article] [PubMed] [Google Scholar]
- 28. Trapnell C, Roberts A, Goff L, et al. Differential gene and transcript expression analysis of RNA‐seq experiments with TopHat and Cufflinks. Nat Protoc. 2012;7:562‐578. [DOI] [PMC free article] [PubMed] [Google Scholar]
- 29. Derynck R, Zhang YE. Smad‐dependent and Smad‐independent pathways in TGF‐beta family signalling. Nature. 2003;425:577‐584. [DOI] [PubMed] [Google Scholar]
- 30. Corradini E, Meynard D, Wu Q, et al. Serum and liver iron differently regulate the bone morphogenetic protein 6 (BMP6)‐SMAD signaling pathway in mice. Hepatology. 2011;54:273‐284. [DOI] [PMC free article] [PubMed] [Google Scholar]
- 31. Onichtchouk D, Chen YG, Dosch R, et al. Silencing of TGF‐beta signalling by the pseudoreceptor BAMBI. Nature. 1999;401:480‐485. [DOI] [PubMed] [Google Scholar]
- 32. Iemura S, Yamamoto TS, Takagi C, et al. Direct binding of follistatin to a complex of bone‐morphogenetic protein and its receptor inhibits ventral and epidermal cell fates in early Xenopus embryo. Proc Natl Acad Sci USA. 1998;95:9337‐9342. [DOI] [PMC free article] [PubMed] [Google Scholar]
- 33. Tojo M, Takebe A, Takahashi S, et al. Smad7‐deficient mice show growth retardation with reduced viability. J Biochem. 2012;151:621‐631. [DOI] [PubMed] [Google Scholar]
- 34. Hamzavi J, Ehnert S, Godoy P, et al. Disruption of the Smad7 gene enhances CCI4‐dependent liver damage and fibrogenesis in mice. J Cell Mol Med. 2008;12:2130‐2144. [DOI] [PMC free article] [PubMed] [Google Scholar]
- 35. Li RG, Rosendahl A, Brodin G, et al. Deletion of exon I of SMAD7 in mice results in altered B cell responses. J Immunol. 2006;176:6777‐6784. [DOI] [PubMed] [Google Scholar]
- 36. Zhu L, Wang L, Wang X, et al. Hepatic deletion of Smad7 in mouse leads to spontaneous liver dysfunction and aggravates alcoholic liver injury. PLoS ONE. 2011;6:e17415. [DOI] [PMC free article] [PubMed] [Google Scholar]
- 37. Estrada KD, Wang W, Retting KN, et al. Smad7 regulates terminal maturation of chondrocytes in the growth plate. Dev Biol. 2013;382:375‐384. [DOI] [PMC free article] [PubMed] [Google Scholar]
- 38. Finberg KE, Whittlesey RL, Fleming MD, et al. Down‐regulation of Bmp/Smad signaling by Tmprss6 is required for maintenance of systemic iron homeostasis. Blood. 2010;115:3817‐3826. [DOI] [PMC free article] [PubMed] [Google Scholar]
- 39. Nai A, Rubio A, Campanella A, et al. Limiting hepatic Bmp‐Smad signaling by matriptase‐2 is required for erythropoietin‐mediated hepcidin suppression in mice. Blood. 2016;127:2327‐2336. [DOI] [PMC free article] [PubMed] [Google Scholar]
- 40. Karaulanov E, Knochel W, Niehrs C. Transcriptional regulation of BMP4 synexpression in transgenic Xenopus. EMBO J. 2004;23:844‐856. [DOI] [PMC free article] [PubMed] [Google Scholar]
- 41. Herrera B, Inman GJ. A rapid and sensitive bioassay for the simultaneous measurement of multiple bone morphogenetic proteins. Identification and quantification of BMP4, BMP6 and BMP9 in bovine and human serum. BMC Cell Biol. 2009;10:20. [DOI] [PMC free article] [PubMed] [Google Scholar]
- 42. Lin C, Zhao X, Sun D, et al. Transcriptional activation of follistatin by Nrf2 protects pulmonary epithelial cells against silica nanoparticle‐induced oxidative stress. Sci Rep. 2015;6:21133. [DOI] [PMC free article] [PubMed] [Google Scholar]
- 43. Silva‐Gomes S, Santos AG, Caldas C, et al. Transcription factor NRF2 protects mice against dietary iron‐induced liver injury by preventing hepatocytic cell death. J Hepatol. 2014;60:354‐361. [DOI] [PubMed] [Google Scholar]
- 44. Nagarajan RP, Zhang J, Li W, et al. Regulation of Smad7 promoter by direct association with Smad3 and Smad4. J Biol Chem. 1999;274:33412‐33418. [DOI] [PubMed] [Google Scholar]
- 45. von Gersdorff G, Susztak K, Rezvani F, et al. Smad3 and Smad4 mediate transcriptional activation of the human Smad7 promoter by transforming growth factor beta. J Biol Chem. 2000;275:11320‐11326. [DOI] [PubMed] [Google Scholar]
Associated Data
This section collects any data citations, data availability statements, or supplementary materials included in this article.
Supplementary Materials