

Abstract
Nivolumab belongs to the standard therapy in the second‐line setting of metastatic renal cell carcinoma (mRCC). Although deep and long‐lasting responses are seen in some patients, the majority of patients will further progress. PD‐L1 is still under critical evaluation as a predictive biomarker. Thus, more accurate biomarkers are clearly warranted. Here, we investigated for the first time the predictive role of IDO‐1, a negative immune‐regulatory molecule, on clear cell RCC tissues of 15 patients undergoing nivolumab therapy. IDO‐1 and other immune inhibitory molecules (PD‐L1, PD‐L2, FOXP3) as well as immune cell subsets (CD3, CD4 and CD8) were measured on formalin‐fixed, paraffin‐embedded sections of RCC specimens by immunohistochemistry. IDO‐1 was predominantly expressed in tumor endothelial cells, and was totally absent from tumor cells itself. IDO‐1 overexpression (>10%) could be detected more frequently in responders (100%, n = 6/6) compared to non‐responders (33.3%, n = 3/9; P = .028), resulting in a better progression‐free survival during immunotherapy (IDO‐1 ≤ 10% vs >10%, median: 3.5 vs not estimated (NE) months, P = .01 by log‐rank test). In addition, IDO‐1 was positively correlated with CD8+ T cell expression (r s = .691, P = .006). PD‐L1 expression on tumor cells was negative in 13 (86.7%) of 15 patients, irrespective of therapeutic response (responders vs non‐responders: 83.3% vs 88.9%). No differences were noticed in the PD‐L1 expression on tumor‐infiltrating immune cells (PD‐L1 < 1% in 66.7% of both responders and non‐responders). In contrast to PD‐L1, these results suggest that IDO‐1 may be a more promising predictive biomarker for response to immune‐based cancer therapy in mRCC.
Keywords: biomarker, IDO, immunotherapy, nivolumab, renal cell carcinoma
1. INTRODUCTION
Renal cell carcinoma (RCC) is the 9th most common cancer worldwide, with approximately 63 990 new cases in the USA in 2017.1 In the past decade the management of metastatic RCC (mRCC) has changed dramatically. While in the local stage nephron‐sparing surgery or nephrectomy remains the standard curative therapeutic option,2, 3 in the metastatic disease several agents of the family of vascular endothelial growth factor (VEGF)‐targeted tyrosine kinase inhibitors (TKI) have revolutionized the daily treatment arsenal for more than 10 years now.4, 5 However, complete responses are rarely seen (less than 1%) and, unfortunately, the majority of patients with initial response will experience disease progression4, 6 due to adaptive or intrinsic resistance mechanisms as described in various preclinical models.7, 8 Thus, potential predictive biomarkers are urgently needed to identify patients who will benefit most from certain antiangiogenic agents, but only a few clinical trials have investigated a comprehensive biomarker panel.9
Presently, the field of immuno‐oncology is dramatically changing the landscape of malignant diseases and immunotherapy has become a mainstay of cancer therapy.10 Of those, immune checkpoint inhibitors, including PD‐(L)1 and CTLA‐4 blockers, yielded the most promising approach for activating therapeutic antitumor immunity so far.11 In the Checkmate 025 phase III trial, for example, the anti‐PD1 antibody nivolumab showed a prolongation of the overall survival (OS) for approximately 5 months compared to everolimus in patients with previously treated advanced RCC (25.0 vs 19.6 months, HR 0.73). The objective response rate (ORR) was also significantly higher in patients receiving nivolumab than everolimus (25% vs 5%, P < .001).12 Despite these very encouraging data, most patients will not benefit from those therapies and PD‐L1 expression at present is not a clear‐cut exclusionary predictive biomarker as some patients with low PD‐L1 expression also demonstrated robust responses.13, 14 In various cancer entities, such as melanoma or urothelial carcinoma, expression of immune inhibitory molecules, such as PD‐L1, IDO‐1, FOXP3, TIM3 and LAG3, has been positively linked with a CD8+ T cell tumor microenvironment, reflecting negative feedback pathways that limit ongoing T cell activation.15, 16 This fact means that upregulation of these immunosuppressive pathways is intrinsically induced by the immune system itself as a component of adaptive immune resistance rather than being an oncogenic driver of the tumor, resulting in an IFNγ‐mediated and inflammation‐driven expression of immunosuppressive molecules.11, 13, 15, 17 Thus, a better understanding of the dynamic interactions between both the tumor microenvironment and the host immune system is necessary for the development of more efficient and targeted biomarkers in this field.13 Several in vivo and in vitro studies as well as clinical trials indicate that targeting and blocking more than one negative immune‐regulatory mechanism may mediate better therapeutic effects by reducing the suppressive activity of T regulatory cells (Treg) and restoring the activity of effector T cells.15, 18
Indoleamine 2,3‐dioxygenase 1 (IDO‐1) belongs to those negative immune‐regulatory molecules that catalyzes tryptophan to kynurenine, which ends in the differentiation of naïve T cells into an expansion, activation and recruitment of Tregs and myeloid‐derived suppressor cells (MDSC) that further suppress anti‐tumor T cells.19, 20 In advanced RCC, the therapeutic efficacy, safety and tolerability of the combination of IDO‐1 inhibitors (epacadostat) with checkpoint inhibitors (pembrolizumab) has been tested in a phase I/II study (ECHO‐202/KEYNOTE‐037) with promising preliminary results (NCT02178722) presented at the 2017 ASCO annual meeting.
The aim of the present pilot study was to investigate and to define, for the first time, the role of IDO‐1 expression as a novel target in predicting response to immunotherapy in metastatic clear cell RCC.
2. MATERIAL AND METHODS
2.1. Patient characteristics and study design
After approval by the local ethics committee of the Medical University of Innsbruck (study number AN2017‐0026; 370/4.4), medical records from patients with advanced clear cell RCC who progressed after previous VEGF tyrosine‐kinase treatment (sunitinib or pazopanib) and received immunotherapy (nivolumab 3 mg/kg of body weight intravenously every 2 weeks) in the second‐line setting were reviewed between July 2016 and June 2017. All included patients underwent cytoreductive nephrectomy (in case of primary metastatic RCC), nephron‐sparing surgery or radical nephrectomy (for localized RCC initially), and, thus, primary RCC specimens were homogeneously available for immunohistochemical staining.
Disease assessments were performed by computed tomography (Sensation 64 Cardiac and Definition Flash, Siemens Healthcare, Erlangen, Germany) or magnetic resonance imaging (3 T Magnetom Skyra, Siemens Healthcare, Erlangen, Germany) at baseline, and then every 12 weeks (after 7 cycles of nivolumab) as an institutional practice. Imaging data were evaluated according to RECIST version 1.1 (complete response, partial response, stable disease or progressive disease) by 2 experienced uroradiologists (FS and FA). Patients with a clinical benefit (no symptoms, no immune‐associated adverse events, no worsening of patient condition) and initial radiographic disease progression at 12 weeks continued therapy (treatment beyond progression) as already described previously,21 with a short‐term imaging 6 weeks later (after cycle 10 of nivolumab) to define definitive progressive disease. Response to nivolumab was defined as complete response, partial response or stable disease from the time of immunotherapy start to objectively documented disease progression or subsequent therapy, whichever occurred first.
2.2. Tumor samples and regions
Tumor specimens, including primary tumors and selected metastases, if available, were obtained from the archives of the Department of Pathology, Division of General Pathology, Medical University of Innsbruck and were reviewed for diagnosis, tumor grade according to Fuhrmann and stage (TNM 2017) by 2 pathologists with long‐standing experience in uropathology (AB and BZ). One representative tumor block of every case was selected for further immunohistochemical analyses. Our study cohort included only clear cell RCC specimens. Consecutive slides were used to allow the comparison of the same field of view in any given case.
2.3. Performance of Immunohistochemistry
For immunohistochemistry (IHC), a panel of 8 primary antibodies was used for subtyping the tumor and/or the inflammatory infiltrate within the tumor microenvironment. T cells were labeled using an anti‐CD3 antibody (Clone 2GV6, prediluted; Ventana Medical Systems, Tuscon, USA). T helper cells (Th) were assessed with an anti‐CD4 antibody (Clone SP35, prediluted; Ventana Medical Systems, Tuscon, USA). Cytotoxic T cells were labeled by anti‐CD8 antibody (Clone C8/144B, dilution 1:50; Agilent/Dako, Santa Clara, USA). In addition, regulatory T cells (Tregs) were detected with an anti‐FOXP3 antibody (Clone 236A/E7, dilution 1:100; Abcam). Expression of immune checkpoint molecules was assessed using monoclonal antibodies against PD1 (Clone NAT105, prediluted; Ventana Medical Systems, Tuscon, USA), PDL1 (Clone CAL‐10, prediluted; Biocare, UK) and PDL2 (Clone TY25, dilution 1:100; Abcam). IDO‐1 was stained using a monoclonal antibody (Clone D5J4E, dilution 1:400; Cell Signaling Technology, Leiden, The Netherlands).
Staining was performed using an automated immunostainer (BenchMark ULTRA, Ventana Medical Systems, Tucson, USA), as already described in a previous IHC work by our study group.22 In brief, formalin fixed, paraffin‐embedded tissue sections were cut at 1.5 μm. After deparaffinization, slides were treated with cell conditioning reagent 1 (CC1, Ventana Medical Systems, Tucson, USA) for antigen retrieval and primary antibodies were incubated for 32 minutes at 37°C. The UltraView DAB Detection Kit (Ventana Medical Systems, Tucson, USA) was used for visualization according to the manufacturer's protocol. Finally, slides were washed in distilled water, counterstained with hematoxylin (12 minutes) and Bluing Reagent (4 minutes), dehydrated in a descending order of alcohols, cleared in xylene and coverslipped with Tissue‐Tek Glas Mounting Medium (Sakura Finetek, Japan).22
2.4. Quantification of immune cell density, scoring for immune‐suppressive molecules (PD‐1, PD‐L1, PD‐L2 and IDO‐1)
CD3 was scored semi‐quantitatively as low (i), medium (ii) and high (iii). For PD‐1, FOXP3, CD4 and CD8 a systematic quantitative cell analysis was performed by manually counting the number of positive cells for each subset in up to 5 high power fields (HPF) with hot spots of inflammation using the same field of view in consecutive slides. The total count of positive cells per HPF was calculated for each marker. In addition, the CD4/CD8 ratio was assessed.
PD‐L1 and PD‐L2 were assessed in tumor cells, immune cells and vessels as expression of these markers has been described in all 3 compartments. In all 3 compartments expression was scored semi‐quantitatively as 0 = negative, 1 = <1%, 2 = <5% and 3 = >5%. IDO‐1 expression was also assessed in tumor cells, in immune cells as well as in vessels, and was scored as 0 = negative, 1 = 1%‐10%, 2 = 10%‐20% and 3 = >20% positivity, as described by Trott et al.23 Representative stains for IDO‐1 scoring are shown in Figure 1. All counts were carried out by 2 independent observers (AB and BZ) using an Olympus BX50 microscope (40× magnification). Each investigator repeated all counts twice and the average of the repeated counts was used for statistical analyses.
Figure 1.
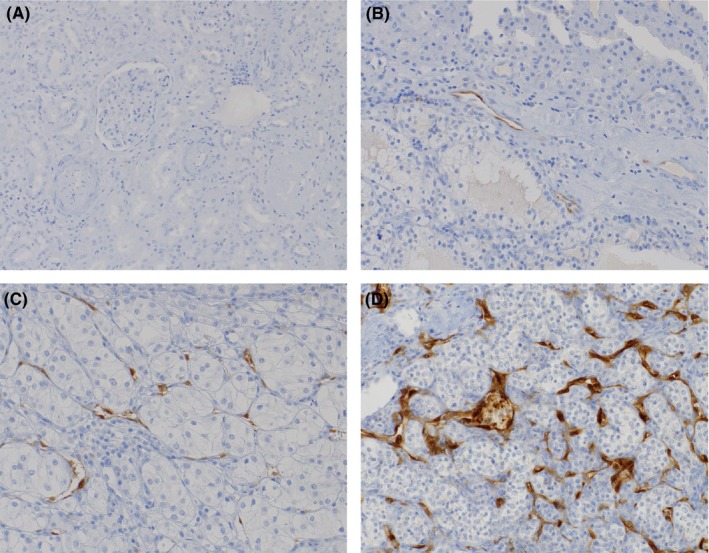
Immunohistochemical staining of IDO‐1. IDO‐1 was not expressed in normal kidney tissue (A), while IDO‐1 was predominantly expressed in tumor endothelial cells of all clear cell renal cell carcinoma specimens (B‐D); IDO‐1 expression was scored as described previously: 0 = no staining (A); 1 = 1%‐10% (B); 2 = 10%‐20% (C); 3 = >20% (D)23
2.5. Statistical analysis
Descriptive statistics (absolute and relative frequencies for qualitative data; mean, SD and range for quantitative data) are given for all baseline and histopathological variables. Infiltration levels of immune cell subsets and expression levels of immune‐suppressive molecules were compared with Mann‐Whitney U tests based on response to immunotherapy (responders vs non‐responders). Categories of IDO‐1 expression were compared between responders and non‐responders with Fisher's exact test. Correlations between parameters were assessed with Spearman's ρ correlation coefficient (r s). Progression‐free survival (PFS) and OS were calculated using the Kaplan‐Meier product‐limit‐estimator method and compared by means of the log‐rank test. A significance level of α = 0.05 (2‐tailed) was applied for all P‐values. SPSS, version 22.0 (IBM, Armonk, NY, USA) was used for statistical analysis. Graphic diagrams were produced with GraphPad PrismTM6 (GraphPad Software, La Jolla, CA, USA).
3. RESULTS
Fifteen (10 men and 5 women) mRCC patients with a mean (±SD, median, range) age of 65.4 (±9.9, 68, 50‐79) years were included in this pilot study. Baseline and histopathological characteristics of primary RCC specimens stratified by immunotherapy response are shown in Table 1. During a mean follow‐up of 10.6 months, therapeutic response to nivolumab was noticed in 6 (40%) of 15 patients, whereas 9 (60%) patients confirmed disease progression and switched to 3rd line therapy using cabozantinib.
Table 1.
Baseline and histopathological characteristics of metastatic renal cell carcinoma patients undergoing therapy with nivolumab in the second‐line setting, stratified by therapeutic response
| Parameters | Responders (n = 6) | Non‐responders (n = 9) |
|---|---|---|
| Gender | ||
| Female | 3 (50%) | 2 (22.2%) |
| Male | 3 (50%) | 7 (77.8%) |
| Age (mean ± SD, range), years | 70.5 ± 5.54, 61‐76 | 62.0 ± 10.97, 50‐79 |
| 1st line therapy | ||
| Sunitinib | 3 (50%) | 4 (44.4%) |
| Pazopanib | 3 (50%) | 5 (55.6%) |
| Duration of 1st line therapy (mean ± SD, range), months | 16.4 ± 18.92, 5.36‐57.17 | 8.2 ± 6.11, 2.3‐21.03 |
| Fuhrman grading of primary renal cell carcinoma | ||
| Grade 1‐2 | 4 (66.7%) | 4 (44.4%) |
| Grade 3‐4 | 2 (33.3%) | 5 (55.6%) |
| TNM staging of primary RCC | ||
| pT1‐T2 | 4 (66.7%) | 4 (44.4%) |
| pT3‐T4 | 2 (33.3%) | 5 (55.6%) |
| MSKCC risk classification | ||
| Favorable | 2 (33.3%) | — |
| Intermediate | 4 (66.7%) | 5 (55.6%) |
| Poor | — | 4 (44.4%) |
| CD3 score | ||
| 1 | — | 3 (33.3%) |
| 2 | 5 (83.3%) | 5 (55.6%) |
| 3 | 1 (16.7%) | 1 (11.1%) |
| CD4 (mean ± SD, range) | 211.1 ± 72.45, 136‐316.6 | 225.6 ± 42.11, 187‐320 |
| CD8 (mean ± SD, range) | 119.5 ± 59.38, 60‐209.8 | 53.5 ± 17.81, 34.2‐97.2 |
| CD4/CD8 ratio (mean ± SD, range) | 1.9 ± 0.42, 1.09‐2.27 | 4.4 ± 0.95, 3.29‐6.2 |
| IDO score (endothelial cells) | ||
| 0‐1 | — | 6 (66.7%) |
| 2‐3 | 6 (100%) | 3 (33.3%) |
| FOXP3 (mean ± SD, range) | 4.4 ± 6.45, 0‐16.4 | 7.7 ± 10.21, 0‐31.6 |
| PD‐1 (mean ± SD, range) | 18.3 ± 31.06, 0‐80.4 | 5.4 ± 5.84, 0‐15.2 |
| PD‐L1 score (tumor cells) | ||
| 0 | 5 (83.3%) | 8 (88.9%) |
| 1 | 1 (16.7%) | 1 (11.1%) |
| PD‐L1 score (immune cells) | ||
| 0 | 1 (16.2%) | 3 (33.3%) |
| 1 | 4 (66.7%) | 6 (66.7%) |
| 3 | 1 (16.2%) | — |
RCC, renal cell carcinoma.
IDO‐1 expression was totally absent in tumor cells and was only present in a few macrophages, while the majority of the immune cells remained negative. In contrast, IDO‐1 (≥1%) was expressed primarily in the endothelial cells of 13 (86.7%) RCC specimens.
Concerning therapeutic response to immunotherapy, all responders showed IDO‐1 overexpression (score 3, >20%), while 66.7% (n = 6) of non‐responders confirmed a low IDO‐1 expression (score 0‐1, 0%‐10%; P = .028), respectively. These results are in line with the fact that those patients with high IDO‐1 expression (>10%) had a significantly longer PFS during immunotherapy compared to those patients with low IDO‐1 expression (median: not estimated (NE) vs 3.5 months, P = .01 by log‐rank test). Nevertheless, no significant differences were noticed concerning OS (P = .92 by log‐rank test; Figure 2).
Figure 2.
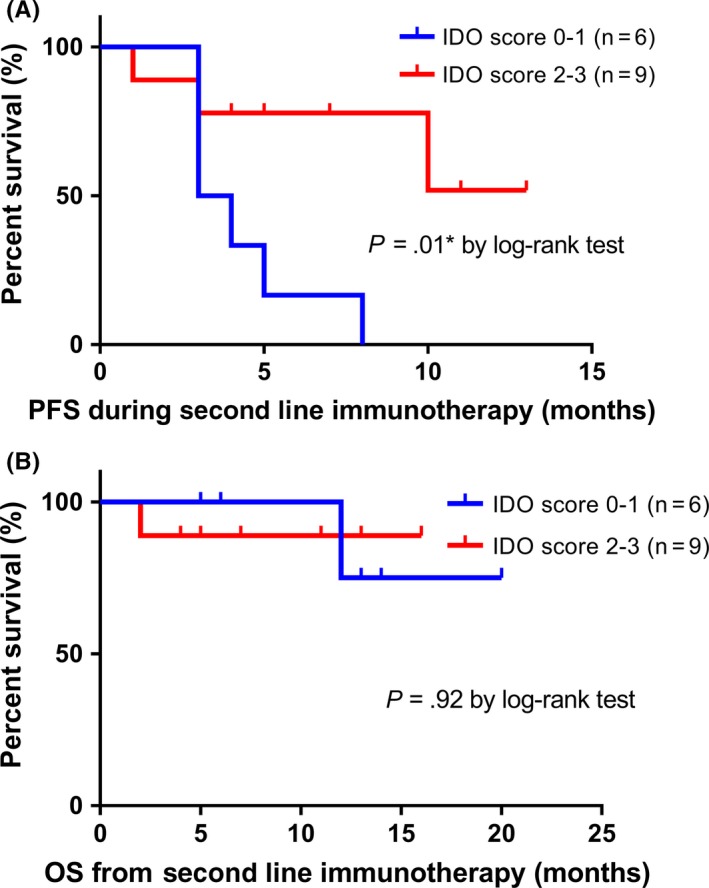
Kaplan‐Meier survival curves. A, Progression‐free survival (PFS) and B, overall survival (OS) stratified by IDO‐1 scoring (score 0‐1 vs 2‐3). P‐values by log‐rank test; *P < .05; **P < .01; ***P < .001
As a next step, we examined for correlation between immune‐inhibitory molecules and the T cell‐inflamed phenotype. A positive correlation was observed between IDO‐1 expression and CD8+ T cell infiltration (r s = .691, P = .006), resulting in an inverse correlation between IDO‐1 and CD4/CD8 ratio (r s = −.707, P = .004). In contrast, no significant correlation was noticed between the expression of IDO‐1 and CD4+ T cell infiltration, Figure 3. In contrast to CD4, significant differences in mean expression levels of immune cell subsets and immune‐inhibitory molecules based on immunotherapy response were confirmed only for CD8+ T cells (mean value, responders vs non‐responders: 119.5 vs 53.5; P = .002) and CD4/CD8 ratio (responders vs non‐responders: 1.9 vs 4.4; P < .001) (Figure 3 and Table 1).
Figure 3.
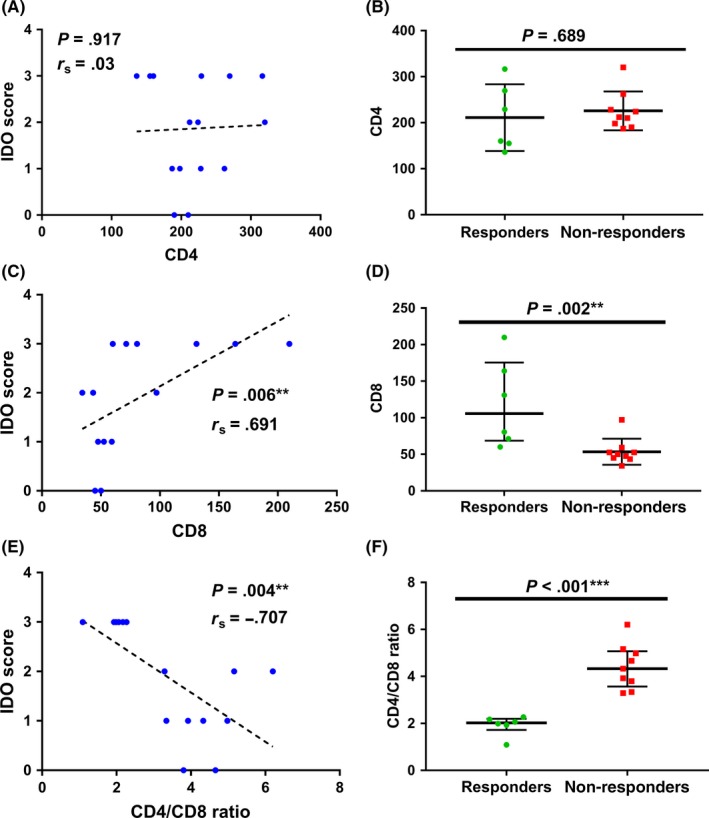
Correlation analysis between IDO score and CD4 (A), CD8 (C) and CD4/CD8 ratio (E) and scatter dot plots showing total expression levels of CD4+ T cells, CD8+ T cells and CD4/CD8 ratio depending on therapeutic response to immunotherapy (B, D, F). r s = Spearman's rank correlation coefficient; data represent median with interquartile range (*P < .05; **P < .01; ***P < .001); Mann‐Whithney U test
PD‐L1 negative tumor cells were seen in 13 (86.7%) patients, irrespective of therapeutic response (responders vs non‐responders: 83.3% vs 88.9%). No differences were noticed in the PD‐L1 expression (<1%) on tumor‐infiltrating immune cells (66.7% of both responders and non‐responders). PD‐L2 remained negative in tumor cells, tumor‐infiltrating immune cells and endothelial cells.
4. DISCUSSION
Various immunosuppressive factors are predominantly present within the tumor microenvironment, forming a barrier for effective T cell infiltration and function.24 These factors can be components of negative feedback pathways in response to inflammatory etiologies as CD8+ T cell inflamed tumors have been linked with an upregulation of immunosuppressive molecules (Figure 4).15, 16, 25 Thus, the positive association of immune activation gene subsets such as CD8A or CXCL9/CXCL1025 and immune inhibitory molecules (PD‐L1, IDO‐1, FOXP3, TIM3 and LAG3) may represent adaptive immune regulation mechanisms.15, 16, 25 In contrast, activation of immunosuppressive factors can also be an oncogenic driver of the tumor itself to act as “tumor protectors.”24 Thus, altering these immunosuppressive targets may result in more effective cancer immunotherapy. As an example, the cytotoxic T‐lymphocyte antigen 4 (CTLA‐4), the programmed death 1 (PD‐1) receptor and its major ligand PD‐L1 have become the most important immune checkpoint molecules across multiple tumor types.26 The unresolved and contradictory issue about PD‐L1 as a predictive biomarker of response for anti‐PD‐1 and anti‐PD‐L1 antibodies27 best describes the complicated interactions between immune responses and the tumor microenvironment, and the dynamic nature of the immune system.24 Thus, a comprehensive immune profiling of the tumor microenvironment with immunohistochemical quantification of other immunosuppressive factors (other than PD‐L1 alone), such as TGFβ, IDO‐1 and immunosuppressive molecules by tumor‐associated macrophages, immature tumor‐associated dendritic cells, Tregs, IL‐10‐producing regulatory B cells and MDSC, may be another step forward in the search of suitable predictive biomarkers.28 Biological differences in the immune microenvironment are mainly responsible for response to immunotherapy in various tumor types. For an example, increased IFNγ and PD1 pathways, higher CD8+ T cell infiltrates, with PD‐L1 and IDO‐1 overexpression was associated with a higher score of response signature to pembrolizumab in HPV‐negative oral squamous cell carcinoma.29 In addition, IDO‐1 overexpression has been noticed in pretreatment melanomas from responders to PD‐L1 inhibition.30 In this study, we evaluated for the first time the IDO‐1 activity within the tumor microenvironment of primary RCC specimens and its role as a possible pretreatment biomarker for predicting response to immunotherapy. In line with the results by Spranger15 and Sweis16 in melanoma and urothelial carcinoma patients, we demonstrated a positive association between increased expression of IDO‐1 in tumor endothelial cells and a higher rate of tumor‐infiltrating CD8+ T cells, resulting in a better response to PD‐1 inhibitors.
Figure 4.
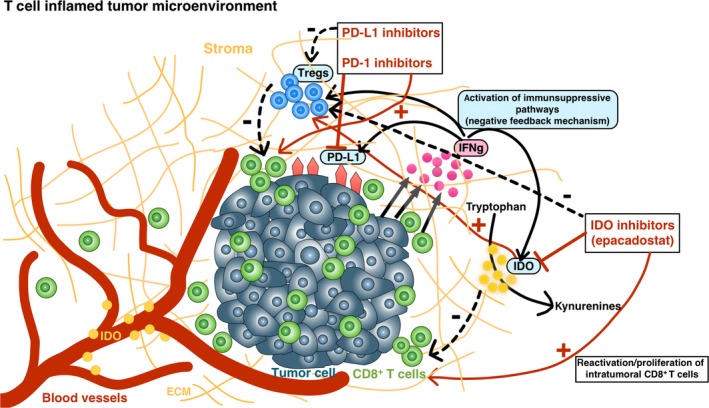
Interactions between the tumor microenvironment and the host immune system influence response to immunotherapy. Responders to immunotherapy appear to be enriched in the T cell‐inflamed microenvironment, characterized by infiltration of CD8+ T cells, chemokines and an interferon gamma signature, indicating an ongoing interaction between the tumor cells and the host immune response. CD8+ T cell inflamed tumors can activate various immunosuppressive pathways, such as IDO‐1 and/or PD‐L1, reflecting negative feedback pathways that limit ongoing T cell activation (by activating T regulatory cells and blocking the ongoing activity of effector T cells). Thus, upregulation of immunosuppressive pathways is more intrinsically driven by the immune system itself rather than by cancer cells.11, 13, 15, 16, 17 This fact suggests the hypothesis that blocking more than 1 immunosuppressive molecule by combining PD‐1/PD‐L1 inhibitors with IDO‐1 inhibitors may improve the therapeutic response to immunotherapy
IDO‐1 is an IFNγ‐mediated, intracellular enzyme that is inducible in monocyte‐derived cells, and in a variety of other cells like mesenchymal stromal cells, endothelial cells, fibroblasts and tumor cells.31, 32 IDO‐1 catalyzes the first step of tryptophan degradation in the kynurenine pathway, with a subsequent increase of the kynurenine‐to‐tryptophan ratio.32 As tryptophan deprivation can inhibit the proliferation of T‐cells, IDO‐1 seems to play an essential role regarding immune escape mechanisms for tumor cells and is one well‐known molecule that contributes as an immunosuppressive effector mechanism of Tregs.32, 33 Thus, accelerated breakdown of tryptophan with elevated expression of IDO‐1 was found in a wide variety of malignancies, being associated with disease progression, decreased OS and poor prognosis.32, 34, 35
In contrast to other tumor entities, tumor endothelial cells rather than tumor cells are responsible for IDO expression in RCC.36, 37 Our results are in line with these data as we detected no IDO‐positive tumor cells within primary tumor samples. Endothelial cells within the tumor tissues represented the most prominent IDO‐positive cell population within the tumor microenvironment. Moreover, high expression of IDO in endothelial cells was associated with significantly longer survival times than in those RCC patients with low IDO expression. These findings might be explained by the hypothesis that a consecutive reduced influx of tryptophan into the surrounding tumor tissue results in decreased tumor cell proliferation. Two studies substantiate this hypothesis by confirming a statistically significant inverse correlation between the density of endothelial IDO‐1 expression and Ki67‐positive tumor cells.36, 37
Approximately two years ago, nivolumab has been introduced as the first single agent and is until now the only FDA‐ and EMA‐approved checkpoint inhibitor in the second‐line treatment of advanced RCC according to the Checkmate 025 study,12 demonstrating an OS and ORR improvement across multiple subgroups.38 Although these data are very exciting, the ORR was maximally 32%, respectively.38 In addition to the use of checkpoint inhibitors for monotherapy, there is now much focus on combining checkpoint inhibitors with other immunotherapies (ipilimumab plus nivolumab; Checkmate 01639 and Checkmate 214 study; NCT02231749),40 or with anti‐angiogenic targeted therapies such as TKI (axitinib, lenvatinib, bevacizumab) to improve therapeutic efficacy with limited additive toxicity in the first‐line treatment of metastatic RCC.41, 42 In addition, targeting compensatory immune inhibitory mechanisms such as IDO‐1 has been proposed to work synergistically with checkpoint blockade in cancer therapy.35 For example, the phase 1/2 ECHO‐202/KEYNOTE‐037 study evaluates the efficacy, tolerability and safety of combining the IDO inhibitor epacadostat plus pembrolizumab in patients with various tumor entities such as advanced RCC, urothelial carcinoma, triple‐negative breast and ovarian cancer, head and neck tumors and non‐small cell lung cancer (NCT02178722). Regarding advanced RCC, preliminary results demonstrated an ORR in patients with 0‐1 prior lines of treatment of 47% (CR in 5%) and a disease control rate (DCR) of 58%, confirming responses regardless of PD‐L1 expression.43
One of the major limitations of this pilot study is the limited sample size with retrospectively evaluated oncological results. The small sample size, resulting in limitation of statistical power, has to be considered, particularly regarding the role of IDO‐1 in survival analysis.
In RCC, IDO‐1 was predominantly expressed in tumor endothelial cells and was absent from tumor cells. Expression of IDO‐1 in tumor endothelial cells was inversely correlated with the CD4/CD8 ratio, resulting in a better PFS and therapeutic response to nivolumab. In contrast to PD‐L1 and PD‐L2, IDO‐1 seems to be a more promising predictive biomarker for response to immune‐based cancer therapy in mRCC. Further prospective multicenter trials are needed to further prove these preliminary findings.
CONFLICT OF INTEREST
The authors have no conflicts of interest to declare.
Seeber A, Klinglmair G, Fritz J, et al. High IDO‐1 expression in tumor endothelial cells is associated with response to immunotherapy in metastatic renal cell carcinoma. Cancer Sci. 2018;109:1583–1591. https://doi.org/10.1111/cas.13560
REFERENCES
- 1. Siegel RL, Miller KD, Jemal A. Cancer statistics. CA Cancer J Clin. 2017;67:7‐30. [DOI] [PubMed] [Google Scholar]
- 2. Van Poppel H, Da Pozzo L, Albrecht W, et al. A prospective, randomised EORTC intergroup phase 3 study comparing the oncologic outcome of elective nephron‐sparing surgery and radical nephrectomy for low‐stage renal cell carcinoma. Eur Urol. 2011;59:543‐552. [DOI] [PubMed] [Google Scholar]
- 3. MacLennan S, Imamura M, Lapitan MC, et al. Systematic review of oncological outcomes following surgical management of localised renal cancer. Eur Urol. 2012;61:972‐993. [DOI] [PubMed] [Google Scholar]
- 4. Tannir NM, Schwab G, Grünwald V. Cabozantinib: an active novel multikinase inhibitor in renal cell carcinoma. Curr Oncol Rep. 2017;19:14. [DOI] [PMC free article] [PubMed] [Google Scholar]
- 5. Motzer RJ, Michealson MD, Redman BG, et al. Activity of SU11248, a multitargeted inhibitor of vascular endothelial growth factor receptor and platelet‐derived growth factor receptor, in patients with metastatic renal cell carcinoma. J Clin Oncol. 2006;24:16‐24. [DOI] [PubMed] [Google Scholar]
- 6. Gupta K, Miller JD, Li JZ, Russell MW, Charbonneau C. Epidemiologic and socioeconomic burden of metastatic renal cell carcinoma(mRCC): a literature review. Cancer Treat Rev. 2008;34:193‐205. [DOI] [PubMed] [Google Scholar]
- 7. Bergers G, Hanahan D. Modes of resistance to anti‐angiogenic therapy. Nat Rev Cancer. 2008;8:592‐603. [DOI] [PMC free article] [PubMed] [Google Scholar]
- 8. Welti J, Loges S, Dimmeler S, Carmeliet P. Recent molecular discoveries in angiogenesis and antiangiogenic therapies in cancer. J Clin Invest. 2013;123:3190‐3200. [DOI] [PMC free article] [PubMed] [Google Scholar]
- 9. Pircher A, Jöhrer K, Kocher F, et al. Biomarkers of evasive resistance predict disease progression in cancer patients treated with antiangiogenic therapies. Oncotarget. 2016;7:20109‐20123. [DOI] [PMC free article] [PubMed] [Google Scholar]
- 10. Couzin‐Frankel J. Breakthrough of the year 2013. Cancer immunotherapy. Science. 2013;342:1432‐1433. [DOI] [PubMed] [Google Scholar]
- 11. Pardoll DM. The blockade of immune checkpoints in cancer immunotherapy. Nat Rev Cancer. 2012;12:252‐264. [DOI] [PMC free article] [PubMed] [Google Scholar]
- 12. Motzer RJ, Escudier B, McDermott DF, et al. Nivolumab versus everolimus in advanced renal‐cell carcinoma. N Engl J Med. 2015;373:1803‐1813. [DOI] [PMC free article] [PubMed] [Google Scholar]
- 13. Patel SP, Kurzrock R. PD‐L1 expression as a predictive biomarker in cancer immunotherapy. Mol Cancer Ther. 2015;14:847‐856. [DOI] [PubMed] [Google Scholar]
- 14. Meng X, Huang Z, Teng F, Xing L, Yu J. Predictive biomarkers in PD‐1/PD‐L1 checkpoint blockade immunotherapy. Cancer Treat Rev. 2015;41:868‐876. [DOI] [PubMed] [Google Scholar]
- 15. Spranger S, Spaapen RM, Zha Y, et al. Up‐regulation of PD‐L1, IDO, and T(regs) in the melanoma tumor microenvironment is driven by CD8(+) T cells. Sci Transl Med. 2013;5:200ra116. [DOI] [PMC free article] [PubMed] [Google Scholar]
- 16. Sweis RF, Spranger S, Bao R, et al. Molecular drivers of the non‐t‐cell‐inflamed tumor microenvironment in urothelial bladder cancer. Cancer Immunol Res. 2016;4:563‐568. [DOI] [PMC free article] [PubMed] [Google Scholar]
- 17. Taube JM, Anders RA, Young GD, et al. Colocalization of inflammatory response with B7 h1 expression in human melanocyticlesions supports an adaptive resistance mechanism of immune escape. Sci Transl Med. 2012;4:127ra37. [DOI] [PMC free article] [PubMed] [Google Scholar]
- 18. Spranger S, Koblish HK, Horton B, Scherle PA, Newton R, Gajewski TF. Mechanism of tumor rejection with doublets of CTLA‐4, PD‐1/PD‐L1, or IDO blockade involves restored IL‐2 production and proliferation of CD8(+) T cells directly within the tumor microenvironment. J Immunother Cancer. 2014;2:3. [DOI] [PMC free article] [PubMed] [Google Scholar]
- 19. Holmgaard RB, Zamarin D, Li Y, et al. Tumor‐expressed IDO recruits and activates MDSCs in a Treg‐dependent manner. Cell Rep. 2015;13:412‐424. [DOI] [PMC free article] [PubMed] [Google Scholar]
- 20. Munn DH, Mellor AL. IDO in the tumor microenvironment: inflammation, counter‐regulation, and tolerance. Trends Immunol. 2016;37:193‐207. [DOI] [PMC free article] [PubMed] [Google Scholar]
- 21. Escudier B, Motzer RJ, Sharma P, et al. Treatment beyond progression in patients with advanced renal cell carcinoma treated with nivolumab in CheckMate 025. Eur Urol. 2017;72:368‐376. [DOI] [PubMed] [Google Scholar]
- 22. Pichler R, Fritz J, Zavadil C, Schäfer G, Culig Z, Brunner A. Tumor‐infiltrating immune cell subpopulations influence the oncologic outcome after intravesical Bacillus Calmette‐Guérin therapy in bladder cancer. Oncotarget. 2016;7:39916‐39930. [DOI] [PMC free article] [PubMed] [Google Scholar]
- 23. Trott JF, Kim J, Abu Aboud O, et al. Inhibiting tryptophan metabolism enhances interferon therapy in kidney cancer. Oncotarget. 2016;7:66540‐66557. [DOI] [PMC free article] [PubMed] [Google Scholar]
- 24. Wu AA, Drake V, Huang HS, Chiu S, Zheng L. Reprogramming the tumor microenvironment: tumor‐induced immunosuppressive factors paralyze T cells. Oncoimmunology. 2015;4:e1016700. [DOI] [PMC free article] [PubMed] [Google Scholar]
- 25. Rosenberg JE, Hoffman‐Censits J, Powles T, et al. Atezolizumab in patients with locally advanced and metastatic urothelial carcinoma who have progressed following treatment with platinum‐based chemotherapy: a single‐arm, multicentre, phase 2 trial. Lancet. 2016;387:1909‐1920. [DOI] [PMC free article] [PubMed] [Google Scholar]
- 26. Topalian SL, Drake CG, Pardoll DM. Immune checkpoint blockade: a common denominator approach to cancer therapy. Cancer Cell. 2015;27:450‐461. [DOI] [PMC free article] [PubMed] [Google Scholar]
- 27. Carbognin L, Pilotto S, Milella M, et al. Differential activity of nivolumab, pembrolizumab and MPDL3280A according to the tumor expression of programmed death‐ligand‐1 (PD‐L1): sensitivity analysis of trials in melanoma, lung and genitourinary cancers. PLoS ONE. 2015;10:e0130142. [DOI] [PMC free article] [PubMed] [Google Scholar]
- 28. Kyi C, Postow MA. Immune checkpoint inhibitor combinations in solid tumors: opportunities and challenges. Immunotherapy. 2016;8:821‐837. [DOI] [PMC free article] [PubMed] [Google Scholar]
- 29. Foy JP, Bertolus C, Michallet MC, et al. The immune microenvironment of HPV‐negative oral squamous cell carcinoma from never‐smokers and never‐drinkers patients suggests higher clinical benefit of IDO1 and PD1/PD‐L1 blockade. Ann Oncol. 2017;28:1934‐1941. [DOI] [PubMed] [Google Scholar]
- 30. Herbst RS, Soria JC, Kowanetz M, et al. Predictive correlates of response to the anti‐PD‐L1 antibody MPDL3280A in cancer patients. Nature. 2014;515:563‐567. [DOI] [PMC free article] [PubMed] [Google Scholar]
- 31. Werner ER, Werner‐Fellmayer G, Fuchs D, Hausen A, Reibnegger G, Wachter H. Parallel induction of tetrahydrobiopterin biosynthesis and indoleamine 2,3‐dioxygenase activity in human cells and cell lines by interferon‐gamma. Biochem J. 1989;262:861‐866. [DOI] [PMC free article] [PubMed] [Google Scholar]
- 32. Moon YW, Hajjar J, Hwu P, Naing A. Targeting the indoleamine 2,3‐dioxygenase pathway in cancer. J Immunother Cancer. 2015;3:51. [DOI] [PMC free article] [PubMed] [Google Scholar]
- 33. Mellor AL, Baban B, Chandler P, et al. Cutting edge: induced indoleamine 2,3 dioxygenase expression in dendritic cell subsets suppresses T cell clonal expansion. J Immunol. 2003;171:1652‐1655. [DOI] [PubMed] [Google Scholar]
- 34. Brandacher G, Winkler C, Schroecksnadel K, Margreiter R, Fuchs D. Antitumoral activity of interferon‐gamma involved in impaired immune function in cancer patients. Curr Drug Metab. 2006;7:599‐612. [DOI] [PubMed] [Google Scholar]
- 35. Brochez L, Chevolet I, Kruse V. The rationale of indoleamine 2,3‐dioxygenase inhibition for cancer therapy. Eur J Cancer. 2017;76:167‐182. [DOI] [PubMed] [Google Scholar]
- 36. Riesenberg R, Weiler C, Spring O, et al. Expression of indoleamine 2,3‐dioxygenase in tumor endothelial cells correlates with long‐term survival of patients with renal cell carcinoma. Clin Cancer Res. 2007;13:6993‐7002. [DOI] [PubMed] [Google Scholar]
- 37. Yuan F, Liu Y, Fu X, Chen J. Indoleamine‐pyrrole 2,3‐dioxygenase might be a prognostic biomarker for patients with renal cell carcinoma. Zhong Nan Da Xue Xue Bao Yi Xue Ban. 2012;37:649‐655. [DOI] [PubMed] [Google Scholar]
- 38. Escudier B, Sharma P, McDermott DF, et al. CheckMate 025 randomized phase 3 study: outcomes by key baseline factors and prior therapy for nivolumab versus everolimus in advanced renal cell carcinoma. Eur Urol. 2017;72:962‐971. [DOI] [PubMed] [Google Scholar]
- 39. Hammers HJ, Plimack ER, Infante JR, et al. Safety and efficacy of nivolumab in combination with ipilimumab in metastatic renal cell carcinoma: the CheckMate 016 study. J Clin Oncol. 2017;35:3851‐3858. [DOI] [PMC free article] [PubMed] [Google Scholar]
- 40. Motzer RJ, Tannir NM, McDermott DF, et al. Nivolumab plus Ipilimumab versus Sunitinib in Advanced Renal‐Cell Carcinoma. N Engl J Med. 2018. [DOI] [PMC free article] [PubMed] [Google Scholar]
- 41. Pircher A, Wolf D, Heidenreich A, Hilbe W, Pichler R, Heidegger I. Synergies of targeting tumor angiogenesis and immune checkpoints in non‐small cell lung cancer and renal cell cancer: from basic concepts to clinical reality. Int J Mol Sci. 2017;18:pii: E2291. [DOI] [PMC free article] [PubMed] [Google Scholar]
- 42. Pichler R, Heidegger I. Novel concepts of antiangiogenic therapies in metastatic renal cell cancer. Memo. 2017;10:206‐212. [DOI] [PMC free article] [PubMed] [Google Scholar]
- 43. Lara P, Bauer TM, Hamid O, et al. Epacadostat plus pembrolizumab in patients with advanced RCC: preliminary phase I/II results from ECHO‐202/KEYNOTE‐037. J Clin Oncol 2017;35(15_suppl), 4515‐4515. [Google Scholar]