Abstract
The present study aimed to investigate the effect of long non‐coding RNA (lncRNA) RP11‐552M11.4 on cell proliferation, apoptosis, migration and invasion as well as its targeting genes in epithelial ovarian cancer (EOC) cells. LncRNA RP11‐552M11.4 expression was detected in 67 tumor tissues and paired adjacent tissues obtained from EOC patients. lncRNA RP11‐552M11.4 mimic/inhibitor plasmids were transferred into ovarian cancer cells (SKOV3, A‐2780) and normal ovarian epithelial cells (IOSE80 cells). In addition, rescue experiment was carried out by transferring BRCA2 inhibitor&lncRNA RP11‐552M11.4 inhibitor plasmids into SKOV3 and A‐2780 cells. qPCR, western blot, CKK‐8, Annexin V/propidium iodide (AV/PI), wound‐healing and Matrigel invasion assays were carried out to detect RNA expression, protein expression, cell proliferation, apoptosis, migration, and invasion, respectively. LncRNA RP11‐552M11.4 expression was elevated in tumor tissues compared with paired adjacent tissues and correlated with higher pathological grade, International Federation of Gynecology and Obstetrics stage and worse overall survival in EOC patients. LncRNA RP11‐552M11.4 promoted SKOV3 cell proliferation, migration and invasion whereas it inhibited apoptosis. Rescue experiment and luciferase reporter assay showed that lncRNA RP11‐552M11.4 regulated SKOV3 cells functions through binding BRCA2. Further experiments in A‐2780 cells also validated that lncRNA RP11‐552M11.4 induced A‐2780 cell proliferation while repressing apoptosis by targeting BRCA2. In addition, upregulation of lncRNA RP11‐552M11.4 increased IOSE80 cell proliferation, migration and invasion while decreasing apoptosis. In conclusion, lncRNA RP11‐552M11.4 correlates with worse prognosis, and promotes cell proliferation, migration, invasion, and inhibits cell apoptosis by down‐regulating BRCA2 in EOC.
Keywords: apoptosis, epithelial ovarian cancer, invasion, long non‐coding RNA RP11‐552M11.4, proliferation
Abbreviations
- AV
Annexin V
- BCA
bicinchoninic acid
- CA125
carbohydrate antigen 125
- EOC
epithelial ovarian cancer
- FIGO
International Federation of Gynecology and Obstetrics
- lncRNA
long non‐coding RNA
- ncRNA
non‐coding RNA
- OD
optical density
- OS
overall survival
- PI
propidium iodide
- qPCR
quantitative polymerase chain reaction
1. INTRODUCTION
Ovarian cancer, the eighth leading cause of cancer‐related deaths in women worldwide, is one of the most common cancers that critically threatens public health.1, 2 A recent Global Cancer Statistics report indicates that an estimated 238 700 new ovarian cancer cases and 151 900 ovarian cancer‐related deaths occurred worldwide during 2012.2 EOC accounts for more than 90% of all ovarian cancers, which is a lethal gynecological malignancy as a result of the advanced stage and high possibility of metastasis at diagnosis in most patients.3, 4 Although many improvements have been achieved in EOC management such as tumor screening, imaging technology, novel therapies and treatment strategies, the prognosis of EOC is still far from satisfactory.5, 6, 7, 8, 9, 10 Thus, exploration of novel biomarkers for prognosis and new therapeutic targets are essential to further improve the outcomes in EOC patients.
LncRNA, an important part of ncRNA consisting of more than 200 nucleotides, is involved in many critical biological phenomena including imprinting genomic loci, shaping chromosome conformation, regulating enzymatic activity and so on.11 Growing evidence has shown that lncRNA is implicated in numerous cancers through its interactions with other cellular macromolecules including DNA, protein, and RNA.12, 13 As to EOC, only a few studies have reported that several lncRNAs are involved in EOC development and progression, which could regulate EOC cell proliferation, apoptosis, migration and invasion through monitoring cancer‐related genes and pathways, and some of them have the potential to be diagnostic, prognostic biomarkers or therapeutic targets for EOC.14, 15, 16, 17 However, the role of numerous lncRNAs in EOC pathogenesis is still largely unknown, and lots of novel lncRNAs which are involved in EOC development and progression need to be discovered. Thus, we analyzed a previous non‐coding RNA profiling data determined by microarray which includes 11 normal ovarian tissues and 29 ovarian cancer tissues published on the GEO database (GSE74448), and 3 candidate lncRNAs consisting of lncRNA RP11‐552M11.4, lncRNA RP1‐102K2.8 and lncRNA HOXA‐AS3 were selected for exploration in this study according to the rank of the adjusted P‐value for differentially expressed lncRNAs.
The present study aimed to investigate the correlation of candidate lncRNA expression with clinicopathological features and OS in EOC patients. Also, most importantly, we investigated the role of lncRNA RP11‐552M11.4 on cell proliferation, migration, invasion and apoptosis, as well as its targeting genes in ovarian cancer cells.
2. MATERIALS AND METHODS
2.1. Participants
Sixty‐seven EOC patients who underwent surgery at Department of Gynecology in Harbin Medical University Cancer Hospital from January 2013 to December 2016 were retrospectively reviewed. Inclusion criteria were as follows: (i) confirmed diagnosis of EOC by pathological and clinical findings; (ii) age above 18 years; (iii) clinical information that included age, histological subtype, pathological grade, tumor size, volume of ascites, FIGO stage, CA125 and OS; and (iv) tumor tissue and paired adjacent tissue that were available for qPCR assay and stored in a biological sample storehouse. Patients with the following conditions were excluded: (i) secondary ovarian cancer; (ii) history of other solid tumors or hematological malignancies; and (iii) history of ovarian surgery.
This study was approved by the Ethics Committee of Harbin Medical University Cancer Hospital and conducted in accordance with the Declaration of Helsinki. Written informed consent or oral agreement by telephone with tape‐recording was obtained from all patients or their guardians.
2.2. Data collection and follow up
Clinical and pathological data were retrieved from the hospital electronic medical records system including age, histological subtype, pathological grade, peritoneal cytology, tumor size, volume of ascites, FIGO stage, CA125 and survival information. Patients were followed up regularly according to disease conditions and patients’ willingness as follows: patients were followed up 1 time every 1‐3 months in the first half year post‐surgery, and then 1 time every 3‐12 months in the remaining period. Median follow‐up duration was 22.0 (range 1‐47) months, and the last follow‐up month was December 2016. OS was calculated from the time of surgery to the date of patient's death from any cause.
2.3. Samples and candidate lncRNA expression measurement
Tumor tissue samples and paired adjacent tissue samples of EOC patients were acquired from the biological sample storehouse in which samples obtained during surgery were stored in liquid nitrogen. LncRNA RP11‐552M11.4, lncRNA RP1‐102K2.8 and lncRNA HOXA‐AS3 expressions in tumor tissue and paired adjacent tissue were determined by qPCR assay. These three candidate lncRNAs were selected by analyzing a previous non‐coding RNA profiling data by microarray (including 11 normal ovarian tissues and 29 ovarian cancer tissues) published on the GEO database according to the rank of the adjusted P‐value for differentially expressed lncRNAs. The data source is available on https://www.ncbi.nlm.nih.gov/geo/query/acc.cgi?acc=GSE74448
2.4. Cell culture
Human ovarian cancer cells (SKOV3 cells) were purchased from Shanghai Institute for Biological Science (Shanghai, China); and another ovarian cancer cell line (A‐2780 cells) and normal ovarian epithelial cells (IOSE80 cells) were kindly given by Shanghai Jiaotong University (Shanghai, China). SKOV3 and A‐2780 cells were cultured in 80% RPMI 1640 medium (Sigma‐Aldrich, St Louis, MO, USA), supplemented with 10% FBS (Gibco, USA), 10% horse serum (Gibco), 100 units/mL penicillin and 100 μg/mL streptomycin. IOSE80 cells were cultured in 89% RPMI 1640 medium (Sigma‐Aldrich), supplemented with 10% FBS (Gibco), 1% penicillin and streptomycin. Cells were incubated in a humidified incubator under 5% CO2 at 37°C.
2.5. Plasmid preparation
pGPU6 inhibitor plasmids (GenePharma, Suzhou, China) and pEX‐1 mimic plasmids (GenePharma) were used for transfection. LncRNA RP11‐552M11.4 mimic sequence was: TTTGTGAGAGATGCGACTTGGTCCCC GCTCAATCACTCCCTGCTTACCACAGTGGGCTGGGACCATCAGGTCGTCCACCACGTTGTGCCCACAGAACCTCTCCCAGCCCCTGGACCTGCAAGTGTTACTGAGTAGATTGGATTTAAGACAAAAAGCAAGTCCCCCATGAGTGTCCACTTCTTTGCCCTGCCCTCTCAGCTTGTGAGACAACACAGGAGCCTTCTATACTGTTCTCTGGTCCACCAAGGGCTATGAGGCTCACCCCTTGGATGGTGCTCAGAACCACAAGGAATACTGAAGAAGCCTTGCCTATGATTTCAGGTGGCATCAGACATTGGGCTAATTTTCAAGGTGTCTCTCCTTCCCAACAGGACAGTCGGAGTCTGGTTCTTTAATAAATAGCTATATGGATCTT; LncRNA RP11‐552M11.4 inhibitor sequence was target: CACAGGAGCCTTCTATAGT, sense: CACAGGAGCCUUCUAUAGU, antisense: GUGUCCUCGGAAGAUAUCA; BRCA2 inhibitor sequence was target: GAACTTTCTTCAGAAGCTC, sense: GAACUUUCUUCAGAAGCUC, antisense: CUUGAAAGAAGUCUUCGAG.
2.6. Plasmid transfection of lncRNA RP11‐552M11.4 mimic and inhibitor and follow‐up assays
Blank mimic, lncRNA RP11‐552M11.4 mimic, blank inhibitor and lncRNA RP11‐552M11.4 inhibitor plasmids were subsequently transferred into SKOV3 cells, which were classified into 4 groups: NC1(+); LncRNA RP11‐552M11.4(+); NC2(−); and LncRNA RP11‐552M11.4(−). The following assays were carried out in all 4 groups: (i) qPCR assay for lncRNA RP11‐552M11.4 expression at 24 hours; (ii) CKK8 assay for cell proliferation at 0, 24 and 48 hours; (iii) wound‐healing assay for cell migration at 24 hours; (iv) Matrigel invasion assay for cell invasion at 24 hours; (v) AV/PI assay for cell apoptosis rate at 48 hours; and (vi) western blot assay for apoptotic marker (C‐Caspase 3 and Bcl‐2) expression at 48 hours.
In addition, candidate target genes including BRCA2, MMP9, TGFB1, MDM2 and BRAF mRNA and protein expressions were detected by qPCR and western blot assays. Candidate target genes of lncRNA RP11‐552M11.4 in EOC were predicted as follows: (i) target mRNAs of lncRNA RP11‐552M11.4 were first predicted by RIsearch, RNAplex and LncTar databases.18, 19, 20 mRNAs with consistent results by these 3 database predicting methods were selected. (ii) mRNAs that correlated with ovarian cancer risk were analyzed by DisGeNET (http://www.disgenet.org).21 (iii) Potential target genes (BRCA2, MMP9, TGFB1, MDM2 and BRAF) of lncRNA RP11‐552M11.4 in EOC were then selected by combining analysis of lncRNA RP11‐552M11.4 predicted target genes and ovarian cancer‐related genes.
2.7. Rescue experiment in SKOV3 cells
In order to validate whether lncRNA RP11‐552M11.4 regulated ovarian cancer cell functions by targeting BRCA2, we subsequently carried out a rescue experiment in SKOV3 cells. Blank inhibitor, BRCA2 inhibitor, lncRNA RP11‐552M11.4 inhibitor and BRCA2 inhibitor&lncRNA RP11‐552M11.4 inhibitor plasmids were transferred into SKOV3 cells and the cells were correspondingly divided into 4 groups: NC(−); BRCA2(−); LncRNA RP11‐552M11.4(−); and BRCA2(−)/LncRNA RP11‐552M11.4(−). The following assays were also carried out in these 4 groups: (i) qPCR assay for lncRNA RP11‐552M11.4 expression at 24 hours; (ii) qPCR assay and western blot assay for BRCA2 mRNA and protein expressions at 24 hours; (iii) CKK8 assay for cell proliferation at 0, 24 and 48 hours; (iv) wound‐healing assay for cell migration at 24 hours; (v) Matrigel invasion assay for cell invasion at 24 hours; (vi) AV/PI assay for cells apoptosis rate at 48 hours; and (vii) western blot assay for apoptotic marker (C‐Caspase 3 and Bcl‐2) expressions at 48 hours.
2.8. Luciferase reporter assay
Luciferase reporter assay was conducted to validate the binding site between RP11‐552M11.4 and BRCA2 in SKOV3 cells by deleting the binding site (1665‐1720 bp) from BRCA2. The 1500‐2500‐bp sequences of BRCA2 with or without binding site were constructed into firefly luciferase reporter (Luc), with Renilla luciferase (Rluc) as calibration fluorescence. SKOV3 cells, lncRNA RP11‐552M11.4 mimic and vectors were mixed, and cultured for 24 hours, and the luciferase activity was examined by a dual‐luciferase reporter assay system.
2.9. Further validation for the effect of lncRNA RP11‐552M11.4 and BRCA2 on cell proliferation and apoptosis in A‐2780 cells
In order to validate the effect of lncRNA RP11‐552M11.4 and BRCA2 on regulating ovarian cancer cell functions, we carried out the experiments in another human ovarian cancer cell line (A‐2780 cells). First, blank mimic, lncRNA RP11‐552M11.4 mimic, blank inhibitor, and lncRNA RP11‐552M11.4 inhibitor plasmids were transferred into A‐2780 cells as 4 groups: NC1(+); LncRNA RP11‐552M11.4(+); NC2(−); and LncRNA RP11‐552M11.4(−). LncRNA RP11‐552M11.4 expression was detected at 24‐hours post‐transfection by qPCR assay; cell proliferation was determined at 0, 24 and 48 hours post‐transfection by CCK8 assay; and cell apoptosis was detected at 48 hours post‐transfection by AV/PI assay. Second, NC inhibitor, BRCA2 inhibitor, lncRNA RP11‐552M11.4 inhibitor, and BRCA2 inhibitor&lncRNA RP11‐552M11.4 inhibitor plasmids were transferred into A‐2780 cells as 4 groups: NC(−); BRCA2(−); LncRNA RP11‐552M11.4(−); and BRCA2(−)/LncRNA RP11‐552M11.4(−). BRCA2 mRNA and lncRNA RP11‐552M11.4 expressions were detected at 24 hours post‐transfection by qPCR assay; BRCA2 protein expression was measured at 24‐hours post‐transfection by western blot assay; cell proliferation was determined at 0, 24 and 48 hours post‐transfection by CCK8 assay; and cell apoptosis was detected at 48‐hours post‐transfection by AV/PI assay.
2.10. Effect of lncRNA RP11‐552M11.4 on cell proliferation, migration, invasion, and apoptosis in normal ovarian epithelial cells
In order to determine the transformation activity of lncRNA RP11‐552M11.3 on normal ovarian epithelial cells, lncRNA RP11‐552M11.4 mimic, blank inhibitor, and lncRNA RP11‐552M11.4 inhibitor plasmids were transferred into IOSE80 cells as 4 groups. After transfection, cell proliferation was determined by CCK8 assay at 0, 24 and 48 hours, cell migration and invasion were detected by wound‐healing assay and Matrigel invasion assay at 24 hours, and cell apoptosis was detected by AV/PI assay at 48 hours.
2.11. qPCR assay
Expressions of lncRNA and mRNAs were detected by qPCR assay. Total RNA was extracted by TRIzol Reagent (Invitrogen, Carlsbad, CA, USA) according to the manufacturer's instructions. RNA was then quantified by OD 260, and 1 μg total RNA from each sample was used for cDNA synthesis with reverse transcription kit (TaKaRa, Kyoto, Japan). The cDNA product was subsequently subjected to qPCR with SYBR Green kit (TaKaRa). PCR amplification was carried out as follows: 95°C for 5 minutes, followed by 40 cycles of 95°C for 5 seconds, and 61°C for 30 seconds. GAPDH or U6 was used as a reference gene for mRNAs or lncRNAs expression calculation. RNA expression was calculated by the 2−ΔΔCt method. Primers of lncRNAs and mRNAs used in this study are presented in Table 1.
Table 1.
Primers used in the present study
| Gene | Forward primer (5′‐>3′) | Reverse primer (5′‐>3′) |
|---|---|---|
| GAPDH | GAGTCCACTGGCGTCTTCAC | ATCTTGAGGCTGTTGTCATACTTCT |
| U6 | CTCGCTTCGGCAGCACA | AACGCTTCACGAATTTGCGT |
| BRCA2 | TGCGTTGAGGAACTTGTGACTA | TGCGTTGAGGAACTTGTGACTA |
| MMP9 | AAGGGCGTCGTGGTTCCAA | AAGGGCGTCGTGGTTCCAA |
| TGFB1 | GCCGACTACTACGCCAAGGA | TGAGGTATCGCCAGGAATTGTTG |
| MDM2 | CAGCAGGAATCATCGGACTCA | GTTCACTTACACCAGCATCAAGAT |
| BRAF | CGGAGGAGGTGTGGAATATCA | GAAGAGGAAGAAGATGTAACGGTAT |
| LncRNA RP11‐552M11.4 | ACTTGCTGTTCTCTGGTCCAC | ACTTGCTGTTCTCTGGTCCAC |
2.12. Western blot assay
Total protein was extracted from cells with 1 mL RIPA buffer (Thermo Fisher Scientific, Waltham, MA, USA) and the concentration was then measured using a BCA kit (Pierce Biotechnology, Rockford, IL, USA) and determined according to the standard curve. Subsequently, 20 μg protein samples with equal concentration were subjected to SDS‐PAGE and transferred to PVDF membranes (Millipore, Bedford, MA, USA). After blocking with 5% skim milk for 2 hours, membranes were incubated with the corresponding primary antibodies (Table 2) overnight at 4°C. Then, membranes were incubated with the appropriate secondary antibody (Table 2) for 1 hour at room temperature. Bands were visualized using an ECL kit (Millipore, Bedford, MA, USA) followed by exposure to X‐ray film. As to the protein relative expression calculation, Image J Software (National Institutes of Health, Bethesda, MA, USA) was used to determine the density of western blot results, and relative density of target protein was normalized by GAPDH density as a ratio.
Table 2.
Antibodies used in the present study
| Antibody | Company/Address | Dilution ratio |
|---|---|---|
| Primary antibody | ||
| BRCA2 rabbit mAb | CST (USA) | 1:1000 |
| B‐Raf rabbit mAb | CST (USA) | 1:1000 |
| MMP‐9 rabbit antibody | CST (USA) | 1:1000 |
| TGF‐β1 rabbit antibody | CST (USA) | 1:1000 |
| MDM2 rabbit mAb | CST (USA) | 1:1000 |
| Cleaved caspase‐3 rabbit mAb | CST (USA) | 1:1000 |
| Caspase‐3 rabbit antibody | CST (USA) | 1:1000 |
| GAPDH rabbit mAb | CST (USA) | 1:1000 |
| Second antibody | ||
| Anti‐rabbit IgG, HRP‐linked antibody | CST (USA) | 1:1000 |
TGF, transforming growth factor.
2.13. CKK8 assay
CCK8 (10 μL) and RPMI 1640 medium (90 μL) were added to each plate of cells, and incubated under 5% CO2 at 37°C. OD value was determined by microplate reader (BioTek Instruments, Winooski, VT, USA) at 0, 24 and 48 hours after transfection.
2.14. Wound‐healing assay for migration evaluation
Migration of cells was detected by wound‐healing assay as follows: cells were seeded into 6‐well plates and cultured until realizing 90% growth confluence, and adherent cell gaps were inflicted by scraping with a sterile pipette tip set as 0 hours. Cells were observed at 0 and 24 hours by microscope (Nikon, Tokyo, Japan), and migration ratio was calculated by dividing distance across the gap (gap closure) at 24 hours compared with that at 0 hours ranging from 0%‐100%.
2.15. Matrigel invasion assay
Upper site of 8‐μm pore and 6.5‐mm Transwell filter chamber (Corning, Corning, NY, USA) were coated with Matrigel basement membrane matrix (BD Biosciences, San Jose, CA, USA) for 2 hours at 37°C. Then, 5 × 10⁴ transfected SKOV3 cells were seeded in the top chamber of a Transwell filter. After culture for 24 hours, invasive cells on the lower side of the filter were fixed with 4% paraformaldehyde, then stained with 0.5% Crystal violet (Sigma‐Aldrich). The invasive cell count of each well was calculated by averaging the invasive cell count of 5 fields in each well with 100× magnification under a microscope.
2.16. AV/PI assay
Cells were digested by pancreatin and subsequently washed by PBS. After the cells were suspended in 100 μL binding buffer, 5 μL Annexin V‐FITC (AV) was added and let stand in the darkness for 15 minutes at room temperature. PI (5 μL) was added just before flow cytometry assay. Flow cytometry was used to analyze the results.
2.17. Statistics
Statistical analysis was done by SPSS 21.0 (IBM, Armonk, NY, USA) and GraphPad Prism 6.0 (GraphPad, La Jolla, CA, USA). Data were mainly presented as mean ± standard deviation or count (percentage). Comparison between 2 groups was determined by Wilcoxon signed rank‐sum test, Wilcoxon rank‐sum test or t test. Kaplan‐Meier (K‐M) curves and log‐rank test were carried out to compare OS between 2 groups. Univariate and multivariate Cox's proportional hazard regression test was carried out to analyze factors affecting OS. P < .05 was considered significant. *P < .05, **P < .01, **P < .001.
3. RESULTS
3.1. Patients’ characteristics
Sixty‐seven EOC patients aged 53.54 ± 12.31 years were included in this study, among which 6 (9.0%), 23 (34.3%) and 38 (56.7%) cases were at pathological grades G1, G2 and G3, respectively. Thirty‐nine cases (58.2%) were classified as serous cancer and 28 (41.8%) cases were other subtypes. As to clinical stage, 9 (13.4%), 17 (25.4%), 38 (56.7%) and 3 (4.5%) cases were at FIGO stages I, II, III and IV, respectively. Other clinical and pathological features of EOC patients are presented in Table 3.
Table 3.
Baseline characteristics of EOC patients
| EOC patients (N = 67) | |
|---|---|
| Age (years) | 53.54 ± 12.31 |
| Histological subtypea | |
| Serous (n/%) | 39 (58.2) |
| Others (n/%) | 28 (41.8) |
| Pathological grade | |
| G1 (n/%) | 6 (9.0) |
| G2 (n/%) | 23 (34.3) |
| G3 (n/%) | 38 (56.7) |
| Peritoneal cytologyb | |
| Positive (n/%) | 37 (63.8) |
| Negative (n/%) | 21 (36.2) |
| Tumor size (cm) | |
| ≥10 (n/%) | 32 (47.8) |
| <10 (n/%) | 35 (52.2) |
| Volume of ascites (mL) | |
| ≥100 (n/%) | 50 (74.6) |
| <100 (n/%) | 17 (25.4) |
| FIGO stage | |
| I (n/%) | 9 (13.4) |
| II (n/%) | 17 (25.4) |
| III (n/%) | 38 (56.7) |
| IV (n/%) | 3 (4.5) |
| CA125 (U/mL) | |
| ≥1000 (n/%) | 32 (47.8) |
| <1000 (n/%) | 35 (52.2) |
CA125, carbohydrate antigen 125; EOC, epithelial ovarian cancer; FIGO: International Federation of Gynecology and Obstetrics.
Data are presented as mean ± standard deviation or number (%).
Other pathological types included mucinous adenocarcinoma, endometrioid adenocarcinoma and mixed types.
58 patients had peritoneal cytology records.
3.2. Expressions of candidate lncRNAs between tumor tissue and paired adjacent tissue
Expressions of candidate lncRNAs including lncRNA RP11‐552M11.4, lncRNA RP1‐102K2.8 and lncRNA HOXA‐AS3 were detected by qPCR, which showed that lncRNA RP11‐552M11.4 was increased in tumor tissue compared with paired adjacent tissue (P < .001, Figure 1A), whereas no difference of lncRNA RP1‐102K2.8 (P = .489, Figure 1B) or lncRNA HOXA‐AS3 (P = .090, Figure 1C) expression between tumor tissue and paired adjacent tissue was observed.
Figure 1.

Expressions of candidate long non‐coding RNA (lncRNAs) in epithelial ovarian cancer tumor tissue and paired adjacent tissue. A, LncRNA RP11‐552M11.4 was increased in tumor tissue compared with paired adjacent tissue. No difference in (B) lncRNA RP1‐102K2.8 or (C) lncRNA HOXA‐AS3 between the 2 groups was observed. Comparison was determined by Wilcoxon signed rank‐sum test. P < .05 was considered significant
3.3. Correlation between expressions of candidate lncRNAs and clinicopathological features
As presented in Table 4, lncRNA RP11‐552M11.4 expression was elevated in EOC patients with pathological grade 3 (vs 1, 2) (P = .043), tumor size ≥10 cm (vs <10 cm) (P = .021) and FIGO stage III‐IV (vs I‐II) (P = .011), indicating that lncRNA RP11‐552M11.4 expression was positively correlated with tumor progression.
Table 4.
Comparison of candidate lncRNAs expressions between subgroups
| LncRNA RP11‐552M11.4 | LncRNA RP1‐102K2.8 | LncRNA HOXA‐AS3 | |
|---|---|---|---|
| Age (years) | |||
| ≥50 | 1.39 (1.00‐2.38) | 1.84 (0.80‐3.06) | 0.83 (0.42‐1.29) |
| <50 | 1.62 (1.08‐2.19) | 2.05 (1.36‐3.85) | 0.78 (0.42‐1.43) |
| P‐value | .713 | .125 | .873 |
| Histological subtypea | |||
| Serous | 1.35 (0.93‐2.52) | 2.07 (1.20‐3.70) | 0.81 (0.39‐1.31) |
| Others | 1.62 (1.07‐2.19) | 1.84 (0.72‐3.16) | 0.82 (0.42‐1.47) |
| P‐value | .652 | .469 | .809 |
| Pathological grade | |||
| G1‐G2 | 1.20 (0.81‐1.70) | 2.05 (1.05‐3.79) | 0.85 (0.42‐1.39) |
| G3 | 1.72 (1.30‐2.52) | 1.84 (0.90‐3.08) | 0.77 (0.40‐1.23) |
| P‐value | .043 | .188 | .830 |
| Peritoneal cytology | |||
| Positive | 1.57 (1.16‐2.58) | 2.00 (1.47‐3.55) | 0.69 (0.29‐1.29) |
| Negative | 1.29 (0.83‐1.79) | 1.36 (0.86‐2.23) | 0.97 (0.66‐1.35) |
| P‐value | .122 | .167 | .177 |
| Tumor size (cm) | |||
| ≥10 | 1.62 (1.14‐2.52) | 1.91 (1.00‐3.88) | 0.77 (0.40‐1.07) |
| <10 | 1.29 (0.90‐1.91) | 1.89 (0.98‐3.21) | 0.98 (0.43‐1.40) |
| P‐value | .021 | .581 | .539 |
| Volume of ascites (mL) | |||
| ≥100 | 1.58 (1.23‐2.47) | 1.86 (0.94‐3.85) | 0.81 (0.44‐1.32) |
| <100 | 1.02 (0.81‐1.70) | 2.03 (1.02‐2.99) | 0.79 (0.28‐1.57) |
| P‐value | .057 | .920 | .931 |
| FIGO stage | |||
| I‐II | 1.18 (0.77‐1.78) | 2.40 (1.02‐3.91) | 0.60 (0.24‐1.17) |
| III‐IV | 1.62 (1.28‐2.58) | 1.85 (0.90‐3.11) | 0.88 (0.46‐1.34) |
| P‐value | .011 | .589 | .054 |
| CA125 (U/mL) | |||
| ≥1000 | 1.21 (0.83‐2.04) | 1.56 (0.68‐2.67) | 0.81 (0.42‐1.17) |
| <1000 | 1.64 (1.29‐2.61) | 2.36 (1.40‐3.91) | 0.81 (0.40‐1.34) |
| P‐value | .118 | .036 | .624 |
Data are presented as median (25th‐75th). Comparison between 2 groups was determined by Wilcoxon rank‐sum test. P < .05 was considered significant. P value with bold font represents that P < .05.
CA125, carbohydrate antigen 125; FIGO, International Federation of Gynecology and Obstetrics.
Other pathological types included mucinous adenocarcinoma, endometrioid adenocarcinoma and mixed types.
LncRNA RP1‐102K2.8 expression was observed to be decreased only in patients with CA125 ≥1000 U/mL (vs <1000U/mL) (P = .036), whereas no correlation of its expression with other features was observed in EOC patients. As to lncRNA HOXA‐AS3, no correlation of its expression with any clinicopathological properties was discovered (Table 4).
3.4. Correlation between expressions of candidate lncRNAs and OS
K‐M curve showed that lncRNA RP11‐552M11.4 high expression (cut off by median value) was correlated with worse OS in EOC patients (P = .003, Figure 2A), whereas lncRNA RP1‐102K2.8 (P = .704, Figure 2B) or lncRNA HOXA‐AS3 (P = .924, Figure 2C) expression was not associated with OS.
Figure 2.
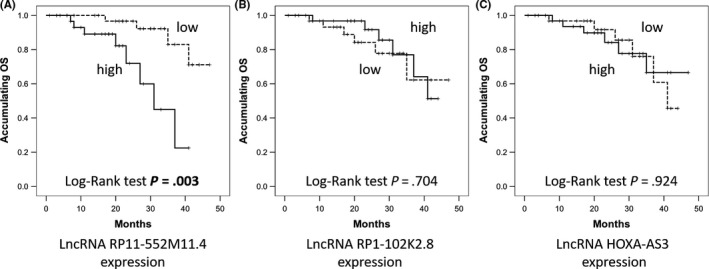
Kaplan‐Meier (K‐M) curves for overall survival (OS) analysis in epithelial ovarian cancer (EOC) patients. A, EOC patients with long non‐coding RNA (lncRNA) RP11‐552M11.4 high expression presented with worse OS compared to low expression. However, (B) lncRNA RP1‐102K2.8 and (C) lncRNA HOXA‐AS3 expressions did not affect the OS. LncRNAs were divided into high and low according to their median value in EOC patients accordingly. Comparison was determined by K‐M curves and log‐rank test. P < .05 was considered significant
Univariate Cox's proportional hazard regression (Table 5) indicated that lncRNA RP11‐552M11.4 high expression predicted unfavorable OS (P = .006, HR: 5.643, 95% CI 1.632‐19.518), whereas further analysis by multivariate Cox's proportional hazard regression showed that lncRNA RP11‐552M11.4 high expression presented with a trend for predicting worse OS independently but without statistical significance (P = .062, HR: 6.572, 95% CI 0.908‐47.576).
Table 5.
Analysis of factors affecting OS by Cox's proportional hazard regression
| Univariate Cox's proportional hazard regression | Multivariate Cox's proportional hazard regression | |||||||
|---|---|---|---|---|---|---|---|---|
| P‐value | HR | 95% CI | P‐value | HR | 95% CI | |||
| Lower | Higher | Lower | Higher | |||||
| Tumor‐LncRNA RP11‐552M11.4 high | .006 | 5.643 | 1.632 | 19.518 | .062 | 6.572 | 0.908 | 47.576 |
| Tumor‐LncRNA RP1‐102K2.8 high | .704 | 0.803 | 0.258 | 2.497 | ‐ | ‐ | ‐ | ‐ |
| Tumor‐LncRNA HOXA‐AS3 high | .924 | 0.946 | 0.305 | 2.939 | ‐ | ‐ | ‐ | ‐ |
| Age ≥50 years | .932 | 1.054 | 0.316 | 3.514 | ‐ | ‐ | ‐ | ‐ |
| Histological subtype serous (vs Others) | .342 | 1.891 | 0.508 | 7.036 | ‐ | ‐ | ‐ | ‐ |
| Pathological grade G3 (vs G1‐G2) | .018 | 4.989 | 1.320 | 18.864 | .121 | 5.359 | 0.643 | 44.696 |
| Peritoneal cytology positive | .066 | 4.404 | 0.908 | 21.357 | .304 | 2.765 | 0.398 | 19.209 |
| Tumor size ≥10 cm | .200 | 2.194 | 0.660 | 7.299 | ‐ | ‐ | ‐ | ‐ |
| Volume of ascites ≥100 mL | .162 | 2.682 | 0.674 | 10.680 | ‐ | ‐ | ‐ | ‐ |
| FIGO stage III‐IV (vs I‐II) | .016 | 5.729 | 1.390 | 23.602 | .020 | 16.773 | 1.549 | 181.675 |
| CA125 ≥1000 U/mL | .138 | 0.396 | 0.116 | 1.345 | ‐ | ‐ | ‐ | ‐ |
CA125, carbohydrate antigen 125; FIGO, International Federation of Gynecology and Obstetrics; OS, overall survival.
Data are presented as P‐value, HR (hazard ratio), 95% CI (confidence interval). Multivariate Cox's proportional hazard regression was carried out to analyze factors with a P‐value below .1 in univariate Cox analysis. P < .05 was considered significant. P value with bold font represents that P < .05. “‐”represents factors with P value below 0.1 in univariate Cox analysis, which were not included in the multivariate analysis.
3.5. LncRNA RP11‐552M11.4 expression after lncRNA RP11‐552M11.4(+/−) plasmid transfection into SKOV3 cells
Plasmid transfection efficiency was evaluated by dividing fluorescence positive cells with total cells in 10 fields of the microscope using Image J software (National Institutes of Health, which showed that transfection efficiencies were all above 90% in the NC1(+), LncRNA RP11‐552M11.4(+), NC2(−) and LncRNA RP11‐552M11.4(−) groups as presented in Figure 3A. After transfection of plasmids, lncRNA RP11‐552M11.4 expression was increased in the lncRNA RP11‐552M11.4(+) group compared with the NC1(+) group, whereas it was decreased in the lncRNA RP11‐552M11.4(−) group compared to the NC2(−) group (Figure 3B).
Figure 3.
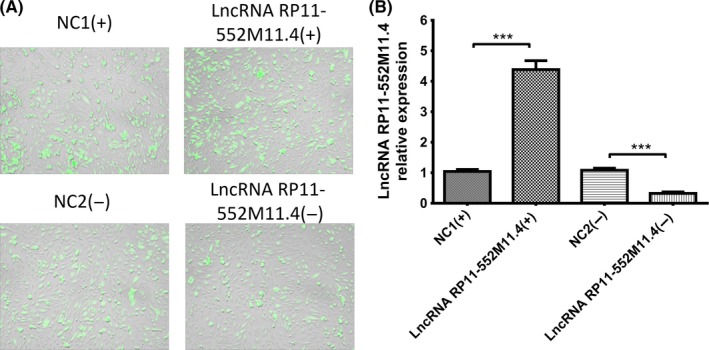
Long non‐coding RNA (lncRNA) RP11‐552M11.4 expressions after lncRNA RP11‐552M11.4 mimic and inhibitor plasmid transfection into SKOV3 cells. A, SKOV3 cells with transfected plasmids in 4 groups. B, LncRNA RP11‐552M11.4 expression was increased in the lncRNA RP11‐552M11.4(+) group and decreased in the lncRNA RP11‐552M11.4(−) group compared to NC (B). Comparison was determined by t test. ***P < .001
3.6. Cell proliferation, migration and invasion after lncRNA RP11‐552M11.4(+/−) plasmid transfection into SKOV3 cells
CCK8 assay indicated that cell proliferation was enhanced in the lncRNA RP11‐552M11.4(+) group compared with the NC1(+) group, whereas it was reduced in the lncRNA RP11‐552M11.4(−) group compared with the NC2(−) group (Figure 4A). Migration of cells was detected by wound‐healing assay, which showed that migration ratio was increased in the lncRNA RP11‐552M11.4(+) group compared with the NC1(+) group, whereas it was decreased in the lncRNA RP11‐552M11.4(−) group compared with the NC2(−) group (Figure 4B,C). As to cell invasion, Matrigel invasion assay was carried out which observed that invasive cell count was higher in the lncRNA RP11‐552M11.4(+) group than in the NC1(+) group, whereas it was lower in the lncRNA RP11‐552M11.4(−) group than in the NC2(−) group (Figure 4D,E).
Figure 4.
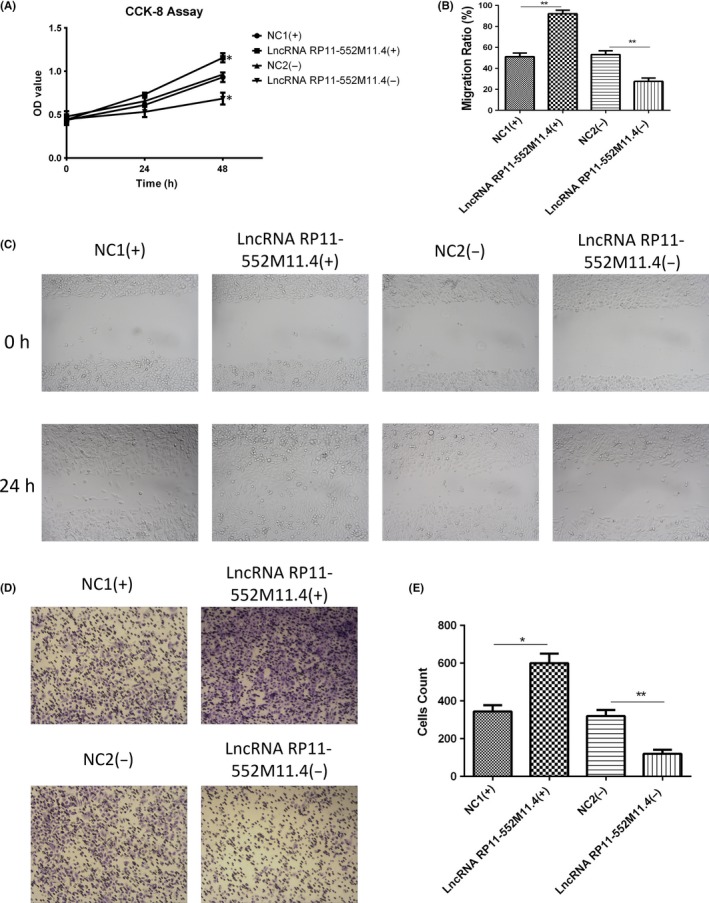
Cell proliferation, migration and invasion after long non‐coding RNA (lncRNA) RP11‐552M11.4 mimic and inhibitor plasmid transfection into SKOV3 cells. A, Cell proliferation, (B,C) migration and (D,E) invasion were all increased in the lncRNA RP11‐552M11.4(+) group compared with the NC1(+) group, and decreased in the lncRNA RP11‐552M11.4(−) group compared with the NC2(−) group. Comparison was determined by t test. *P < .05, **P < .01
3.7. Cells apoptosis after lncRNA RP11‐552M11.4(+/−) plasmid transfection into SKOV3 cells
AV/PI assay was carried out to detect cell apoptosis (Figure 5A), which showed that cell apoptosis rate was suppressed in the lncRNA RP11‐552M11.4(+) group compared with the NC1(+) group, whereas it was promoted in the lncRNA RP11‐552M11.4(−) group compared with the NC2(−) group (Figure 5B). Expressions of apoptotic markers (C‐Caspase3 and Bcl‐2 protein) in the 4 groups also indicated similar results (Figure 5C‐F).
Figure 5.
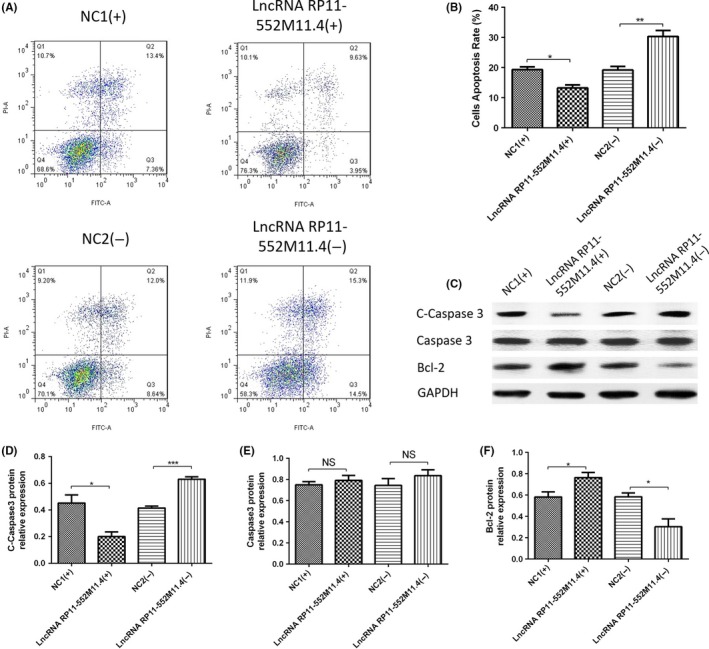
Cell apoptosis after long non‐coding RNA (lncRNA) RP11‐552M11.4 mimic and inhibitor plasmid transfection into SKOV3 cells. A, B, Annexin V/propidium iodide (AV/PI) assay showed that cell apoptosis rate was reduced in the lncRNA RP11‐552M11.4(+) group compared with the NC1(+) group, and enhanced in the lncRNA RP11‐552M11.4(−) group compared with the NC2(−) group. C‐F, C‐Caspase3 and Bcl‐2 protein expression also indicated that lncRNA 11‐552M11.4(+) decreased whereas lncRNA 11‐552M11.4(−) increased cell apoptosis compared with NC. Comparison was determined by t test. *P < .05, **P < .01, ***P < .001
3.8. Expressions of candidate target genes after lncRNA RP11‐552M11.4(+/−) plasmid transfection into SKOV3 cells
Five candidate target genes were predicted by combined analysis of RIsearch, RNAplex, LncTar databases and DisGeNET as described in Materials and Methods. Both mRNA and protein expressions of BRCA2 were observed to be decreased in the lncRNA RP11‐552M11.4(+) group compared with the NC1(+) group, whereas they increased in the lncRNA RP11‐552M11.4(−) group compared with the NC2(−) group (Figure 6A,F,K), suggesting reverse regulation of lncRNA RP11‐552M11.4 on BRCA2 expression in SKOV3 cells.
Figure 6.
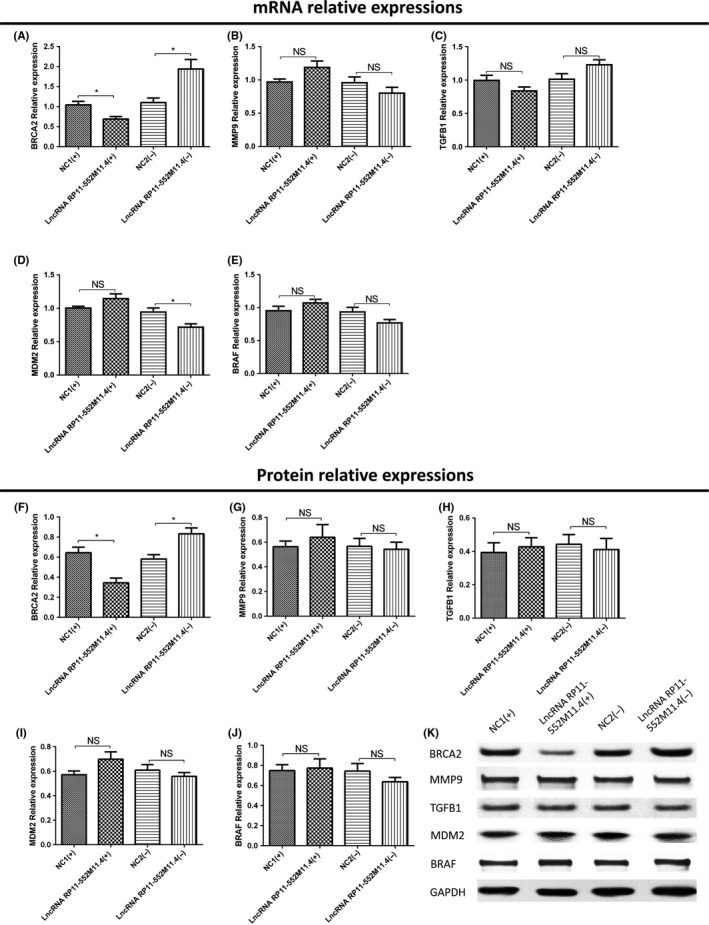
Candidate target gene expressions after long non‐coding RNA (lncRNA) RP11‐552M11.4 mimic and inhibitor plasmid transfection into SKOV3 cells. A, BRCA2 mRNA and (F,K) protein expressions were both observed to be decreased in the lncRNA RP11‐552M11.4(+) group compared with the NC1(+) group, whereas they increased in the lncRNA RP11‐552M11.4(−) group compared with the NC2(−) group. D, MDM2 mRNA expression was found to be decreased in the lncRNA RP11‐552M11.4(−) group compared with the NC2(−) group, whereas (I,K) no difference of protein expression was discovered. No difference of mRNA or protein expression was found in (B,G,K) MMP9, (C,H,K) TGFB1, or (E,J,K) BRAF between lncRNA RP11‐552M11.4(+) and NC1(+) groups, nor between lncRNA RP11‐552M11.4(−) and NC2(−) groups. Comparison was determined by t test. *P < .05. NS, not significant
MDM2 mRNA expression was found to be decreased in the lncRNA RP11‐552M11.4(−) group compared with the NC2(−) group, whereas it was similar between the lncRNA RP11‐552M11.4(+) group and NC1(+) group (Figure 6D). Also, no difference of MDM2 protein expression was discovered between the lncRNA RP11‐552M11.4(+) group and the NC2(+) group, nor between the lncRNA RP11‐552M11.4(−) group and the NC2(−) group (Figure 6I,K). In addition, no difference of mRNA or protein expression was found in MMP9, TGFB1, BRAF between the lncRNA RP11‐552M11.4(+) group and the NC2(+) group, nor between the lncRNA RP11‐552M11.4(−) group and the NC2(−) group (Figure 6B,C,E,G,H,J,K).
3.9. Expressions of lncRNA RP11‐552M11.4 and BRCA2 in rescue experiment in SKOV3 cells
In order to verify whether lncRNA RP11‐552M11.4 regulated SKOV3 cells by targeting BRCA2, rescue experiment was subsequently carried out. As presented in Figure 7, lncRNA RP11‐552M11.4 expression was decreased in the lncRNA RP11‐552M11.4(−) group compared with the NC(−) group, whereas no difference between the BRCA2(−) group and the NC(−) group, nor between the lncRNA RP11‐552M11.4(−) group and the BRCA2(−)/lncRNA RP11‐552M11.4(−) group was discovered (Figure 7A). This indicated that BRCA2 did not regulate the expression of lncRNA RP11‐552M11.4.
Figure 7.

Long non‐coding RNA (lncRNA) RP11‐552M11.4 and BRCA2 expressions in rescue experiment. A, After transfection of lncRNA BRCA2(−)/RP11‐552M11.4(−) into SKOV3 cells, we observed that lncRNA RP11‐552M11.4 expression was not affected by BRCA2(−), whereas (B‐D) the increase of BRCA2 mRNA and protein expressions by lncRNA RP11‐552M11.4(−) were attenuated by BRCA2(−). Comparison was determined by t test. *P < .05, **P < .01, ***P < .001
As to BRCA2, both mRNA and protein expressions were down‐regulated in the BRCA2(−) group compared with the NC(−) group, and in the BRCA2(−)/lncRNA RP11‐552M11.4(−) group compared with the lncRNA RP11‐552M11.4(−) group, whereas they were up‐regulated in the lncRNA RP11‐552M11.4(−) group compared with the NC(−) group (Figure 7B‐D). These data suggested that lncRNA RP11‐552M11.4(−) negatively regulated the expression of BRCA2, whereas BRCA2(−) attenuated the influence.
3.10. Cell proliferation, migration and invasion in rescue experiment in SKOV3 cells
CCK8 assay illustrated that cell proliferation was increased in the BRCA2(−) group compared with the NC(−) group, and in the BRCA2(−)/lncRNA RP11‐552M11.4(−) group compared with the lncRNA RP11‐552M11.4(−) group (Figure 8A). Wound‐healing assay showed that migration ratio was elevated in the BRCA2(−) group compared with the NC(−) group, and in the BRCA2(−)/lncRNA RP11‐552M11.4(−) group compared with the lncRNA RP11‐552M11.4(−) group (Figure 8B,C). Matrigel invasion assay showed that invasive cell count was higher in the BRCA2(−) group than in the NC(−) group, and in the BRCA2(−)/lncRNA RP11‐552M11.4(−) group compared with the lncRNA RP11‐552M11.4(−) group (Figure 8D,E). These results indicated that lncRNA RP11‐552M11.4 regulated SKOV3 cell proliferation, migration and invasion by regulating BRCA2.
Figure 8.
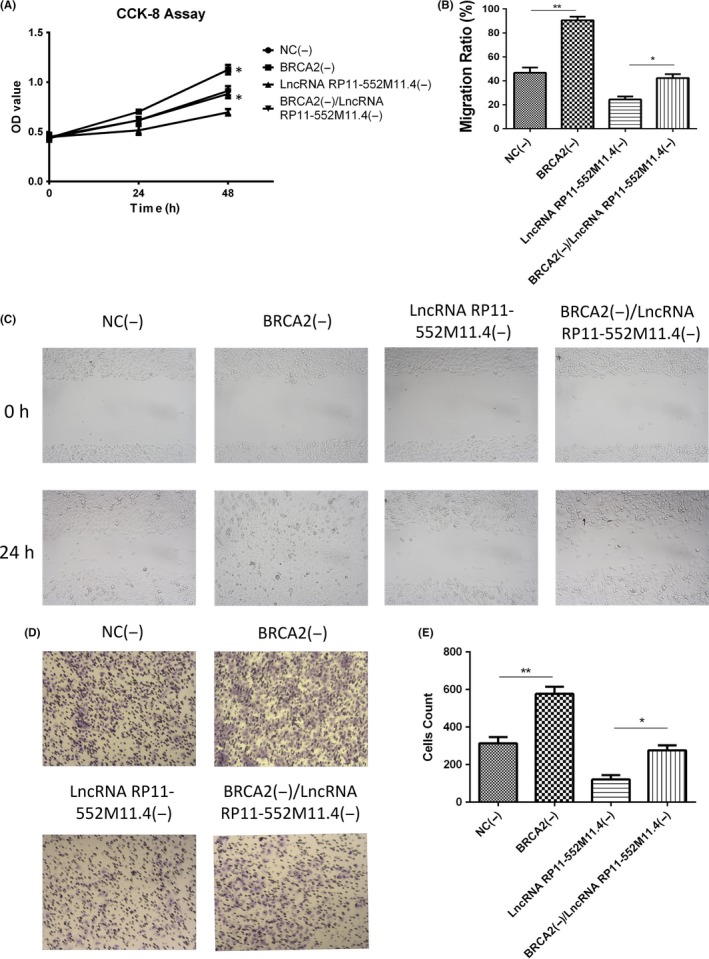
SKOV3 cell proliferation, migration and invasion in the rescue experiment. Cell (A) proliferation, (B,C) migration and (D,E) invasion were all increased in the BRCA2(−) group compared with the NC(−) group, and in the BRCA2(−)/lncRNA RP11‐552M11.4(−) group compared with the lncRNA RP11‐552M11.4(−) group. Comparison was determined by t test. *P < .05, **P < .01. lncRNA, long non‐coding RNA
3.11. Cell apoptosis in rescue experiment in SKOV3 cells
AV/PI assay showed that cell apoptosis rate was lower in the BRCA2(−) group than in the NC(−) group, and in the BRCA2(−)/lncRNA RP11‐552M11.4(−) group compared with the lncRNA RP11‐552M11.4(−) group (Figure 9A,B). Expressions of apoptotic markers (C‐Caspase3 and Bcl‐2 protein) in the 4 groups also validated the results (Figure 9C‐F). This indicated that lncRNA RP11‐552M11.4 regulated SKOV3 cells apoptosis by regulating BRCA2.
Figure 9.
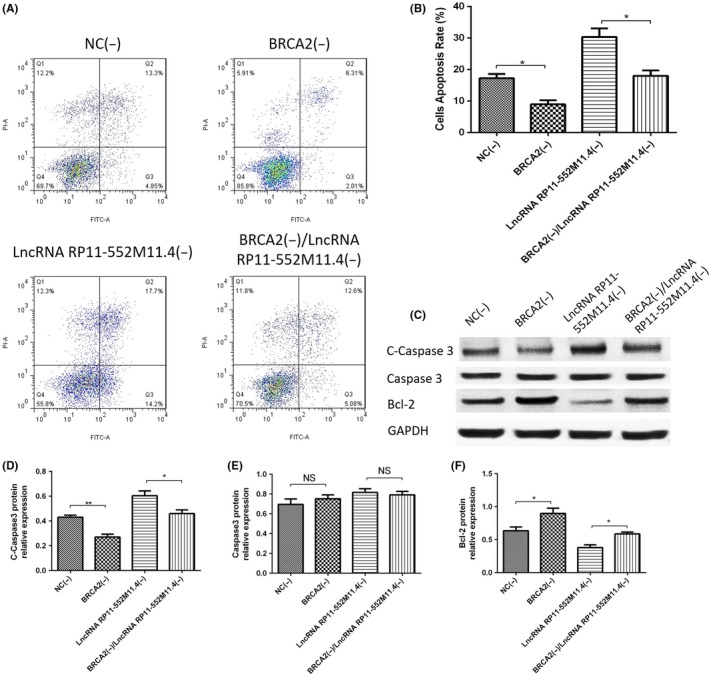
SKOV3 cell apoptosis in the rescue experiment. A, B, Annexin V/propidium iodide (AV/PI) assay showed that cell apoptosis rate was reduced in the BRCA2(−) group compared with the NC(−) group, and in the BRCA2(−)/lncRNA RP11‐552M11.4(−) group compared with the lncRNA RP11‐552M11.4(−) group. C, C‐Caspase3 and Bcl‐2 protein expression also indicated similar results. C‐F. C‐Caspase3 and Bcl‐2 protein expressions also indicated that BRCA2(−)/lncRNA RP11‐552M11.4(−) decreased cell apoptosis compared with lncRNA RP11‐552M11.4(−). Comparison was determined by t test. *P < .05, **P < .01. lncRNA, long non‐coding RNA
3.12. LncRNA RP11‐552M11.4 inhibits BRCA2 expression by interacting at binding site in SKOV3 cells
To verify whether BRCA2 was the direct target gene of lncRNA RP11‐552M11.4, the binding site was predicted (Figure 10A) and a luciferase report assay was conducted, which showed that lncRNA RP11‐552M11.4 decreased the ratio of Luc/Rluc in SKOV3 cells of constructs of BRCA2 with a binding site, whereas it did not affect Luc/Rluc in SKOV3 cells of constructs of BRCA2 without a binding site (Figure 10B). These results indicated that lncRNA RP11‐552M11.4 inhibits BRCA2 expression by interacting at a binding site in SKOV3 cells.
Figure 10.
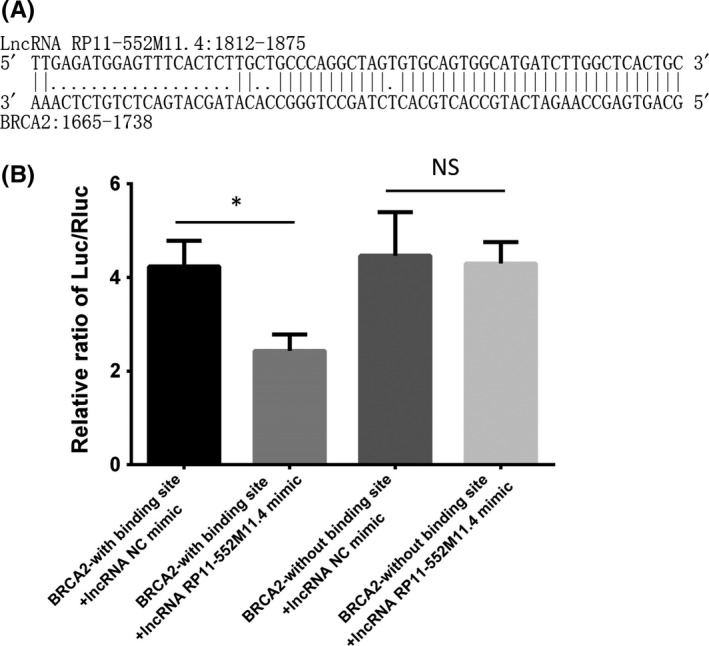
Long non‐coding RNA (lncRNA) RP11‐552M11.4 inhibits BRCA2 expression by interacting at binding site in SKOV3 cells. Binding site was predicted by bioinformatics as shown in (A), which indicates that lncRNA RP11‐552M11.4: 1812‐1875 binds with BRCA2: 1665‐1738. B, Luciferase report assay shows that the ratio of Luc/Rluc was decreased in the lncRNA RP11‐552M11.4 mimic group compared with NC mimic in SKOV3 cells of constructs of BRCA2 with binding site, but similar ratios between the 2 groups in SKOV3 cells of constructs of BRCA2 without binding site are seen. Comparison was determined by t test. *P < .05. NS, not significant
3.13. Further validation for the role of lncRNA RP11‐552M11.4 and BRCA2 in regulating A‐2780 cells
In order to further validate the function of lncRNA RP11‐552M11.4 in EOC cells through regulating BRCA2, we subsequently investigated the effect of lncRNA RP11‐552M11.4 and BRCA2 on cell proliferation and apoptosis in another human ovarian cancer cells (A‐2780). As presented in Figure 11, lncRNA RP11‐552M11.4 expression was increased in the lncRNA RP11‐552M11.4(+) group whereas it was decreased in the lncRNA RP11‐552M11.4(−) group compared to NC (Figure 11A) after transfection. Cell proliferation was observed to be elevated in the lncRNA RP11‐552M11.4(+) group whereas it was reduced in the lncRNA RP11‐552M11.4(−) group compared to NC (Figure 11B). And cell apoptosis was observed to be decreased in the lncRNA RP11‐552M11.4(+) group whereas it was increased in the lncRNA RP11‐552M11.4(−) group compared to NC (Figure 11C,D). These results indicate that lncRNA RP11‐552M11.4 improved A‐2780 cell proliferation and inhibited cell apoptosis.
Figure 11.
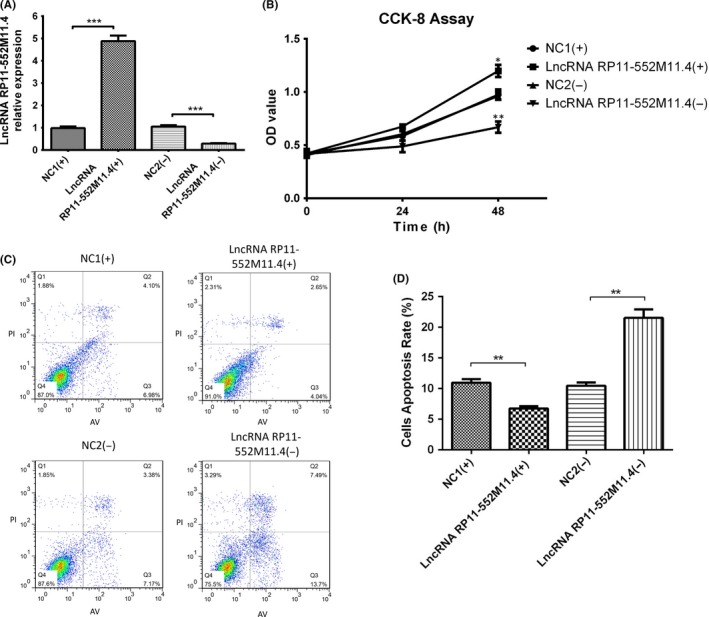
A, Cell proliferation and apoptosis long non‐coding RNA (lncRNA) RP11‐552M11.4 mimic and inhibitor plasmid transfection into A‐2780 cells. Post plasmid transfection into A‐2780 cells, lncRNA RP11‐552M11.4 expression was increased in the lncRNA RP11‐552M11.4(+) group and decreased in the lncRNA RP11‐552M11.4(−) group compared to NC. B, Cell proliferation was enhanced in the lncRNA RP11‐552M11.4(+) group whereas it was reduced in the lncRNA RP11‐552M11.4(−) group compared to NC at 48‐h post‐transfection. C, D, Also, cell apoptosis rate was lower in the lncRNA RP11‐552M11.4(+) group whereas it was higher in the lncRNA RP11‐552M11.4(−) group compared to NC. Comparison was determined by t test. *P < .05, **P < .01, ***P < .001
After lncRNA RP11‐552M11.4(−) and BRCA2(−) plasmid transfection, we found that lncRNA RP11‐552M11.4 expression was not regulated by BRCA2 (Figure 12A), whereas lncRNA RP11‐552M11.4 reversely regulated both mRNA and protein expressions of BRCA2 in A‐2780 cells (Figure 12B‐D). At 48‐hours post‐transfection, cell proliferation was increased in the BRCA2(−) group whereas it was decreased in the lncRNA RP11‐552M11.4(−) group compared with the NC(−) group and, most importantly, the BRCA2(−)/lncRNA RP11‐552M11.4(−) group presented with increased cell proliferation compared to the lncRNA RP11‐552M11.4(−) group (Figure 12E). As to cell apoptosis, the BRCA2(−)/lncRNA RP11‐552M11.4(−) group also showed lower cell proliferation compared to the lncRNA RP11‐552M11.4(−) group (Figure 12F,G). These results further validated that lncRNA RP11‐552M11.4 functioned in ovarian cancer cells by regulating BRCA2.
Figure 12.
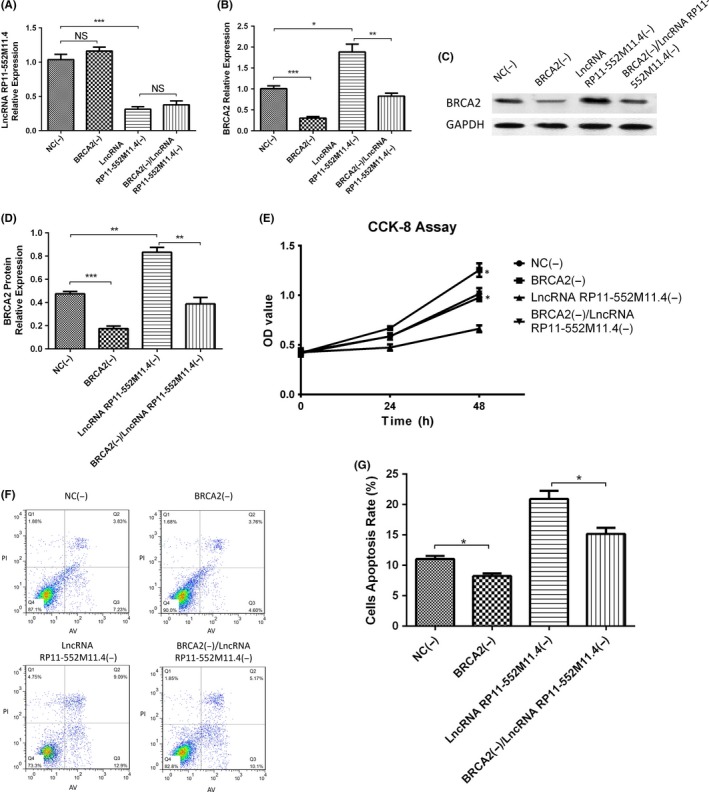
Cell proliferation and apoptosis after long non‐coding RNA (lncRNA) RP11‐552M11.4(−) and BRCA2(−) plasmid transfection into A‐2780 cells. A, LncRNA RP11‐552M11.4 expression was not affected by BRCA2(−).B, C, Increase of both mRNA and protein expressions of BRCA2 by lncRNA RP11‐552M11.4(−) was attenuated by BRCA2(−).D, At 48‐h post‐transfection, BRCA2(−) increased cell proliferation whereas lncRNA RP11‐552M11.4(−) decreased cell proliferation compared with NC(−), and cell proliferation was elevated in BRCA2(−)/lncRNA RP11‐552M11.4(−) compared with lncRNA RP11‐552M11.4(−). (E,F) In addition, cell apoptosis was reduced in BRCA2(−)/lncRNA RP11‐552M11.4(−) compared with lncRNA RP11‐552M11.4(−). These results implied that lncRNA RP11‐552M11.4 promoted cell proliferation and repressed cell apoptosis by regulating BRCA2. Comparison was determined by t test. *P < .05, **P < .01, ***P < .001. NS, not significant
3.14. Effect of lncRNA RP11‐552M11.4 on cell functions in normal ovarian epithelial cells
After lncRNA RP11‐552M11.4 mimic and inhibitor plasmid transfection, IOSE80 cell proliferation (Figure 13A), migration (Figure 13B,C) and invasion (Figure 13D,E) were increased, whereas cell apoptosis rate (Figure 13F,G) was decreased in the lncRNA RP11‐552M11.4(+) group compared with the NC1(+) group; however, no differences of these cell functions were discovered between the lncRNA RP11‐552M11.4(−) group compared with the NC1(−) group (Figure 13). These results indicated that up‐regulating lncRNA RP11‐552M11.3 had the potential to promote normal ovarian epithelial cells to cancer‐like cells.
Figure 13.
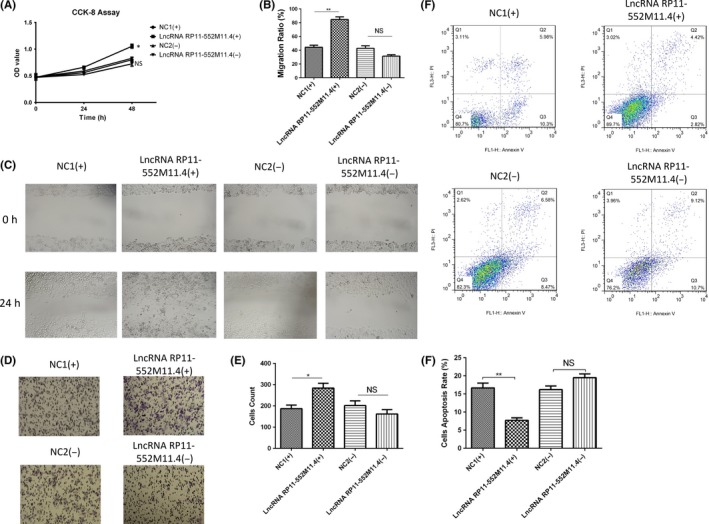
Cell proliferation, migration, invasion and apoptosis after long non‐coding RNA (lncRNA) RP11‐552M11.4 mimic and inhibitor plasmid transfection into IOSE80 cells. IOSE80 cells were further nurtured to detect the effect of lncRNA RP11‐552M11.4 on normal ovarian epithelial cell functions, which showed that cell (A) proliferation, (B,C) migration and (D,E) invasion were increased, whereas (F,G) cell apoptosis rate was decreased in the lncRNA RP11‐552M11.4(+) group compared with the NC1(+) group. However, no differences in cell (A) proliferation, (B,C) migration, (D,E) invasion or (F,G) cell apoptosis rate were discovered between the lncRNA RP11‐552M11.4(−) group compared with the NC1(−) group. Comparison was determined by t test. *P < .05, **P < .01. NS, not significant
4. DISCUSSION
In this present study, we found that: (i) lncRNA RP11‐552M11.4 expression was up‐regulated in tumor tissue compared to paired adjacent tissue, and positively correlated with advanced clinicopathological features and worse OS in EOC patients; (ii) lncRNA RP11‐552M11.4 promoted SKOV3 cell proliferation, migration and invasion while suppressing cell apoptosis by targeting BRCA2; (iii) subsequent experiments in A‐2780 cells further validated that lncRNA RP11‐552M11.4 regulated ovarian cancer cell functions by targeting BRCA2; and (iv) up‐regulating lncRNA RP11‐552M11.3 had the potential to promote normal ovarian epithelial cells to cancer‐like cells.
LncRNA, a diverse class of molecules lacking potential for coding protein, comprises more than 200 nucleotides and is characterized by unique regulatory mechanisms including alternative forms of biogenesis, cis‐regulatory activities and functional structured RNA domains.11 A large number of studies have shown that lncRNAs regulate cell functions such as differentiation, proliferation, apoptosis and so on in various diseases especially in cancers.22, 23 Until now, more than 2000 dysregulated lncRNAs have been reported in cancers including 2114 in renal carcinoma, 1760 in thyroid cancer, 1523 in breast cancer and 1234 in lung adenocarcinoma by systemic analysis of lncRNAs profiling data; however, the detailed mechanisms of these dysregulated lncRNAs are largely unknown.12
A previous study observed 663 dysregulated lncRNAs in EOC patients compared to benign or normal controls determined by Arraystar Human lncRNA Microarray V3.0.24 Another recent study detected lncRNAs expression profiles in 5 paired human EOC tissues and adjacent non‐tumor tissue samples by Arraystar Human LncRNA Microarray V3.0, and discovered 672 up‐regulated and 549 down‐regulated lncRNAs in EOC tissue.25 These results indicate that abnormally expressed lncRNAs profiles are involved in EOC development. Some studies also show that expressions of several lncRNAs correlate with clinical and pathological features in EOC patients such as lncRNA NBAT‐1 expression is observed to be correlated with higher FIGO stage in EOC patients,26 whereas lncRNA TUBA4B level is negatively associated with pathological grade, FIGO stage and lymph node metastases in EOC patients.27 These results suggest that lncRNAs contribute to the progression of EOC. In addition, several lncRNAs are also shown to be independent biomarkers for prognosis in EOC patients, such as lncRNA CCAT1, lncRNA MALAT1 and lncRNA ABHD11‐AS1.27, 28, 29 All these data suggest that lncRNA has a crucial role in EOC development, progression and prognosis.
LncRNA RP11‐552M11.4 is located on chromosome 1: 111,438,638‐111,441,364, with ensemble ID ENST00000445680 and ensemble transcript ID ENST 00000445680.1. No previous study has shown the role of lncRNA RP11‐552M11.4 in cancers. In the present study, we found that lncRNA RP11‐552M11.4 expression was increased in tumor tissue compared with adjacent non‐tumor tissue, and was positively correlated with pathological grade, tumor size and FIGO stage in EOC patients. Most interestingly, we observed that lncRNA RP11‐552M11.4 high expression correlated with unfavorable OS even though it was not an independent prognostic factor. These results indicate that lncRNA RP11‐552M11.4 could serve as a novel biomarker for tumor diagnosis and prognosis in EOC patients. However, we investigated the role of lncRNA RP11‐552M11.4 in EOC patients with only a relative small sample; thus further validation in EOC patients with a larger sample size is needed.
Several reports show that lncRNA regulates functions of ovarian cancer cells by targeting microRNAs or mRNAs. Knockdown of lncRNA AB073614 expression suppresses cell proliferation and invasion in ovarian cancer cell lines (HO‐8910 and OVCAR3 cells); meanwhile, it increases cell apoptosis, which may result from its regulation on the ERK1/2 and AKT‐mediated signaling pathway.15 Another study showed that down‐regulation of lncRNA MALAT1 inhibits cell viability, migration and invasion in ovarian cancer cell lines by directly binding miR‐200c.30 Also, a recent study observed a critical role of lncRNA CCAT1‐miR‐152/miR‐130b‐ADAM17/WNT1/STAT3/ZEB1 regulatory network in EOC cell metastasis.28 These data indicate that lncRNA contributes to ovarian cancer pathology through regulating cancer cell proliferation, migration, invasion and apoptosis by promoting or inhibiting miRNA/mRNA expressions.
In our study, we found that lncRNA RP11‐552M11.4 promoted proliferation, migration and invasion while inhibiting apoptosis of ovarian cancer cells, which was in line with the clinical findings that lncRNA RP11‐552M11.4 was an oncogene that correlated with tumor progression and worse prognosis. Furthermore, in order to further explore the molecular mechanism of lncRNA RP11‐552M11.4 on regulating ovarian cancer cell functions, we next predicted 5 candidate target genes by combined analysis of RIsearch, RNAplex, LncTar and DisGeNET databases as described in Materials and Methods, and determined their expressions after lncRNA RP11‐552M11.4 mimic and inhibitor plasmids transfection. And we found BRCA2 mRNA and protein expressions were both reversely regulated by lncRNA RP11‐552M11.4, but MMP9, TGFB1, MDM2, BRAF were not affected by lncRNA RP11‐552M11.4. These results implied that lncRNA RP11‐552M11.4 might regulate ovarian cancer cell functions by targeting BRCA2.
BRCA2, as a critical tumor suppressor gene, is a key element in EOC pathogenesis, which is responsible for DNA repair by binding single‐strand DNA and directly interacting with the recombinase RAD51 to stimulate strand invasion which is a vital step of homologous recombination.31 Hundreds of mutations in the BRCA2 gene have been identified, among which many cause an increased risk of cancer on account of the protein product of the BRCA2 gene being abnormal and not functioning properly.32, 33 Also, defective BRCA2 protein is unable to repair DNA damage that occurs throughout the genome. As a result, there is an increase in mutations as a result of error‐prone translesion synthesis past unrepaired DNA damage, and some of these mutations can cause cells to divide in an uncontrolled way to form a tumor.34 Also, the predominant allele has a normal, tumor‐suppressive function, whereas high‐penetrance mutations in these genes cause a loss of tumor‐suppressive function which correlates with an increased risk of cancer.35 Combining the aforementioned descriptions, BRCA2 (wild type) is a human tumor‐suppressor gene, and several BRCA2 mutations contribute to cancer development.32, 33, 34, 36, 37, 38 In cancers apart from ovarian cancers, down‐regulation of BRCA2 promoted prostate cancer cell proliferation by interacting with extracellular matrix protein collagen type I,38 and promoted prostate cancer cell invasion through up‐regulation of MMP9 by inhibition of PI3‐kinase/AKT and activation of MAPK/ERK;39 BRAC2 was discovered to be decreased in laryngeal squamous cell carcinoma tissues compared with controls, and negatively correlated with T stage.40 In addition, BRCA2 low expression combined with BRCA1 and Rad51 low expressions correlated with advanced disease and worse prognosis in early breast cancer patients.41 As for ovarian cancers, BRCA2 inhibited ovarian cancer cell metastasis by regulating metastatic promoting markers (SLUG, FBN1, and MMP2, ‐9, ‐13), and overexpression of BRCA2 correlated with favorable DFS and OS in ovarian cancer patients.42 Another study also showed that BRCA2 expression is associated with early‐stage disease, low ascites incidence, younger age at diagnosis and low‐grade tumors in endometrioid ovarian carcinoma patients.43 This indicates the tumor suppressor role of BRCA2 in several cancers including ovarian cancer. In order to verify the hypothesis that lncRNA RP11‐552M11.4 may regulate ovarian cancer cell functions by targeting BRCA2, we next carried out the rescue experiment, which showed that lncRNA RP11‐552M11.4 increased cell proliferation, migration and invasion, and inhibited cell apoptosis by suppressing BRCA2. The following luciferase reporter assay further confirmed that lncRNA RP11‐552M11.4 bound with BRCA2 in ovarian cancer cells.
In conclusion, lncRNA RP11‐552M11.4 correlates with advanced clinicopathological features and worse OS in EOC patients, and it promotes cell proliferation, migration, and invasion, and inhibits cell apoptosis by downregulating BRCA2 in ovarian cancer cells.
CONFLICT OF INTEREST
Authors declare no conflicts of interest for this article.
ACKNOWLEDGMENT
This study was supported by Heilongjiang Province Department of Education (No. 12531356).
Huang K, Geng J, Wang J. Long non‐coding RNA RP11‐552M11.4 promotes cells proliferation, migration and invasion by targeting BRCA2 in ovarian cancer. Cancer Sci. 2018;109:1428–1446. https://doi.org/10.1111/cas.13552
Funding information
Heilongjiang Province Department of Education (12531356)
REFERENCES
- 1. Jayson GC, Kohn EC, Kitchener HC, Ledermann JA. Ovarian cancer. Lancet. 2014;384:1376‐1388. [DOI] [PubMed] [Google Scholar]
- 2. Torre LA, Bray F, Siegel RL, Ferlay J, Lortet‐Tieulent J, Jemal A. Global cancer statistics, 2012. CA Cancer J Clin. 2015;65:87‐108. [DOI] [PubMed] [Google Scholar]
- 3. Bowtell DD, Bohm S, Ahmed AA, et al. Rethinking ovarian cancer II: reducing mortality from high‐grade serous ovarian cancer. Nat Rev Cancer. 2015;15:668‐679. [DOI] [PMC free article] [PubMed] [Google Scholar]
- 4. Narod S. Can advanced‐stage ovarian cancer be cured? Nat Rev Clin Oncol. 2016;13:255‐261. [DOI] [PubMed] [Google Scholar]
- 5. Clarke‐Pearson DL. Clinical practice. Screening for ovarian cancer. N Engl J Med. 2009;361:170‐177. [DOI] [PubMed] [Google Scholar]
- 6. Sundar S, Neal RD, Kehoe S. Diagnosis of ovarian cancer. BMJ. 2015;351:h4443. [DOI] [PubMed] [Google Scholar]
- 7. Nick AM, Coleman RL, Ramirez PT, Sood AK. A framework for a personalized surgical approach to ovarian cancer. Nat Rev Clin Oncol. 2015;12:239‐245. [DOI] [PMC free article] [PubMed] [Google Scholar]
- 8. Sapiezynski J, Taratula O, Rodriguez‐Rodriguez L, Minko T. Precision targeted therapy of ovarian cancer. J Control Release. 2016;243:250‐268. [DOI] [PMC free article] [PubMed] [Google Scholar]
- 9. Lim W, Song G. Discovery of prognostic factors for diagnosis and treatment of epithelial‐derived ovarian cancer from laying hens. J Cancer Prev. 2013;18:209‐220. [DOI] [PMC free article] [PubMed] [Google Scholar]
- 10. Gibson SJ, Fleming GF, Temkin SM, Chase DM. The application and outcome of standard of care treatment in elderly women with ovarian cancer: a literature review over the last 10 years. Front Oncol. 2016;6:63. [DOI] [PMC free article] [PubMed] [Google Scholar]
- 11. Quinn JJ, Chang HY. Unique features of long non‐coding RNA biogenesis and function. Nat Rev Genet. 2016;17:47‐62. [DOI] [PubMed] [Google Scholar]
- 12. Evans JR, Feng FY, Chinnaiyan AM. The bright side of dark matter: lncRNAs in cancer. J Clin Invest. 2016;126:2775‐2782. [DOI] [PMC free article] [PubMed] [Google Scholar]
- 13. Schmitt AM, Chang HY. Long noncoding RNAs in cancer pathways. Cancer Cell. 2016;29:452‐463. [DOI] [PMC free article] [PubMed] [Google Scholar]
- 14. Fu LL, Li CJ, Xu Y, et al. Role of lncRNAs as novel biomarkers and therapeutic targets in ovarian cancer. Crit Rev Eukaryot Gene Expr. 2017;27:183‐195. [DOI] [PubMed] [Google Scholar]
- 15. Cheng Z, Guo J, Chen L, Luo N, Yang W, Qu X. A long noncoding RNA AB073614 promotes tumorigenesis and predicts poor prognosis in ovarian cancer. Oncotarget. 2015;6:25381‐25389. [DOI] [PMC free article] [PubMed] [Google Scholar]
- 16. Gao Y, Meng H, Liu S, et al. LncRNA‐HOST2 regulates cell biological behaviors in epithelial ovarian cancer through a mechanism involving microRNA let‐7b. Hum Mol Genet. 2015;24:841‐852. [DOI] [PubMed] [Google Scholar]
- 17. Ozes AR, Miller DF, Ozes ON, et al. NF‐kappaB‐HOTAIR axis links DNA damage response, chemoresistance and cellular senescence in ovarian cancer. Oncogene. 2016;35:5350‐5361. [DOI] [PMC free article] [PubMed] [Google Scholar]
- 18. Wenzel A, Akbasli E, Gorodkin J. RIsearch: fast RNA‐RNA interaction search using a simplified nearest‐neighbor energy model. Bioinformatics. 2012;28:2738‐2746. [DOI] [PMC free article] [PubMed] [Google Scholar]
- 19. Tafer H, Hofacker IL. RNAplex: a fast tool for RNA‐RNA interaction search. Bioinformatics. 2008;24:2657‐2663. [DOI] [PubMed] [Google Scholar]
- 20. Li J, Ma W, Zeng P, et al. LncTar: a tool for predicting the RNA targets of long noncoding RNAs. Brief Bioinform. 2015;16:806‐812. [DOI] [PubMed] [Google Scholar]
- 21. Pinero J, Bravo A, Queralt‐Rosinach N, et al. DisGeNET: a comprehensive platform integrating information on human disease‐associated genes and variants. Nucleic Acids Res. 2017;45:D833‐D839. [DOI] [PMC free article] [PubMed] [Google Scholar]
- 22. Fatica A, Bozzoni I. Long non‐coding RNAs: new players in cell differentiation and development. Nat Rev Genet. 2014;15:7‐21. [DOI] [PubMed] [Google Scholar]
- 23. Beermann J, Piccoli MT, Viereck J, Thum T. Non‐coding RNAs in development and disease: background, mechanisms, and therapeutic approaches. Physiol Rev. 2016;96:1297‐1325. [DOI] [PubMed] [Google Scholar]
- 24. Wang H, Fu Z, Dai C, et al. LncRNAs expression profiling in normal ovary, benign ovarian cyst and malignant epithelial ovarian cancer. Sci Rep. 2016;6:38983. [DOI] [PMC free article] [PubMed] [Google Scholar]
- 25. Ding Y, Yang DZ, Zhai YN, et al. Microarray expression profiling of long non‐coding RNAs in epithelial ovarian cancer. Oncol Lett. 2017;14:2523‐2530. [DOI] [PMC free article] [PubMed] [Google Scholar]
- 26. Yan C, Jiang Y, Wan Y, et al. Long noncoding RNA NBAT‐1 suppresses tumorigenesis and predicts favorable prognosis in ovarian cancer. Onco Targets Ther. 2017;10:1993‐2002. [DOI] [PMC free article] [PubMed] [Google Scholar]
- 27. Zhu FF, Zheng FY, Wang HO, Zheng JJ, Zhang Q. Downregulation of lncRNA TUBA4B is associated with poor prognosis for epithelial ovarian cancer. Pathol Oncol Res. 2018;24:419‐425. [DOI] [PubMed] [Google Scholar]
- 28. Cao Y, Shi H, Ren F, Jia Y, Zhang R. Long non‐coding RNA CCAT1 promotes metastasis and poor prognosis in epithelial ovarian cancer. Exp Cell Res. 2017;359:185‐194. [DOI] [PubMed] [Google Scholar]
- 29. Jin Y, Feng SJ, Qiu S, Shao N, Zheng JH. LncRNA MALAT1 promotes proliferation and metastasis in epithelial ovarian cancer via the PI3K‐AKT pathway. Eur Rev Med Pharmacol Sci. 2017;21:3176‐3184. [PubMed] [Google Scholar]
- 30. Pa M, Naizaer G, Seyiti A, Kuerbang G. Long noncoding RNA MALAT1 functions as a sponge of MiR‐200c in ovarian cancer. Oncol Res. 2017. https://doi.org/10.3727/096504017X15049198963076. [Epub ahead of print] [DOI] [PubMed] [Google Scholar]
- 31. George A, Kaye S, Banerjee S. Delivering widespread BRCA testing and PARP inhibition to patients with ovarian cancer. Nat Rev Clin Oncol. 2017;14:284‐296. [DOI] [PubMed] [Google Scholar]
- 32. Fackenthal JD, Olopade OI. Breast cancer risk associated with BRCA1 and BRCA2 in diverse populations. Nat Rev Cancer. 2007;7:937‐948. [DOI] [PubMed] [Google Scholar]
- 33. Liede A, Karlan BY, Narod SA. Cancer risks for male carriers of germline mutations in BRCA1 or BRCA2: a review of the literature. J Clin Oncol. 2004;22:735‐742. [DOI] [PubMed] [Google Scholar]
- 34. Venkitaraman AR. Cancer susceptibility and the functions of BRCA1 and BRCA2. Cell. 2002;108:171‐182. [DOI] [PubMed] [Google Scholar]
- 35. O'Donovan PJ, Livingston DM. BRCA1 and BRCA2: breast/ovarian cancer susceptibility gene products and participants in DNA double‐strand break repair. Carcinogenesis. 2010;31:961‐967. [DOI] [PubMed] [Google Scholar]
- 36. Duncan JA, Reeves JR, Cooke TG. BRCA1 and BRCA2 proteins: roles in health and disease. Mol Pathol. 1998;51:237‐247. [DOI] [PMC free article] [PubMed] [Google Scholar]
- 37. Yoshida K, Miki Y. Role of BRCA1 and BRCA2 as regulators of DNA repair, transcription, and cell cycle in response to DNA damage. Cancer Sci. 2004;95:866‐871. [DOI] [PMC free article] [PubMed] [Google Scholar]
- 38. Moro L, Arbini AA, Marra E, Greco M. Down‐regulation of BRCA2 expression by collagen type I promotes prostate cancer cell proliferation. J Biol Chem. 2005;280:22482‐22491. [DOI] [PubMed] [Google Scholar]
- 39. Moro L, Arbini AA, Yao JL, di Sant'Agnese PA, Marra E, Greco M. Loss of BRCA2 promotes prostate cancer cell invasion through up‐regulation of matrix metalloproteinase‐9. Cancer Sci. 2008;99:553‐563. [DOI] [PMC free article] [PubMed] [Google Scholar]
- 40. He X, Liu C, Wang Z, Gong Z, Hu G. [Expression of BRCA2 in tumor tissues in patients with laryngeal squamous cell carcinoma and its clinical significance]. Xi Bao Yu Fen Zi Mian Yi Xue Za Zhi. 2017;33:1133‐1137. [PubMed] [Google Scholar]
- 41. Soderlund K, Skoog L, Fornander T, Askmalm MS. The BRCA1/BRCA2/Rad51 complex is a prognostic and predictive factor in early breast cancer. Radiother Oncol. 2007;84:242‐251. [DOI] [PubMed] [Google Scholar]
- 42. Wang Z, Liu Y, Lu L, et al. Fibrillin‐1, induced by Aurora‐A but inhibited by BRCA2, promotes ovarian cancer metastasis. Oncotarget. 2015;6:6670‐6683. [DOI] [PMC free article] [PubMed] [Google Scholar]
- 43. Yang F, Guo X, Yang G, Rosen DG, Liu J. AURKA and BRCA2 expression highly correlate with prognosis of endometrioid ovarian carcinoma. Mod Pathol. 2011;24:836‐845. [DOI] [PMC free article] [PubMed] [Google Scholar]


