

Abstract
Nasopharyngeal carcinoma (NPC) is etiologically associated with Epstein–Barr virus (EBV) infection and is known to be highly vascularized. Previous studies have suggested that EBV oncoproteins contribute to NPC angiogenesis. However, the regulatory network of EBV in angiogenesis still remains elusive. Herein, we reveal a novel mechanism of EBV‐induced angiogenesis in NPC. First, we showed that EBV‐infected NPC cell lines generated larger tumors with more microvessels in mouse xenograft models. Subsequent proteomic analysis revealed that EBV infection increased the expression of a series of angiogenic factors, including chemokine (C‐C motif) ligand 5 (CCL5). We then proved that CCL5 was a target of EBV in inducing tumor angiogenesis and growth. Further investigation through transcriptome analysis indicated that the pro‐angiogenic function of CCL5 might be mediated by the PI3K/AKT pathway. Furthermore, we confirmed that activation of the PI3K/AKT and hypoxia‐inducible factor‐1α pathways was essential for CCL5‐promoted angiogenesis. Finally, the immunohistochemical analysis of human NPC specimens also showed that CCL5 was correlated with angiogenesis. Taken together, our study identifies CCL5 as a key EBV‐regulated molecular driver that promotes NPC angiogenesis, suggesting it as a potential therapeutic target.
Keywords: angiogenesis, CCL5, Epstein–Barr virus, nasopharyngeal carcinoma, PI3K/AKT
Abbreviations
- ANG
human angiogenin
- CCL
chemokine (C‐C motif) ligand
- CCR
chemokine (C‐C motif) receptor
- CM
conditioned media
- EBER
EBV‐encoded small RNA
- EBNA1
EBV‐encoded nuclear antigen_1
- EBV
Epstein–Barr virus
- HIF
hypoxia‐inducible factor
- KEGG
Kyoto Encyclopedia of Genes and Genomes
- LMP
latent membrane protein
- NPC
nasopharyngeal carcinoma
- qPCR
quantitative real‐time PCR
- SYSUCC
Sun Yat‐sen University Cancer Center
- TMT
tandem mass tag
- VEGF
vascular endothelial growth factor
1. INTRODUCTION
Nasopharyngeal carcinoma is one of the most common head and neck cancers in South‐East Asia. Most patients with the disease are diagnosed only when the tumor has reached an advanced stage (stages III and IV),1 which is highly vascularized. Targeting angiogenic factors (such as VEGF or epidermal growth factor), antivascular agents have proved to be effective in NPC treatment.2 In recent years, anti‐epidermal growth factor receptor chimeric antibody, cetuximab, has been approved by the FDA for treating advanced NPC.3 However, not all patients would benefit from such treatment.4 Therefore, exploring the molecular mechanism underlying NPC angiogenesis is essential to developing more effective antivascular agents for NPC treatment.
Epstein–Barr virus (EBV) infection has been widely studied as an etiological factor in NPC. All EBV‐infected NPC cells show type II latency, with expression of EBER, LMP1, LMP2A, LMP2B, EBNA1, and BamHI A rightward transcript microRNAs.5 These viral genes induce multiple oncogenic properties, including tumor angiogenesis.5 O'Neil et al6 reported that EBNA1 enhances angiogenesis in vitro by modulating the activator protein‐1 pathway in NPC; Yang et al7reported that LMP1 promotes vasculature formation through the JNKs/HIF‐1 pathway in NPC. However, the function of a single protein might not fully reflect the effects of EBV infection. The regulatory network in EBV‐induced angiogenesis remains elusive.
In this study, we confirmed that EBV infection enhances tumor angiogenesis and growth. Furthermore, we found that EBV increases the production of multiple angiogenesis‐related proteins and that one of these proteins, CCL5, is a novel molecular driver underlying EBV‐induced angiogenesis and tumor progression in NPC.
2. MATERIALS AND METHODS
2.1. Cell culture
Human poorly differentiated NPC cell lines, CNE2 and TW03, were kindly provided by Professor Mu‐Sheng Zeng from the SYSUCC (Guangzhou, China). They were cultured in RPMI‐1640 media (Invitrogen, Carlsbad, CA, USA) supplemented with 5% FBS (Gibco, Carlsbad, CA, USA). The EBV‐infected NPC cell lines, CNE2‐EBV and TW03‐EBV, were cultured in selective media containing 200‐500 μg/mL G418 (Invitrogen). Before using them for cytological experiments, the selective media were replaced with normal media. Immortalized HUVECs were kindly provided by Professor Wen‐Lin Huang (SYSUCC). They were cultured in DMEM (Invitrogen) supplemented with 10% FBS (Gibco). All cell lines were maintained in a 5% CO2 humidified incubator at 37°C and were passaged less than 10 times after initial revival from frozen stocks.
2.2. Epstein–Barr virus infection
CNE2‐EBV and TW03‐EBV cell lines were derived from parental cell lines that were infected with recombinant EBV according to previous reports.8, 9 Briefly, the procedures were as follows. The EGFP‐neo′EBV‐infected Akata cells (lymphoma cells) were used to produce recombinant EBV. First, Akata cell suspension (5 × 10⁶/mL) was incubated in serum‐free media and stimulated by serum IgG cross‐linking for a switch of EBV infection from latency to lysis. Next, the cells were washed with PBS to remove serum IgG and were cocultured with monolayer NPC cells (CNE2 and TW03) for 3 days. The NPC cells were then washed with PBS and screened in selective media containing 200‐700 μg/mL G418 for 2‐3 weeks. The infection efficiency was examined with EBER in situ hybridization.
2.3. Preparation of conditioned media
For the following series of experiments, cells were first cultured in RPMI‐1640 complete media (5% FBS) in 6‐well plates. After reaching confluence, the cells were washed with PBS and cultured in serum‐free media (2 mL/well) for 24 hours. Cell supernatants were collected as the CM and stored at −80°C until use. For collecting CM in chemical inhibition experiments, the PI3K inhibitor LY294002 (Selleckchem, Houston, TX, USA), the HIF‐1α inhibitor PX478 (Selleckchem), the CCR1 antagonist BX471 (Tocris, Bristol, UK), the CCR3 antagonist SB297006 (Tocris), or the CCR5 antagonist DAPTA (Tocris) was used to pretreat cells for 6 hours. The cells were then washed and cultured in serum‐free media for collecting CM.
2.4. Migration assay
The migration assay was carried out using Transwell chambers (24‐well plate format) with an 8.0‐μm pore size (Corning, Corning, NY, USA). The HUVECs (1 × 10⁵ cells/well) suspended in serum‐free media were seeded into the upper chamber and were incubated in the bottom chamber with CM. The cells were cultured in a 5% CO2 humidified incubator at 37°C for 24 hours, fixed in 4% paraformaldehyde for 10 minutes, and stained with a crystal violet staining solution (Beyotime, Shanghai, China) for 20 minutes. The cells on the upper side of the filters were removed, while the stained cells on the bottom side were photographed in three independent fields of each well through a light microscope at 100× magnification. The cells were counted using ImageJ software. Experiments were repeated at least three times.
2.5. Tube formation assay
Matrigel matrix (Corning) was thawed at 4°C overnight. Each well of the 96‐well plate was coated with approximately 50 μL Matrigel matrix, and the plate was incubated at 37°C for 30 minutes. When the Matrigel matrix formed a gel, HUVECs (3 × 10⁴ cells/well) were seeded on the gel in CM (200 μL/well) and were incubated at 37°C for 6 hours. The tubes were counted in three independent fields at 400× magnification under a light microscope. Experiments were repeated at least three times.
2.6. CRISPR/Cas9‐mediated gene editing
CRISPR/Cas9‐mediated gene editing was undertaken according to a previous report.10 The gRNA targeting EBNA1 was cloned into a Lenti‐CRISPRv2 vector. To generate EBNA1‐edited cells, EBV‐infected cells were transduced with prepared lentivirus containing the constructed gRNA plasmid. For control cells, a lentivirus containing the Lenti‐CRISPRv2 empty vector was used. These cells were screened in selective media with 1 μg/mL puromycin. After screening for approximately 1 week, clones of resistant cells were isolated, and the effect of gene editing was examined with a T7 Endonuclease I (T7EI; NEB, Beverly, MA, USA) assay as previously described.11 The gRNA sequences were listed as follows: gRNA #1, 5′‐CACCGGTGTGAATCATGTCTGACGA‐3′; and gRNA #2, 5′‐CACCGGGCCCTGATCCTGAGCCGCC‐3′.
2.7. Tandem mass tag‐based quantitative proteomic analysis
Conditioned media from EBV‐uninfected and EBV‐infected cells were collected as before. The proteomic analysis was carried out by PTM Biolabs (Hangzhou, China). Briefly, the procedures were as follows: (i) the crude protein in the CM was concentrated, and the protein concentration was determined with a bicinchoninic acid kit (Beyotime) according to the manufacturer's instructions; (ii) the proteins were digested overnight with trypsin (Promega, Madison, WI, USA) into peptides at a 1:50 trypsin : protein mass ratio; (iii) the peptides were labeled by TMTs with a TMT labeling kit (Thermo Fisher Scientific, Waltham, MA, USA) and were fractionated by high pH reverse‐phase HPLC, followed by LC‐MS/MS analysis; and (iv) the resulting MS/MS data were processed using a Maxquant search engine (version 1.5.2.8) with 1% false discovery rate. Functional annotation and enrichment analysis were carried out through the Gene Ontology database. Pathways enrichment was undertaken with the KEGG database.
2.8. Quantitative real‐time PCR
Total RNA was isolated from cells using TRIzol reagent (Invitrogen) according to the manufacturer's protocol and was reverse‐ transcribed into cDNA using a PrimeScript 1st Strand cDNA Synthesis Kit (Takara, Tokyo, Japan). Quantitative real‐time PCR was carried out using Fast SYBR Green Master Mix (Thermo Fisher Scientific) with gene‐specific primers and cDNA templates according to the manufacturer's protocol. The qPCR assays were carried out in triplicate on an ABI 7300 Prism Sequence Detection System (Applied Biosystems, Foster City, CA, USA). The cycling conditions were as follows: 95°C for 2 minutes, followed by 35 cycles of 95°C for 15 seconds, and 60°C for 30 seconds. GAPDH was used as a reference gene. The relative fold change in expression was calculated using the 2−ΔΔCT method. The primer sequences were: EBER forward primer, 5′‐AGGACCTACGCTGCCCTAGA‐3′; EBER reverse primer, 5′‐AAAACATGCGGACCACCAGC‐3′; LMP1 forward primer, 5′‐CCCACTCTGCTCTCAAAACC‐3′; LMP1 reverse primer, 5′‐GTCCTGTGGGCCATTGTC‐3′; LMP2A forward primer, 5′‐ATGACTCATCTCAACACATA‐3′; LMP2A reverse primer, 5′‐CATGTTAGGCAAATTGCAAA‐3′; VEGF forward primer, 5′‐CACTGTGAGCCTTGTTCAG‐3′; VEGF reverse primer, 5′‐AAGAGTCTCCTCTCCCTTC‐3′; CCL5 forward primer, 5′‐AGCCCTCGCTGTCATCCT‐3′; CCL5 reverse primer, 5′‐CACTTGGCGGTTCTTTCG‐3′; ANG forward primer, 5′‐CCTGTGTTGGAAGAGATGGT‐3′; ANG reverse primer, 5′‐CCTGTGGTTTGGCATCATAG‐3′; GAPDH forward primer, 5′‐GGTGGTCTCCTCTGACTTCAACA‐3′; GAPDH reverse primer, 5′‐GTTGCTGTAGCCAAATTCGTTGT‐3′.
2.9. Enzyme‐linked immunosorbent assay
The human VEGF Quantikine ELISA kit (R&D Systems, Minneapolis, MN, USA), human CCL5/RANTES Quantikine ELISA kit (R&D Systems), and ANG ELISA kit (RayBiotech, Norcross, GA, USA) were used to assay VEGF, CCL5, and ANG, respectively, according to the manufacturer's protocols.
2.10. Establishment of CCL5 knockdown cells
To generate CCL5 knockdown cells, EBV‐infected cells were transduced with prepared lentivirus containing a pLKO.1‐CCL5 shRNA construct targeting the human CCL5 coding sequence. For control cells, a lentivirus containing the pLKO.1‐scrambled shRNA construct was used. These cells were screened in selective media with 1 μg/mL puromycin. After screening for approximately 1 week, clones of resistant cells were isolated, and the knockdown efficiency was confirmed by qPCR analysis. The shRNA sequences were listed as follows: CCL5 shRNA, 5′‐CCTGCTGCTTTGCCTACATTG‐3′; and scrambled shRNA, 5′‐GCTAAACTCGTAATTCAACTT‐3′.
2.11. Transcriptome analysis
Total RNA was extracted from EBV‐uninfected and EBV‐infected cells using TRIzol reagent (Invitrogen) according to the manufacturer's protocol. The purity and concentration of total RNA were determined by spectrophotometry. RNA integrity was confirmed by agarose gel electrophoresis. The transcriptome analysis was undertaken by NovoGene (Beijing, China). Briefly, the procedures were as follows. First, mRNA was isolated from the total RNA and was fragmented into pieces by fragmentation buffer. Second, the mRNA fragments were reverse‐transcribed to cDNA for constructing libraries, followed by paired‐end sequencing. Finally, the raw data were filtered, resulting in more accurate data. Functional annotation and enrichment analysis were carried out with the Gene Ontology database. Pathway enrichment was undertaken with the KEGG database.
2.12. Western blot analysis
Cells were lysed in RIPA lysis buffer containing protease inhibitors. The proteins in lysates were separated with 10% SDS‐PAGE and then were transferred to PVDF membranes (Thermo Fisher Scientific). Primary antibodies needed were incubated with the membranes. Antibodies against VEGF (ab53465; Abcam, Cambridge, MA, USA), AKT (#9272; Cell Signaling Technology, Danvers, MA, USA), p‐AKT (#4060; Cell Signaling Technology), HIF‐1α (sc‐13515; Santa Cruz Biotechnology, Santa Cruz, CA, USA), β‐actin (#3700; Cell Signaling Technology), and GAPDH (60004‐1‐1 g; Protein‐tech, Chicago, IL, USA) were used for Western blot analysis. Then HRP‐conjugated secondary antibodies (Promega) were used to assess primary antibody binding. Chemiluminescence was detected using Western Bright ECL (Advansta, Menlo Park, CA, USA) with a ChemiDoc Touch Imaging System (Bio‐Rad, Hercules, CA, USA).
2.13. Immunohistochemistry
Human NPC specimens were collected from 35 patients diagnosed with EBV‐infected NPC at SYSUCC. The use of the specimens was approved by the Ethical Committee of SYSUCC (GZR2016‐105), and informed consent was obtained from all patients. The paraffin‐embedded NPC tissue sections were deparaffinized and rehydrated. Antigen retrieval was carried out with EDTA buffer (pH 8.0) in a pressure cooker. After high‐temperature antigen retrieval, the sections were treated with 3% H2O2 for 10 minutes, blocked in 5% BSA for 60 minutes and incubated with anti‐AKT (phospho S473) antibody (ab81283; Abcam), anti‐HIF1α antibody (ab51608; Abcam), anti‐CCL5 antibody (ab189841; Abcam), and anti‐human CD31 antibody (ab9498; Abcam) at 4°C overnight. The sections were then rinsed with PBS and incubated with the biotinylated secondary antibody (Bios, Shanghai, China) for 60 minutes at room temperature. Next, the sections were washed and incubated with DAB solution (ZSGB‐BIO, Beijing, China), and the reactions were terminated with distilled H2O. Finally, the sections were counterstained with hematoxylin. To detect blood vessels, a periodic acid–Schiff staining kit (Baso, Zhuhai, China) was used in combination with CD31 staining before hematoxylin counterstaining. The number of blood vessels was counted under a light microscope at 400× magnification. To evaluate the correlation between CCL5 expression and vessel count, the intensity of CCL5 staining was calculated by pathologists as follows: strong, score 3; moderate, score 2; weak, score 1; and negative, score 0. The immunohistochemical score was determined according to both the intensity of staining and the percentage of CCL5‐positive tumor cells.
2.14. Epstein–Barr virus‐encoded small RNA in situ hybridization
The EBER in situ hybridization was used to confirm the presence of EBV in NPC cells or human tissue samples. The assay was carried out with an EBER detection kit (ZSGB‐BIO) according to the manufacturer's instructions. The procedures were as follows. For hybrid pretreatment of cell lines, 1 × 10⁵ cells were seeded on the slide glass in a 12‐well plate and cultured for 24 hours. The cells on the slides were then fixed with 4% paraformaldehyde for 10 minutes and digested by pepsin for 10 minutes. For hybrid pretreatment of human tissues, tissue sections were deparaffinized, rehydrated, and digested by pepsin for 30 minutes. For hybridization, the slides or sections were incubated with EBER probe (20 μL) at 37°C for 2 hours. For antibody incubation, the slides or sections were washed with PBS and incubated with anti‐digoxin IgG/HRP antibody at 37°C for 30 minutes. After washing with PBS, the slides or sections were incubated with DAB solution for coloring, and the reactions were stopped according to microscopic evaluation.
2.15. Xenograft tumor model
The BALB/c nude mice (female, 3‐4 weeks old) were purchased from Shanghai Laboratory Animal Center (Shanghai, China). They were fed and housed according to the Institutional Animal Care and Use Committee of Sun Yat‐sen University. All animal experiments were approved by the Institutional Animal Care and Use Committee (approval no. L102042016110W). For the xenograft experiments, the mice were divided into groups (n = 3/group), and experimental cells (5 × 10⁶) were injected s.c. into the recipient mice. Tumor volume was measured every 2 days from day 3 after cell implantation and was calculated by the following formula: volume (mL3) = length × (width)2/2. After 2 weeks, the mice were killed and the tumor tissues were harvested for further immunohistochemical analyses.
To identify blood vessels, representative tumor tissues were stained with an anti‐mouse CD31 antibody (#77699; Cell Signaling Technology). The number of microvessels stained by CD31 was assessed using the vascular hotspot method according to previous reports.12, 13, 14 Tumor sections were scanned at low‐power field (100× magnification) under a light microscope to determine areas containing the highest vascular density (vascular hotspot). Microvessels were counted in five separate random fields in this hotspot region at high‐power field (200× magnification). Three tumors of each group were analyzed in three sections. In our study, the lumen size of microvessels was not calculated.
2.16. Statistical analysis
The data were analyzed with GraphPad Prism 6.0 software and are presented as the mean ± SD. Pearson's correlation coefficient was used to analyze the correlation between CCL5 expression and vessel count. Student's t‐test was used to analyze the statistical significance between two groups. For all analyses, P < .05 was considered significant.
2.17. Data availability
The transcriptome has been deposited in the Sequence Read Archive database (accession no. SRP118175).
3. RESULTS
3.1. Epstein–Barr virus‐infected NPC cell lines generate larger tumors with more microvessels in mouse xenograft models
To determine the role of EBV infection in tumor angiogenesis, we examined whether EBV infection directly modulates endothelial cell behaviors, such as tube formation and migration, both of which are indicative of angiogenesis.15 We established EBV‐infected NPC cells as previously described.8, 9 Two typical NPC cell lines (CNE2 and TW03) were infected with recombinant EBV, and the presence of EBV was confirmed by EBER in situ hybridization (Figure S1). Using the stable EBV‐infected NPC cells (CNE2‐EBV and TW03‐EBV), we first collected CM and applied them to HUVECs for tube formation assays. However, no increase in HUVEC tube formation was observed compared with their parental cells (Figure 1A,B). Vascular endothelial cell migration is a critical step and another indicator of angiogenesis ability.16 We next undertook Transwell assays to evaluate the effect of EBV‐infected cells on HUVEC migration. Conditioned media from EBV‐infected cells significantly promoted the migration of HUVECs, as indicated by the increased number of migrated cells in the Transwell assays (Figure 1C,D). To evaluate the role of EBV infection in tumor angiogenesis in vivo, EBV‐infected and ‐uninfected CNE2 cells were injected s.c. into nude mice. Compared with the parental cells, EBV‐infected cells not only showed a larger tumor volume (Figure 1E,F) but also more microvessels, indicated by a stronger CD31 staining (Figure 1G,H). Collectively, both in vitro and in vivo data suggest that EBV plays an important role in angiogenesis.
Figure 1.
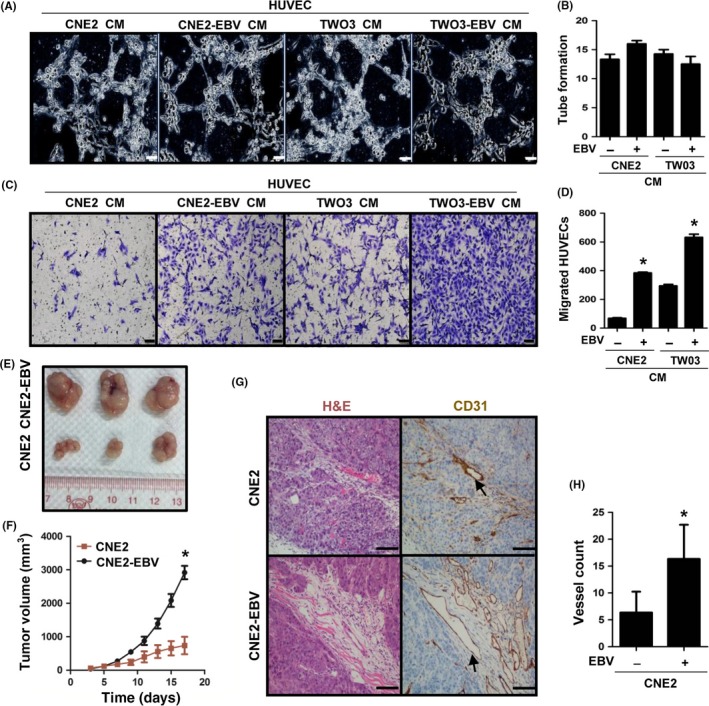
Epstein–Barr virus (EBV) infection increases tumor angiogenesis and growth in nasopharyngeal carcinoma cells. A,B, Formation of capillary‐like structures by conditioned media (CM)‐treated HUVECs was examined by tube formation assays. The number of tubes was analyzed statistically. Scale bar = 20 μm. C,D, CM‐induced HUVEC migration was examined by Transwell assays. The number of migrated cells was analyzed statistically. Scale bar = 100 μm. E,F, Representative tumors at harvest time, formed by CNE2 or CNE2‐EBV cells in nude mice. Tumor volume was measured on the indicated days after cell implantation. G,H, CD31 staining was used to visualize blood vessels in tumors formed by CNE2 or CNE2‐EBV cells. H&E staining was used to identify tumor cells. The color of the staining is similar to that of the annotation. Arrows indicate blood vessels. The number of vessels was analyzed statistically. Scale bar = 100 μm. Results are presented as the mean ± SD. *P < .05
3.2. Reduction of EBV decreases tumor angiogenesis
To further elucidate the role of EBV in tumor angiogenesis, we directly suppressed EBV replication in the two EBV‐infected cell lines (CNE2‐EBV and TWO3‐EBV) using the CRISPR/Cas9 system targeting EBNA1, which is essential for EBV maintenance and replication. The efficient gene editing was confirmed by T7EI assay (Figure S2A,B) and EBNA1 Western blot analysis (Figure S2C). After EBNA1 knockdown by the CRISPR/Cas9 system, the expression of viral genes EBER, LMP1, and LMP2A was substantially inhibited (Figure 2A), indicating that the virus genomes were reduced by EBNA1 editing. Next, we examined the angiogenesis of NPC cells with or without EBNA1 knockdown. As the results showed, HUVEC migration induced by EBV‐infected cells was substantially decreased (Figure 2B,C) after EBNA1 knockdown. Moreover, tumor growth (Figure 2D,E) and angiogenesis (Figure 2F,G) in vivo were also greatly attenuated. These results indicate that the increased angiogenesis of EBV‐infected NPC cells is indeed attributable to the presence of EBV.
Figure 2.
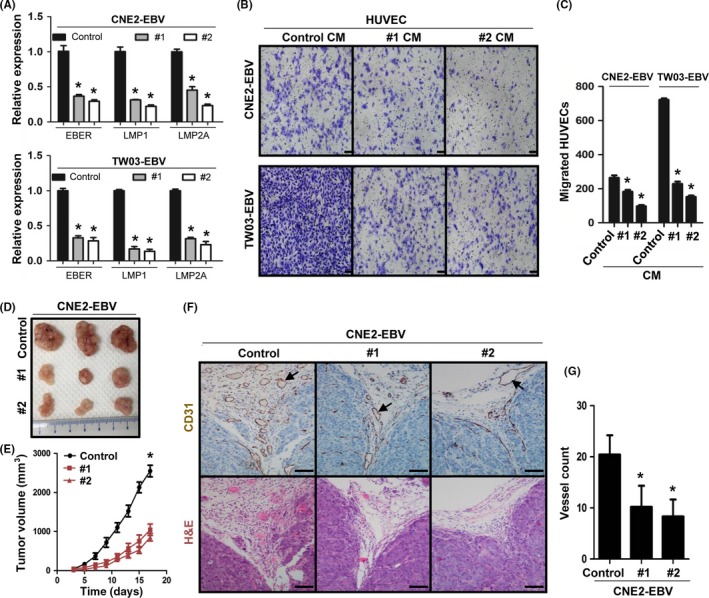
Reduction of Epstein–Barr virus (EBV) decreases tumor angiogenesis and growth in nasopharyngeal carcinoma cells. A, Expression of EBV‐encoded small RNA (EBER), latent membrane protein (LMP)1, and LMP2A in EBV‐encoded nuclear antigen‐1 (EBNA1) knockdown cells (#1 and #2) and control cells (Control) was examined by quantitative real‐time PCR. B,C, Conditioned media (CM)‐induced HUVEC migration was examined by Transwell assays. Scale bar = 100 μm. D,E, Representative tumors at harvest time, formed by EBNA1 knockdown or control CNE2‐EBV cells in nude mice. Tumor volume was measured on the indicated days after cell implantation. F,G, CD31 staining was used to visualize blood vessels in tumors formed by EBNA1 knockdown or control CNE2‐EBV cells. The color of the staining is similar to that of the annotation. Arrows indicate blood vessels. Scale bar = 100 μm. Results are presented as the mean ± SD. *P < .05
3.3. Chemokine CCL5 is required for EBV‐induced tumor angiogenesis
To understand the molecular basis of EBV‐induced tumor angiogenesis, we used proteomics to analyze the angiogenesis‐related proteins in the CM from EBV‐infected and ‐uninfected cells. We found that a total of nine pro‐angiogenic factors were collectively upregulated in the CM of CNE2‐EBV and TW03‐EBV cells compared with their parental cells (Figure 3A). Among these differentially secreted pro‐angiogenic factors, CCL5 attracted our interest. Chemokine CCL5 was historically shown to be involved in several chronic inflammations and to play a direct role in inflammation angiogenesis.17 It has been reported that CCL5 promotes VEGF‐dependent angiogenesis in human osteosarcoma cells.18 In addition, CCL5 can promote angiogenic phenotypes of glioblastoma19 and breast cancer.20 Furthermore, CCL5 plays an important role in promoting the differentiation of ovarian cancer stem cells into endothelial cells and tumor angiogenesis.21 These reports indicate that CCL5 is associated with tumor angiogenesis. Whether CCL5 mediates EBV‐induced angiogenesis in NPC remains unknown. Therefore, we carried out the following assays to illustrate it. We first validated the proteomics data by ELISA, qPCR, and Western blotting. The results showed that CCL5 secretion and transcription were both increased after EBV infection, which were consistent with the proteomics analysis (Figure 3B, right panel; Figure S3A, left panel). Similar results were obtained for another two key pro‐angiogenic factors, VEGF (Figure 3B, left panel; Figure S3B) and ANG (Figure 3B, middle panel; Figure S3A, right panel). Moreover, in EBNA1 knockdown cells, the expression of CCL5 was also decreased, confirming the regulation of CCL5 by EBV (Figure S3C). Next, we interfered with CCL5 function by inhibiting the activity of its three receptors (CCR1, CCR3, and CCR5) or by directly knocking down CCL5 expression. The results showed that pretreatment with the CCR5 antagonist substantially reduced the EBV‐induced migration of HUVECs (Figure 3C), which was consistent with the results from CCL5 knockdown (Figure 3D,E). Moreover, after CCL5 expression was downregulated, EBV‐positive tumor growth (Figure 3F,G) and angiogenesis (Figure 3H,I) were also notably suppressed. These data suggest that EBV‐induced tumor angiogenesis is mediated by CCL5.
Figure 3.
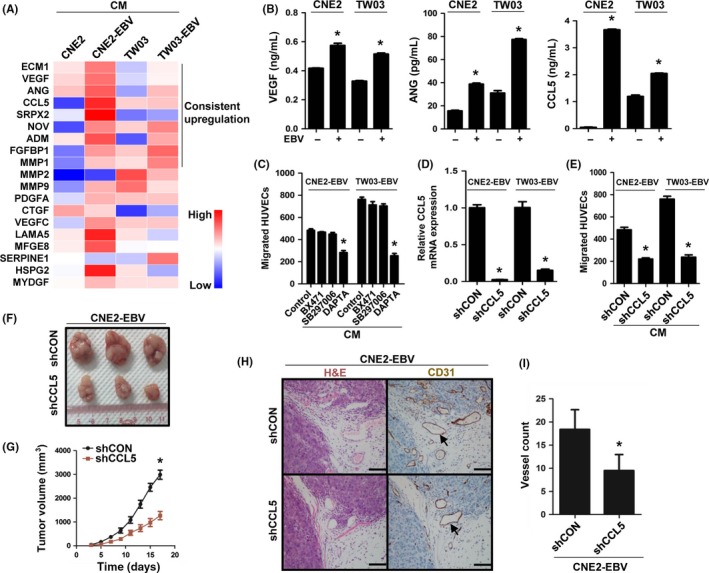
Chemokine (C‐C motif) ligand 5 (CCL5) mediates Epstein–Barr virus (EBV)‐induced tumor angiogenesis. A, Heatmap from the proteomic analysis of EBV‐uninfected and ‐infected cells showing the secretion level of selected proteins (P < .05) associated with angiogenesis. A total of nine proteins were collectively upregulated in conditioned media (CM) of CNE2‐EBV and TW03‐EBV nasopharyngeal carcinoma (NPC) cells. B, ELISA validation for the secreted levels of vascular endothelial growth factor (VEGF), angiogenin (ANG), and CCL5 identified in the proteomic analysis. C, EBV‐infected NPC cells were pretreated with 100 nmol/L BX471 (chemokine [C‐C motif] receptor 1 [CCR1] antagonist), 100 nmol/L SB297006 (CCR3 antagonist), or 100 nmol/L DAPTA (CCR5 antagonist) for 6 h. The CM were collected as described previously. The migration of HUVECs was examined by Transwell assays. D, Quantitative real‐time PCR analysis of CCL5 expression in CCL5 knockdown (shCCL5) and control (shCON) EBV‐infected cells. E, CM‐induced HUVEC migration was examined by Transwell assays. F,G, Representative tumors at harvest time, formed by CCL5 knockdown or control CNE2‐EBV cells in nude mice. Tumor volume was measured on the indicated days after cell implantation. H,I, CD31 staining was used to visualize blood vessels in tumors formed by CCL5 knockdown or control CNE2‐EBV cells. The color of the staining is similar to that of the annotation. Arrows indicate blood vessels. Scale bar = 100 μm. Results are presented as mean ± SD. *P < .05
3.4. Transcriptome analysis reveals that the PI3K/AKT pathway is activated by EBV infection
Given that CCL5 is a key regulator in EBV‐induced tumor angiogenesis, we next examined the specific mechanisms underlying CCL5‐regulated angiogenesis. We isolated total RNA from EBV‐infected and ‐uninfected NPC cells to undertake a whole‐genome expression profile analysis with RNA‐seq technology (CNE2‐EBV vs CNE2 and TW03‐EBV vs TW03). Compared with CEN2 cells, 2479 downregulated genes and 2165 upregulated genes were found in CNE2‐EBV cells (Figure 4A, upper panel). In TW03‐EBV cells, we found 1687 downregulated genes and 1947 upregulated genes, compared with TW03 cells (Figure 4A, lower panel). We then carried out a pathway enrichment analysis for the differentially expressed genes using the KEGG database. In the analysis of the downregulated genes, significant pathways were not identified (Figure S4). However, we identified multiple signaling pathways for the upregulated genes (Figure 4B). Among them, only the hematopoietic cell lineage, the PI3K/AKT and tumor necrosis factor pathways were identified from both the EBV‐infected cell lines (Figure 4B). Because of the critical role of the PI3K/AKT pathway in tumor angiogenesis and progression,22 we chose it for further analysis. According to the KEGG database, a number of genes involved in activation of the PI3K/AKT pathway were upregulated in CNE2‐EBV and TW03‐EBV cells, and they could be divided into several clusters, such as the growth factor and the ECM (Figure 4C). Upregulating the genes in the clusters can activate the corresponding upstream signaling and may ultimately induce activation of the PI3K/AKT pathway (Figure 4D).
Figure 4.
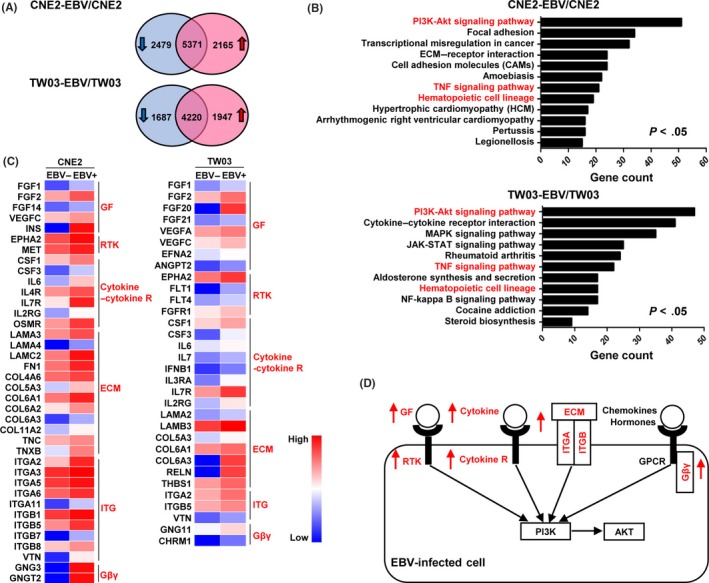
Transcriptome analysis reveals enhanced PI3K/AKT pathway in Epstein–Barr virus (EBV)‐infected cells. A, Venn diagram showing the differentially expressed genes between EBV‐uninfected and ‐infected cells. Genes with a >2‐fold change in expression and a P‐value <.05 were considered differentially expressed genes. B, Pathway enrichment analysis of upregulated genes in EBV‐infected cells was carried out using the Kyoto Encyclopedia of Genes and Genomes database. The same pathways identified in CNE2‐EBV and TW03‐EBV cells are highlighted in red. P adj < .05. NF, nuclear factor; TNF, tumor necrosis factor. C, Heatmaps showing the expression of selected genes involved in activation of the PI3K/AKT pathway. These genes were selected from the upregulated genes enriched in the PI3K/AKT pathway. They were divided into several clusters, which are highlighted in red. Cytokine‐R, cytokine receptor; Gβγ, G‐protein βγ subunit. GF, growth factor; RTK, receptor tyrosine kinase; ITG, integrin. D, Schematic showing the upstream signaling network of the PI3K/AKT pathway. The upregulated gene clusters in EBV‐infected cells are highlighted in red. GPCR, G protein‐coupled receptor; ITGA, integrin A; ITGB, integrin B
3.5. Involvement of PI3K/AKT and HIF‐1α pathways in CCL5‐mediated tumor angiogenesis
To confirm the transcriptome analysis, the level of AKT phosphorylation (Ser473) was investigated by Western blotting. The results showed that the AKT phosphorylation was increased in EBV‐infected cells (Figure 5A). Additionally, we also examined the expression of HIF‐1α, which is a target of the PI3K/AKT pathway23 and plays a central role in tumor angiogenesis.24 The accumulation of HIF‐1α proved to be increased after EBV infection (Figure 5A). The activation of the PI3K/AKT and HIF‐1α pathways has been reported to promote VEGF production and tumor angiogenesis.24, 25 To examine whether the two pathways are involved in EBV‐induced angiogenesis, the PI3K inhibitor LY294002 and the HIF‐1α inhibitor PX478 were used. Pretreatment with LY294002 or PX478 reduced EBV‐promoted HUVEC migration (Figure 5B) and VEGF expression (Figure 5C,D). As EBV‐induced tumor angiogenesis is mediated by CCL5, we then explored whether CCL5 promotes angiogenesis through the PI3K/AKT and HIF‐1α pathways in EBV‐infected cells. We found that inhibiting CCL5/CCR5 signaling with the CCR5 antagonist (DAPTA) decreased AKT phosphorylation and HIF‐1α expression (Figure 5E). Interestingly, CCL5 expression was also inversely regulated by the PI3K/AKT and HIF‐1α pathways, and the two pathways showed a synergistic effect on the regulation of CCL5 (Figure 5F). In addition, the inhibition of CCL5/CCR5 signaling decreased VEGF expression (Figure 5G,H). Taken together, these results suggest that CCL5‐promoted tumor angiogenesis is mediated by the PI3K/AKT and HIF‐1α pathways.
Figure 5.
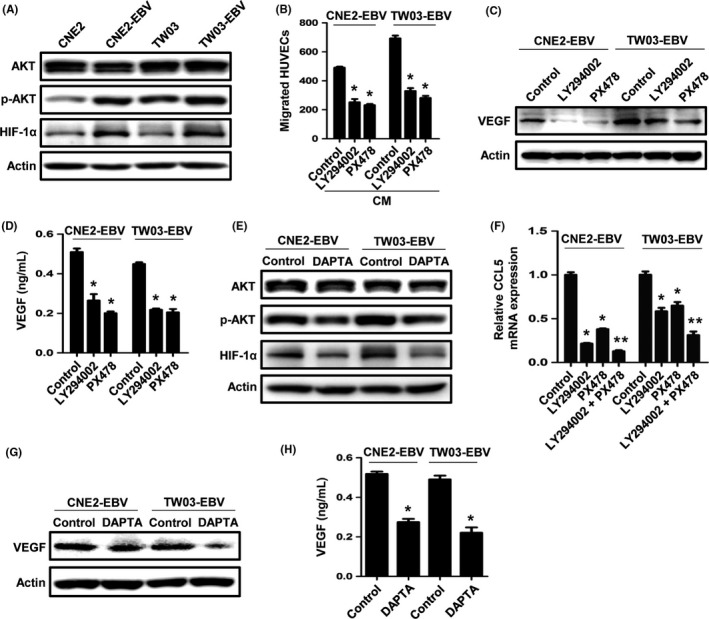
The PI3K/AKT and hypoxia‐inducible factor‐1α (HIF‐1α) pathways are involved in chemokine (C‐C motif) ligand 5 (CCL5)‐mediated angiogenesis. A, Western blot analysis of phosphorylated (p‐)AKT and HIF‐1α expression in Epstein–Barr virus (EBV)‐uninfected and ‐infected nasopharyngeal carcinoma (NPC) cells. B, EBV‐infected NPC cells were pretreated with 10 μmol/L LY294002 (PI3K inhibitor) or 50 μmol/L PX478 (HIF‐1α inhibitor) for 6 h, and the conditioned media were collected as described previously. The migration of HUVECs was examined by Transwell assays. C,D, Cells were pretreated with LY294002 or PX478 for 6 h and then were cultured in serum‐free media. Vascular endothelial growth factor (VEGF) expression was examined by Western blotting and ELISA after 24 h. E, EBV‐infected cells were treated with DAPTA for 6 h. Expression of p‐AKT and HIF‐1α was examined by Western blotting. F, Quantitative real‐time PCR analysis of CCL5 expression after cells were treated with LY294002 (10 μmol/L), PX478 (5 μmol/L), or the combination, for 24 h. G,H, Cells were pretreated with DAPTA for 6 h and then were cultured in serum‐free media. VEGF expression was examined by Western blotting and ELISA after 24 h. Results are presented as the mean ± SD. *P < .05 vs control; **P < .05 vs LY294002‐ or PX478‐treated group
3.6. Chemokine CCL5 is correlated with angiogenesis in human NPC
To determine the clinical relevance of CCL5 in NPC angiogenesis, we analyzed samples from NPC patients by immunohistochemical staining. As shown in Figure 6A, EBER, CCL5, p‐AKT, and HIF‐1α were all expressed in EBV‐positive NPC tissues, and the blood vessels were surrounded by the stained tumor cells. These results indicated that in human NPC, EBV‐positive tumor cells might induce angiogenesis by the same molecular pathways as in vitro angiogenesis. Further immunohistochemical analyses suggested that CCL5 expression was correlated with vessel count (Figure 6B,C). These data indicate that CCL5 is correlated with angiogenesis in human NPC.
Figure 6.
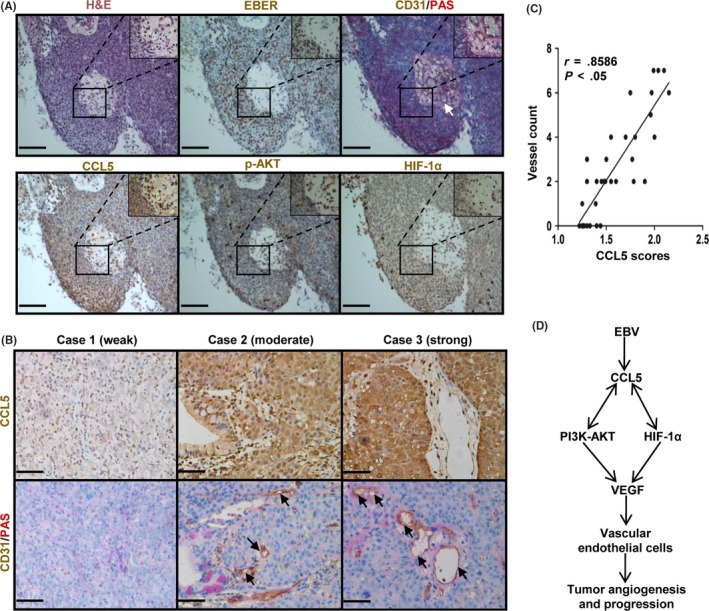
Chemokine (C‐C motif) ligand 5 (CCL5) is correlated with angiogenesis in human nasopharyngeal carcinoma (NPC). A, Representative images showing H&E, Epstein–Barr virus (EBV)‐encoded small RNA (EBER), CD31/periodic acid–Schiff (PAS), CCL5, phosphorylated (p‐)AKT, and hypoxia‐inducible factor‐1α (HIF‐1α) staining on serial NPC tissue sections. CD31 and PAS staining were used to visualize blood vessels. The color of the staining is similar to that of the annotation. Arrows indicate blood vessels. Original magnification, 200×. Scale bar = 100 μm. B, Representative images illustrating the immunohistochemical analysis of CCL5 expression and vessel number in NPC tissue specimens from three patients. The images also roughly show the three intensities of CCL5 staining, which are categorized as a weak, moderate, or strong intensity. Arrows indicate blood vessels. Original magnification, 400×. Scale bar = 50 μm. C, Correlation between CCL5 expression and vessel count, from the analysis of 35 NPC tissue samples, is shown in the graph. D, Schematic diagram illustrating that EBV‐induced CCL5 promotes tumor angiogenesis and progression by interacting with the PI3K/AKT and HIF‐1α pathways in human NPC. VEGF, vascular endothelial growth factor
4. DISCUSSION
On the basis of our study, we proposed a novel model of EBV‐induced angiogenesis in NPC. In this model, EBV infection promotes the production of CCL5, which increases VEGF expression and NPC angiogenesis by interacting with the PI3K/AKT and HIF‐1α pathways (Figure 6D).
Among our angiogenesis‐related experiments, the HUVEC migration assay in vitro eliminates any additional influences in vivo on tumor angiogenesis, this providing evidence for the direct effect of EBV‐infected cells on angiogenesis. However, EBV‐infected cells might also enhance tumor angiogenesis indirectly, such as recruiting macrophages. Macrophages play an important role in tumor angiogenesis and lymphangiogenesis by releasing many pro‐angiogenic factors.26 Moreover, it has been reported that EBV‐infected NPC cells recruit and activate macrophages by inducing granulocyte/macrophage colony‐stimulating factor production.27 Therefore, our present data could not exclude the indirect effect of EBV infection on tumor angiogenesis.
To understand the molecular basis of EBV‐induced angiogenesis, we compared the proteomics between EBV‐infected and EBV‐uninfected cell lines and found that some angiogenesis‐related proteins (ECM1, VEGF, ANG, SRPX2, NOV, ADM, FGFBP1, MMP1, and CCL5) were collectively unregulated in both of the EBV‐infected cell lines (CNE2‐EBV and TW03‐EBV). Among these proteins, only VEGF has been reported to mediate EBV‐induced angiogenesis.6, 7 In this study, we found that CCL5 is another mediator of EBV‐induced angiogenesis. By inhibiting CCL5 activity in vitro with receptor antagonists or shRNA knockdown, we revealed that CCL5 is involved in EBV‐promoted HUVEC migration. Through investigating microvessel formation in xenograft tumors with CCL5 knockdown, we proved that CCL5 modulates vascular formation of EBV‐infected tumors. Thus, our study confirmed that CCL5 mediates EBV‐induced angiogenesis.
Epstein–Barr virus upregulates CCL5 expression to induce tumor angiogenesis in NPC cells, but what are the specific mechanisms underlying the upregulation of CCL5? Previous studies suggested that EBV‐encoded protein LMP1 regulates CCL5 expression through the nuclear factor‐κB signaling pathway.28, 29 In our study, we proved that the PI3K/AKT and HIF‐1α pathways are also involved in the regulation of CCL5 expression. Thus, in NPC cells, EBV might activate these pathways to promote CCL5 production. Considering that LMP1 is a major oncoprotein of EBV and can modulate multiple signaling pathways, including the NF‐κB,29 PI3K/AKT,30 and HIF‐1α pathways,31 most likely, LMP1 drives CCL5 production in EBV‐infected cells. Further studies on the mechanisms of CCL5 upregulation in EBV‐infected cells are essential to elucidate the role of EBV infection and could be significant in the development of CCL5‐targeted therapy in NPC.
The interaction between CCL5 and the two signaling pathways, PI3K/AKT and HIF‐1α, is another notable finding in our study. Tang and coworkers have reported that the CCL5/CCR5 axis can modulate these two pathways in human chondrosarcoma and osteosarcoma cells.18, 32 In EBV‐infected NPC cells, we reached a similar conclusion. In addition, we found that these two pathways conversely regulate CCL5 expression. This positive feedback regulation can not only maintain CCL5 production but also continuously activate the PI3K/AKT and HIF‐1α pathways. CCL5 both directly acts on tumor cells for angiogenesis and recruits macrophages33 and regulatory T cells34 to favor tumor progression. The PI3K/AKT and HIF‐1α pathways are critical for tumor angiogenesis, survival, growth, and metastasis.35, 36 Interrupting the feedback regulation could greatly inhibit tumor development, which brings the possibility for CCL5‐targeted therapy in NPC. As shown in our data, CCL5 knockdown inhibited EBV‐positive tumor angiogenesis and growth. In colorectal cancer patients, a therapy targeting CCL5/CCR5 signaling has shown antitumoral effects.37 Our findings suggest that CCL5 could also be a potential therapeutic target in NPC and is worthy of further exploration.
CONFLICT OF INTEREST
The authors have no conflict of interest.
Supporting information
ACKNOWLEDGMENTS
This study was supported by the Key Program of the National Natural Science Foundation of China (81430059), the National Key R&D Program of China (2016YF0902000 and 2017YFA0505600), the National Natural Science Foundation of China (81672980), the Health & Medical Collaborative Innovation Project of Guangzhou City, China (201400000001 and 201508020250), and the Science and Technology Project of Guangdong Province (2015B050501005). We thank Professor Mu‐Sheng Zeng (Sun Yat‐sen University Cancer Center) for providing the NPC cell lines and thank Professor Wen‐Lin Huang (Sun Yat‐sen University Cancer Center) for providing the HUVEC cell line.
Ma W, Feng L, Zhang S, et al. Induction of chemokine (C‐C motif) ligand 5 by Epstein–Barr virus infection enhances tumor angiogenesis in nasopharyngeal carcinoma. Cancer Sci. 2018;109:1710‐1722. https://doi.org/10.1111/cas.13584
Contributor Information
Tong Xiang, Email: xiangtong@sysucc.org.cn.
Yi‐Xin Zeng, Email: zengyx@sysucc.org.cn.
REFERENCES
- 1. Wei WI, Sham JS. Nasopharyngeal carcinoma. Lancet. 2005;365:2041‐2054. [DOI] [PubMed] [Google Scholar]
- 2. Yoo DS, Kirkpatrick JP, Craciunescu O, et al. Prospective trial of synchronous bevacizumab, erlotinib, and concurrent chemoradiation in locally advanced head and neck cancer. Clin Cancer Res. 2012;18:1404‐1414. [DOI] [PubMed] [Google Scholar]
- 3. Mendelsohn J. The epidermal growth factor receptor as a target for cancer therapy. Endocr Relat Cancer. 2001;8:3‐9. [DOI] [PubMed] [Google Scholar]
- 4. Sennino B, McDonald DM. Controlling escape from angiogenesis inhibitors. Nat Rev Cancer. 2012;12:699‐709. [DOI] [PMC free article] [PubMed] [Google Scholar]
- 5. Tsao SW, Tsang CM, To KF, Lo KW. The role of Epstein‐Barr virus in epithelial malignancies. J Pathol. 2015;235:323‐333. [DOI] [PMC free article] [PubMed] [Google Scholar]
- 6. O'Neil JD, Owen TJ, Wood VH, et al. Epstein‐Barr virus‐encoded EBNA1 modulates the AP‐1 transcription factor pathway in nasopharyngeal carcinoma cells and enhances angiogenesis in vitro. J Gen Virol. 2008;89:2833‐2842. [DOI] [PubMed] [Google Scholar]
- 7. Yang L, Liu L, Xu Z, et al. EBV‐LMP1 targeted DNAzyme enhances radiosensitivity by inhibiting tumor angiogenesis via the JNKs/HIF‐1 pathway in nasopharyngeal carcinoma. Oncotarget. 2015;6:5804‐5817. [DOI] [PMC free article] [PubMed] [Google Scholar]
- 8. Lo AK, Lo KW, Tsao SW, et al. Epstein‐Barr virus infection alters cellular signal cascades in human nasopharyngeal epithelial cells. Neoplasia. 2006;8:173‐180. [DOI] [PMC free article] [PubMed] [Google Scholar]
- 9. Xiong D, Du Y, Wang HB, et al. Nonmuscle myosin heavy chain IIA mediates Epstein‐Barr virus infection of nasopharyngeal epithelial cells. Proc Natl Acad Sci USA. 2015;112:11036‐11041. [DOI] [PMC free article] [PubMed] [Google Scholar]
- 10. van Diemen FR, Kruse EM, Hooykaas MJ, et al. CRISPR/Cas9‐mediated genome editing of herpesviruses limits productive and latent infections. PLoS Pathog. 2016;12:e1005701. [DOI] [PMC free article] [PubMed] [Google Scholar]
- 11. Kim HJ, Lee HJ, Kim H, Cho SW, Kim JS. Targeted genome editing in human cells with zinc finger nucleases constructed via modular assembly. Genome Res. 2009;19:1279‐1288. [DOI] [PMC free article] [PubMed] [Google Scholar]
- 12. Chung HW, Lim JB. High‐mobility group box‐1 contributes tumor angiogenesis under interleukin‐8 mediation during gastric cancer progression. Cancer Sci. 2017;108:1594‐1601. [DOI] [PMC free article] [PubMed] [Google Scholar]
- 13. Holtz DO, Krafty RT, Mohamed‐Hadley A, et al. Should tumor VEGF expression influence decisions on combining low‐dose chemotherapy with antiangiogenic therapy? Preclinical modeling in ovarian cancer. J Transl Med. 2008;6:2. [DOI] [PMC free article] [PubMed] [Google Scholar]
- 14. Pan Q, Rosenthal DT, Bao L, Kleer CG, Merajver SD. Antiangiogenic tetrathiomolybdate protects against Her2/neu‐induced breast carcinoma by hypoplastic remodeling of the mammary gland. Clin Cancer Res. 2009;15:7441‐7446. [DOI] [PMC free article] [PubMed] [Google Scholar]
- 15. Carmeliet P, Jain RK. Angiogenesis in cancer and other diseases. Nature. 2000;407:249‐257. [DOI] [PubMed] [Google Scholar]
- 16. Lamalice L, Le Boeuf F, Huot J. Endothelial cell migration during angiogenesis. Circ Res. 2007;100:782‐794. [DOI] [PubMed] [Google Scholar]
- 17. Suffee N, Richard B, Hlawaty H, Oudar O, Charnaux N, Sutton A. Angiogenic properties of the chemokine RANTES/CCL5. Biochem Soc Trans. 2011;39:1649‐1653. [DOI] [PubMed] [Google Scholar]
- 18. Wang SW, Liu SC, Sun HL, et al. CCL5/CCR5 axis induces vascular endothelial growth factor‐mediated tumor angiogenesis in human osteosarcoma microenvironment. Carcinogenesis. 2015;36:104‐114. [DOI] [PubMed] [Google Scholar]
- 19. Soroceanu L, Matlaf L, Bezrookove V, et al. Human cytomegalovirus US28 found in glioblastoma promotes an invasive and angiogenic phenotype. Can Res. 2011;71:6643‐6653. [DOI] [PMC free article] [PubMed] [Google Scholar]
- 20. Svensson S, Abrahamsson A, Rodriguez GV, et al. CCL2 and CCL5 are novel therapeutic targets for estrogen‐dependent breast cancer. Clin Cancer Res. 2015;21:3794‐3805. [DOI] [PubMed] [Google Scholar]
- 21. Tang S, Xiang T, Huang S, et al. Ovarian cancer stem‐like cells differentiate into endothelial cells and participate in tumor angiogenesis through autocrine CCL5 signaling. Cancer Lett. 2016;376:137‐147. [DOI] [PubMed] [Google Scholar]
- 22. Karar J, Maity A. PI3K/AKT/mTOR pathway in angiogenesis. Front Mol Neurosci. 2011;4:51. [DOI] [PMC free article] [PubMed] [Google Scholar]
- 23. Li GQ, Zhang Y, Liu D, et al. PI3 kinase/Akt/HIF‐1alpha pathway is associated with hypoxia‐induced epithelial‐mesenchymal transition in fibroblast‐like synoviocytes of rheumatoid arthritis. Mol Cell Biochem. 2013;372:221‐231. [DOI] [PubMed] [Google Scholar]
- 24. Yang Y, Sun M, Wang L, Jiao B. HIFs, angiogenesis, and cancer. J Cell Biochem. 2013;114:967‐974. [DOI] [PubMed] [Google Scholar]
- 25. Ma J, Sawai H, Ochi N, et al. PTEN regulates angiogenesis through PI3K/Akt/VEGF signaling pathway in human pancreatic cancer cells. Mol Cell Biochem. 2009;331:161‐171. [DOI] [PubMed] [Google Scholar]
- 26. Riabov V, Gudima A, Wang N, Mickley A, Orekhov A, Kzhyshkowska J. Role of tumor associated macrophages in tumor angiogenesis and lymphangiogenesis. Front Physiol. 2014;5:75. [DOI] [PMC free article] [PubMed] [Google Scholar]
- 27. Huang D, Song SJ, Wu ZZ, et al. Epstein‐Barr virus‐induced VEGF and GM‐CSF drive nasopharyngeal carcinoma metastasis via recruitment and activation of macrophages. Can Res. 2017;77:3591‐3604. [DOI] [PubMed] [Google Scholar]
- 28. Buettner M, Meyer B, Schreck S, Niedobitek G. Expression of RANTES and MCP‐1 in epithelial cells is regulated via LMP1 and CD40. Int J Cancer. 2007;121:2703‐2710. [DOI] [PubMed] [Google Scholar]
- 29. Kung CP, Raab‐Traub N. Epstein‐Barr virus latent membrane protein 1 induces expression of the epidermal growth factor receptor through effects on Bcl‐3 and STAT3. J Virol. 2008;82:5486‐5493. [DOI] [PMC free article] [PubMed] [Google Scholar]
- 30. Dawson CW, Tramountanis G, Eliopoulos AG, Young LS. Epstein‐Barr virus latent membrane protein 1 (LMP1) activates the phosphatidylinositol 3‐kinase/Akt pathway to promote cell survival and induce actin filament remodeling. J Biol Chem. 2003;278:3694‐3704. [DOI] [PubMed] [Google Scholar]
- 31. Sung WW, Chu YC, Chen PR, Liao MH, Lee JW. Positive regulation of HIF‐1A expression by EBV oncoprotein LMP1 in nasopharyngeal carcinoma cells. Cancer Lett. 2016;382:21‐31. [DOI] [PubMed] [Google Scholar]
- 32. Liu GT, Chen HT, Tsou HK, et al. CCL5 promotes VEGF‐dependent angiogenesis by down‐regulating miR‐200b through PI3K/Akt signaling pathway in human chondrosarcoma cells. Oncotarget. 2014;5:10718‐10731. [DOI] [PMC free article] [PubMed] [Google Scholar]
- 33. Frankenberger C, Rabe D, Bainer R, et al. Metastasis suppressors regulate the tumor microenvironment by blocking recruitment of prometastatic tumor‐associated macrophages. Can Res. 2015;75:4063‐4073. [DOI] [PMC free article] [PubMed] [Google Scholar]
- 34. Serrels A, Lund T, Serrels B, et al. Nuclear FAK controls chemokine transcription, Tregs, and evasion of anti‐tumor immunity. Cell. 2015;163:160‐173. [DOI] [PMC free article] [PubMed] [Google Scholar]
- 35. Brugge J, Hung MC, Mills GB. A new mutational AKTivation in the PI3K pathway. Cancer Cell. 2007;12:104‐107. [DOI] [PubMed] [Google Scholar]
- 36. Tang CM, Yu J. Hypoxia‐inducible factor‐1 as a therapeutic target in cancer. J Gastroenterol Hepatol. 2013;28:401‐405. [DOI] [PubMed] [Google Scholar]
- 37. Halama N, Zoernig I, Berthel A, et al. Tumoral immune cell exploitation in colorectal cancer metastases can be targeted effectively by anti‐CCR5 therapy in cancer patients. Cancer Cell. 2016;29:587‐601. [DOI] [PubMed] [Google Scholar]
Associated Data
This section collects any data citations, data availability statements, or supplementary materials included in this article.
Supplementary Materials
Data Availability Statement
The transcriptome has been deposited in the Sequence Read Archive database (accession no. SRP118175).