

ABSTRACT
Immunogenic cell death (ICD) is a type of cell death that is accompanied by the release of damage-associated molecular patterns (DAMPs) and results in a dead-cell antigen-specific immune response. Here, we report that spautin-1, an inhibitor of ubiquitin-specific peptidases, triggers immunogenic cancer cell death in vitro and in vivo. The anticancer activity of spautin-1 occurs independent of autophagy inhibition, but depends on the intrinsic mitochondrial apoptosis pathway. Spautin-1 causes mitochondrial oxidative injury, which results in JUN transcription factor activation in a JNK-dependent manner. Mechanistically, activation of JUN by spautin-1 leads to apoptosis by upregulation of pro-apoptotic BAD expression. Importantly, the release of TFAM, a mitochondrial DAMP, by apoptotic cells may contribute to spautin-1-induced ICD via its action on the receptor AGER. Indeed, cancer cells treated with spautin-1 in vitro were able to elicit an anticancer immune response when inoculated in vivo, in the absence of any adjuvant. This immunogenic effect of spautin-1-treated cancer cells was lost when TFAM or AGER were neutralized by specific antibodies. Altogether, our results suggest that spautin-1 may stimulate an apoptotic pathway that results in ICD, in TFAM- and AGER-dependent fashion.
Introduction
Evading immune surveillance is an important hallmark of cancer. Several novel therapeutic approaches focus on rebuilding immune surveillance in the tumor microenvironment.1 Accordingly, accumulating evidence suggests that several chemotherapeutic reagents can modulate the immune system and trigger a durable antitumor response through induction of immunogenic cell death (ICD).2,3 ICD is characterized by the cell surface exposure or release of damage-associated molecular patterns (DAMPs) such as calreticulin,4 HMGB1 (high mobility group box 1),5 and adenosine triphosphate (ATP)6 as cancer cells activate premortem stress programs and finally die. These cancer-derived DAMPs can activate antigen-presenting cells (e.g., dendritic cells [DCs]) to trigger a subsequent cytotoxic T lymphocyte response. Defining the mechanisms involved in ICD induced by different stimuli is essential to guide therapeutic intervention.
Spautin-1 was originally identified as an autophagy inhibitor in mammalian cells. Spautin-1 promotes the degradation of PIK3C3 (phosphatidylinositol 3-kinase catalytic subunit type 3, also termed Vps34 in yeast) complexes by inhibiting USP10 (ubiquitin specific peptidase 10) and USP13 (ubiquitin specific peptidase 13).7 The PIK3C3 complex is one of the enzymatic complexes including the core components Beclin 1 (BECN1, also termed Atg6 in yeast) and ATG14 (autophagy related 14) that activate autophagy by promoting the nucleation of the phagophore.8 Inhibition of PIK3C3 complex-mediated autophagy by spautin-1 induces breast cancer cell death under starvation conditions or enhances the anticancer activity of chemotherapy.7,9-11 These findings support the notion that pro-survival autophagy may represent a major impediment to successful cancer therapy.12-14
In this study, we found that spautin-1 exhibited promising cancer-killing effects in certain cancer cell lines in vitro and in mouse xenografts. Surprisingly, the anticancer activity of spautin-1 was not dependent on autophagy inhibition. In contrast, spautin-1 induced BAD (BCL2 associated agonist of cell death)-dependent apoptosis, which contributes to ICD via release of TFAM (transcription factor A, mitochondrial). These findings reveal unexpected mechanistic features of spautin-1 with respect to cell death and antitumor immunity.
Results
Spautin-1 exhibits selective cytotoxicity-independent autophagy
To determine the anticancer activity of spautin-1, we assayed the cell viability of 18 human or mouse cancer cell lines that were exposed to different doses of spautin-1. In general, the tested colon (HCT116, CT26, and MC38), ovarian (HEY, OVCR3, and IGROV4), liver (HepG2), prostate (LNCaP and PC-3), and leukemia (HL-60, Jurkat, and K562) cancer cell lines were sensitive to spautin-1 compared to pancreatic (PANC02 and PANC2.03), cervical (HeLa), kidney (CC4), and breast (ZR-75–1 and MDA231) cancer cell lines under normal nutrition conditions (Fig. 1A). Spautin-1 inhibited starvation condition (Hanks' balanced salt solution [HBSS] medium)-induced MAP1LC3B (microtubule associated protein 1 light chain 3 beta) puncta formation (Fig. 1B) and MAP1LC3B-II expression (Fig. 1C) in HCT116 and CT26 cells, supporting the idea that spautin-1 is an early stage autophagy inhibitor under starvation conditions.7 As expected, chloroquine, a late stage autophagy inhibitor, increased MAP1LC3B-II protein levels in the absence or presence of HBSS (Fig. 1C). Unlike spautin-1, other potent early (3-methyladenine and LY294002) or late (chloroquine and bafilomycin A1) stage autophagy inhibitors did not significantly induce cell death in spautin-1-sensitive cells (HCT116, CT26, and PC-3) when administered alone (Fig. 1D). In stark contrast, these inhibitors increased oxaliplatin- or 5-fluorouracil-induced cell death in HCT116 or CT26 cells (Fig. 1E), supporting previous suggestions that autophagy plays a prosurvival role in the context of chemotherapy.15,16 Additionally, knockdown of Pik3 c3, Becn1, Usp10, and Usp13 by two efficient shRNAs (Fig. 1F) failed to affect the cytotoxic effect of spautin-1 on HCT116 cells (Fig. 1G). Moreover, overexpression of Pik3 c3 or Usp10 (Fig. 1F) did not rescue spautin-1-induced cytotoxicity (Fig. 1G) in Pik3c3- or Usp10-knockdown HCT116 cells. Altogether, these findings suggest that spautin-1 efficiently kills some cancer cell line through an effect that is independent from its autophagy-suppressive potential.
Figure 1.

Spautin-1 exhibits selective cytotoxicity-independent autophagy. (A) Indicated cancer cell lines were treated with spautin-1 (1, 3, and 10 µM) for 24 hours and cell viability was assayed (n = 3, *p < 0.05 versus untreated group, ANOVA). (B) Image analysis of MAP1LC3B puncta formation in HCT116 and CT26 cells with or without HBSS and spautin-1 (10 uM) treatment for three hours (n = 3, *p < 0.05 versus HBSS group, unpaired t-test). (C) Western blot analysis of MAP1LC3B expression in HCT116 cells with or without HBSS, spautin-1 (10 uM), and chloroquine (50 µM) treatment for three hours (n = 3, *p < 0.05 versus HBSS group, unpaired t-test). (D) Indicated cells were treated with spautin-1 (10µM), 3-methyladenine (1 mM), LY294002 (1µM), chloroquine (50µM), and bafilomycin A1 (100 nM) for 24 hours and cell viability was assayed (n = 3, *p < 0.05 versus untreated group, unpaired t-test). (E) Indicated cells were treated with oxaliplatin (50µM) or 5-fluorouracil (15µM) in the absence or presence of 3-methyladenine (1 mM), LY294002 (1µM), chloroquine (50µM), and bafilomycin A1 (100 nM) for 24 hours and then cell viability was assayed (n = 3, *p < 0.05, ANOVA). (F) Q-PCR analysis gene expression in indicated HCT116 cells (n = 3, *p < 0.05 versus control shRNA group, unpaired t-test). (G) Cell viability was assayed in indicated HCT116 cells following spautin-1(10 uM) treatment for 24 hours (n = 3).
Spautin-1 induces the intrinsic apoptotic pathway
To determine whether the cytotoxicity of spautin-1 results from the induction of known pathways of regulated cell death, we evaluated the response of spautin-1-sensitive cancer cells in conditions known to interfere with well-described lethal pathways. Z-VAD-FMK, a cell-permeable pan-caspase inhibitor, significantly blocked spautin-1-induced cell death. In contrast, inhibitors of necroptosis (necrostatin-1 and necrosulfonamide) and ferroptosis (ferrostatin-1 and liproxstatin-1) failed to block spautin-1-induced cell death (Fig. 2A). Unlike apoptotic-deficient cells (Bax−/−/Bak−/- cells), genetic repression of necroptosis (Ripk1−/−, Ripk3−/−, and Mlkl−/− cells), as well as removal of a ferroptosis-related gene (Gpx4−/− cells) from immortalized fibroblast cell lines, had no influence on spautin-1-induced cell death (Fig. 2B). Furthermore, knockdown of effector caspases such as Casp3/Caspase-3 (but not Mlkl and Acsl4 [acyl-CoA synthetase long chain family member 4, a driver of ferroptosis]17,18) by two individual shRNAs (Fig. 2C) reduced spatuin-1-induced death in colorectal cell lines from two different species, namely, humans (HCT116) and mice (CT26) (Fig. 2D). These findings support the idea that caspase-dependent apoptosis, but not necroptosis and ferroptosis, contributes to the cytotoxicity of spautin-1.
Figure 2.
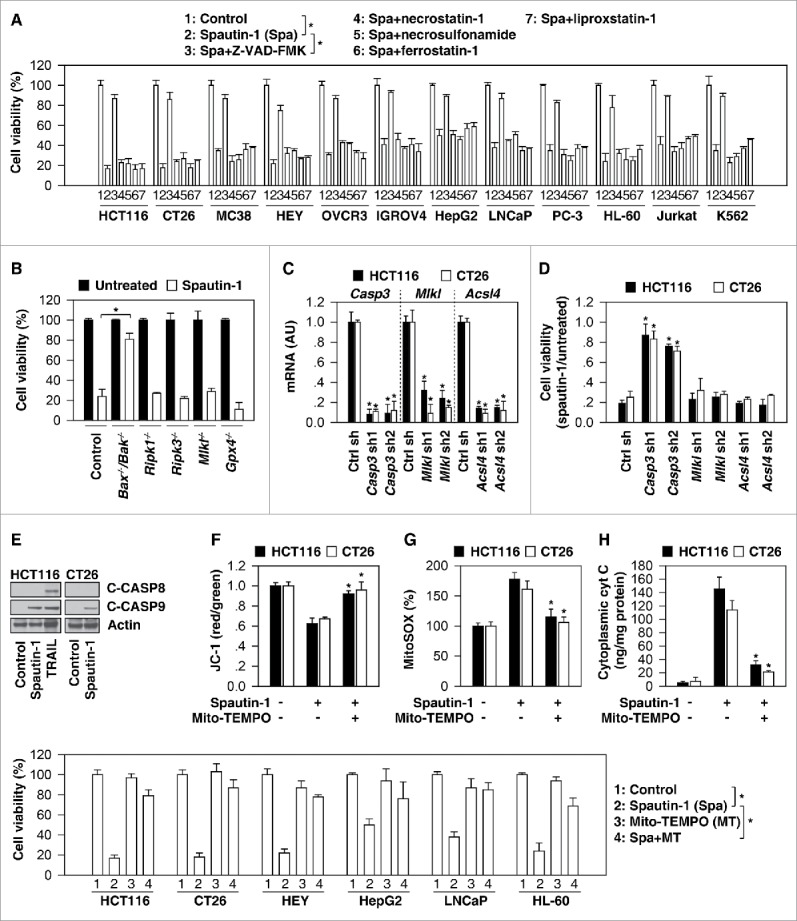
Spautin-1 induces the intrinsic apoptotic pathway. (A) Indicated cancer cells were treated with spautin-1 (10µM) in the absence or presence of ZVAD-FMK (20 µM), necrostatin-1 (10 µM), necrosulfonamide (1 µM), ferrostatin-1 (500 nM), and liproxstatin-1 (200 nM) for 24 hours. Cell viability was assayed (n = 3, *p < 0.05, unpaired t-test). (B) Indicated gene-deficient cells were treated with spautin-1 (10 µM) for 24 hours and cell viability was assayed (n = 3, *p < 0.05, unpaired t-test). (C) Q-PCR analysis of indicated gene expression in indicated knockdown cells (n = 3, *p < 0.05 versus control shRNA group, unpaired t-test). (D) Knockdown of Casp3, but not Mlkl and Acsl4, inhibited spautin-1-(10 uM, 24 h) induced cell death in HCT116 and CT26 cells (n = 3, *p < 0.05 versus control shRNA group, unpaired t-test). (E) Western blot analysis of expression of indicated proteins in HCT116 and CT26 cells following treatment with spautin-1 (10 uM) or TRAIL (50 ng/ml) for 24 hours. (E-H) Analysis of mitochondrial membrane potential (JC-1), mitochondrial ROS (MitoSOX), and cytoplasmic cytochrome C levels in HCT116 and CT26 cells following treatment with spautin-1 (10 uM) in the absence or presence of Mito-TEMPO (10 uM) for 24 hours (n = 3, *p < 0.05 versus spautin-1 group, unpaired t-test). (I) Indicated cancer cells were treated with spautin-1 (10µM) in the absence or presence of Mito-TEMPO (10 uM) for 24 hours. Cell viability was assayed (n = 3, *p < 0.05, unpaired t-test).
The two main pathways of apoptosis are the extrinsic cell death receptor and the intrinsic mitochondrial pathway, which can be initiated by different stimuli.19 Western blots revealed that cleaved-CASP9/caspase-9 (a marker of the intrinsic pathway), but not cleaved-CASP8/caspase-8 (a marker of the extrinsic pathway) was increased following spautin-1 treatment in HCT116 or CT26 cells (Fig. 2E). Consistent with a previous report,20 TRAIL caused the proteolytic maturation of both CASP8 and CASP9 in HCT116 cells (Fig. 2E). Moreover, intrinsic pathway mitochondrial events, such as the loss of mitochondrial membrane potential (monitoring using JC-1 dye, Fig. 2F), production of mitochondrial reactive oxygen species (ROS) (monitoring by means of the fluorescent sensor MitoSOX, Fig. 2G), and release of cytochrome c from mitochondria to the cytoplasm (Fig. 2H), were increased in colon cancer cells upon spautin-1 stimuli. Mito-TEMPO, a mitochondria-targeted antioxidant,21 attenuated these mitochondrial events (Fig. 2F-2H) and reversed cell death (Fig. 2I) in response to spautin-1. These studies indicate that spautin-1-induced mitochondrial oxidative injury activates the intrinsic apoptotic pathway.
Upregulation of BAD facilitates spautin-1-induced apoptosis
BCL2 family proteins play a fundamental role in the control of mitochondrial membrane permeability in apoptosis.22 This group of structurally related proteins comprises pro-apoptotic (e.g., BAX [BCL2 associated X, apoptosis regulator], BAK [BCL2 antagonist/killer], BID [BH3 interacting domain death agonist], BCL2L11/BIM [BCL2 like 11], BBC3/PUMA [BCL2 binding component 3], and BAD) and anti-apoptotic members (e.g., BCL2 [BCL2, apoptosis regulator], BCL2L1/BCL-XL [BCL2 like 1], and MCL1 [BCL2 family apoptosis regulator]) that interact among each other. We therefore determined whether spautin-1 regulates the expression of BCL2 family members. Real-time quantitative PCR (Q-PCR) analysis indicated that the mRNA of Bad, but not the mRNAs of other BCL2 family members (Bax, Bak, Bid, Bcl2l11, Bbc3, Bcl2, Bcl2l1, and Mcl1), were upregulated in HCT116 and CT26 cells following spautin-1 treatment (Fig. 3A). Western blot analysis further confirmed that the protein expression of BAD (but not BBC3, BAX, BCL2L1, and BCL2) was dose-dependently induced by spautin-1 in HCT116 cells (Fig. 3B). Moreover, spautin-1-induced BAD mRNA upregulation was observed in other spautin-1-senstive cancer cell lines (HEY, HEPG2, LNCaP, and HL-60), but not spautin-1-resistant cancer cell lines (PANC02, HeLa, CC4, and ZR-75–1) (Fig. 3C), indicating a potential role for BAD in determining the sensitivity to spatuin-1.
Figure 3.
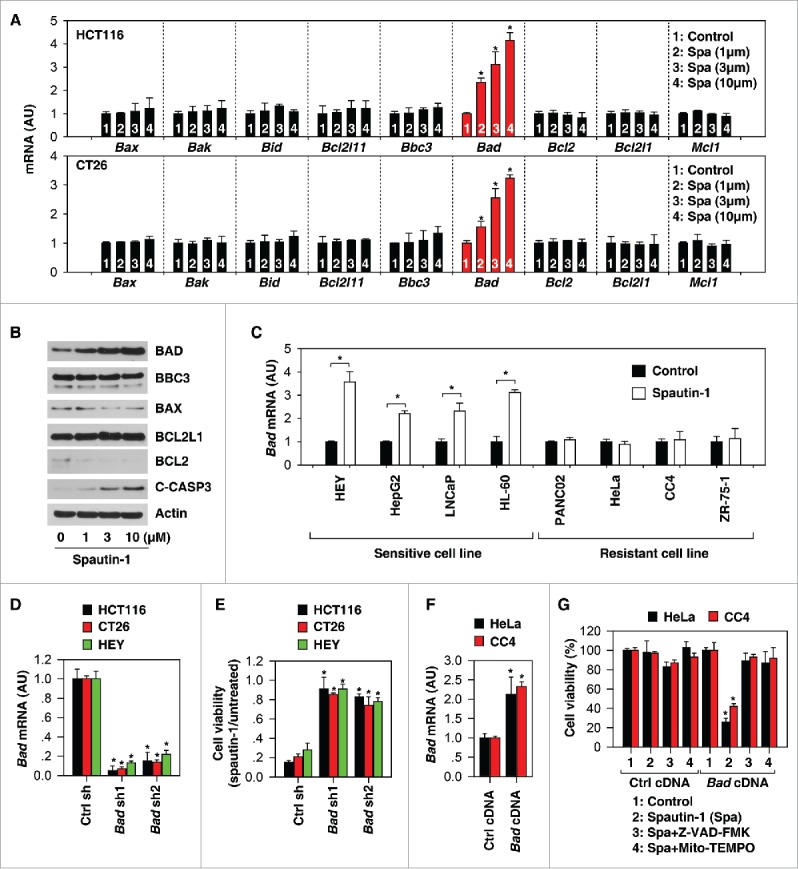
Upregulation of BAD facilitates spautin-1-induced apoptosis. (A) Q-PCR analysis of indicated gene expression in HCT116 and CT26 cells following treatment with spautin-1 (1, 3, and 10 µM) for 24 hours (n = 3, *p < 0.05 versus untreated group, unpaired t-test). (B) Western blot analysis of expression of indicated proteins in HCT116 cells following treatment with spautin-1 (1, 3, and 10 µM) for 24 hours. (C) Q-PCR analysis of Bad gene expression in indicated cancer cells following treatment with spautin-1 (10 µM) for 24 hours (n = 3, *p < 0.05 versus untreated group, unpaired t-test). (D) Q-PCR analysis of Bad gene expression in indicated Bad knockdown cancer cells (n = 3, *p < 0.05 versus control shRNA group, unpaired t-test). (E) Knockdown of Bad inhibited spautin-1-(10 µM) induced cell death in indicated cells (n = 3, *p < 0.05 versus control shRNA group, unpaired t-test). (F) Q-PCR analysis of Bad gene expression in indicated Bad knockin cancer cells (n = 3, *p < 0.05 versus control cDNA group, unpaired t-test). (G) Knockin of Bad increased spautin-1-(10 µM) induced cell death in HeLa and CC4 cells (n = 3, *p < 0.05 versus control cDNA group, unpaired t-test).
Further experiments were performed to determine whether a change in BAD expression would affect spautin-1 activity. Knockdown of Bad by specific shRNAs (Fig. 3D) inhibited spautin-1-induced cell death (Fig. 3E) in HCT116, CT26, and HEY cell lines. Moreover, the transfection-enforced increase of BAD expression (Fig. 3F) restored spautin-1 sensitivity in HeLa and CC4 cell lines; these effects were inhibited by Z-VAD-FMK and Mito-TEMPO (Fig. 3G). Altogether, these results indicate that BAD upregulation contributes to spautin-1-induced apoptosis.
JNK activation is required for spautin-1-induced BAD expression
MAPK (mitogen-activated protein kinase) family members, including ERK (extracellular signal-regulated kinase), JNK (c-Jun N-terminal kinase), and p38 MAPK, play a complex role in the outcome and sensitivity to apoptotic stimuli.23 Spautin-1 induced phosphorylation of JNK and p38 (but not ERK) in HCT116 and CT26 cells (Fig. 4A). Interestingly, pretreatment with JNK inhibitors such as SP600125 and CC-401 (but not p38 inhibitors [SB203580 and SB239063] and ERK inhibitors [SCH772984 and LY3214996]) blocked spautin-1-induced BAD upregulation (Fig. 4B) and subsequent death (Fig. 4C), indicating that JNK activation is required for spautin-1-induced BAD upregulation in apoptosis.
Figure 4.

JNK activation is required for spautin-1-induced BAD expression. (A) Western blot analysis of expression of indicated proteins in HCT116 and CT26 cells following treatment with spautin-1 (10 uM) for 24 hours. (B, C) Indicated cells were treated with spautin-1 (10 uM) in the absence or presence of SP600125 (500 nM), CC-401 (100 nM), SB203580 (1 uM), SB239063 (100 nM), SCH772984 (100 nM), and LY3214996 (50 nM) for 24 hours. Bad mRNA and cell viability were assayed (n = 3, *p < 0.05, unpaired t-test). (D) Western blot analysis of expression of indicated proteins in HCT116 and CT26 cells following treatment with spautin-1 (10 uM) in the absence or presence of SP600125 (500 nM) or CC-401 (100 nM) for 24 hours. (E) Q-PCR analysis of Jun gene expression in indicated Jun knockdown cancer cells (n = 3, *p < 0.05 versus control shRNA group, unpaired t-test). (F-I) Knockdown of Jun inhibited spautin-1-(10µM) induced Bad mRNA expression (F), cell death (G), Bad promoter activity (H), and CASP3 activity (I) in indicated cells (n = 3, *p < 0.05 versus control shRNA group, unpaired t-test).
Given that the transcriptional activity of JUN/c-Jun (Jun proto-oncogene, AP-1 transcription factor subunit) is regulated by JNK activation in cell death, we next investigated whether JUN regulates BAD expression.24 SP600125 and CC-401 inhibited spautin-1-induced phosphorylation of JUN (Fig. 4D). Like pharmacologic inhibition of JNK, genetic knockdown of JUN by shRNA (Fig. 4E) blocked spautin-1-induced BAD upregulation (Fig. 4F) and subsequent death (Fig. 4G). These findings, in combination with further luciferase reporter-gene (Fig. 4H) and CASP3 activation (Fig. 4I) assays, indicate that BAD is a target gene of JUN, contributing to spautin-1-induced apoptosis.
Apoptotic signaling molecules are required for spautin-1-induced ICD
Accumulating evidence indicates that certain anticancer therapies can induce immunogenic apoptotic cell death through the release of DAMPs such as HMGB1 and ATP, which function as adjuvants to activate host antitumor immune responses.5,6,25,26 Compared to treatment with oxaliplatin (a classical ICD inducer27), the release of ATP and HMGB1 was relatively sparse in HCT116 and CT26 cells responding to spatuin-1 (Fig. 5A). In contrast, the release of TFAM (a mitochondrial DAMP) was increased in response to spatuin-1 compared to oxaliplatin treatment (Fig. 5A). Knockdown of BAD and JUN (Fig. 5B) or administration of Z-VAD-FMK, SP600125, and CC-401 inhibited spautin-1-induced TFAM and HMGB1 release (Fig. 5C), indicating that apoptotic signaling is required for spautin-1-induced DAMP release.
Figure 5.
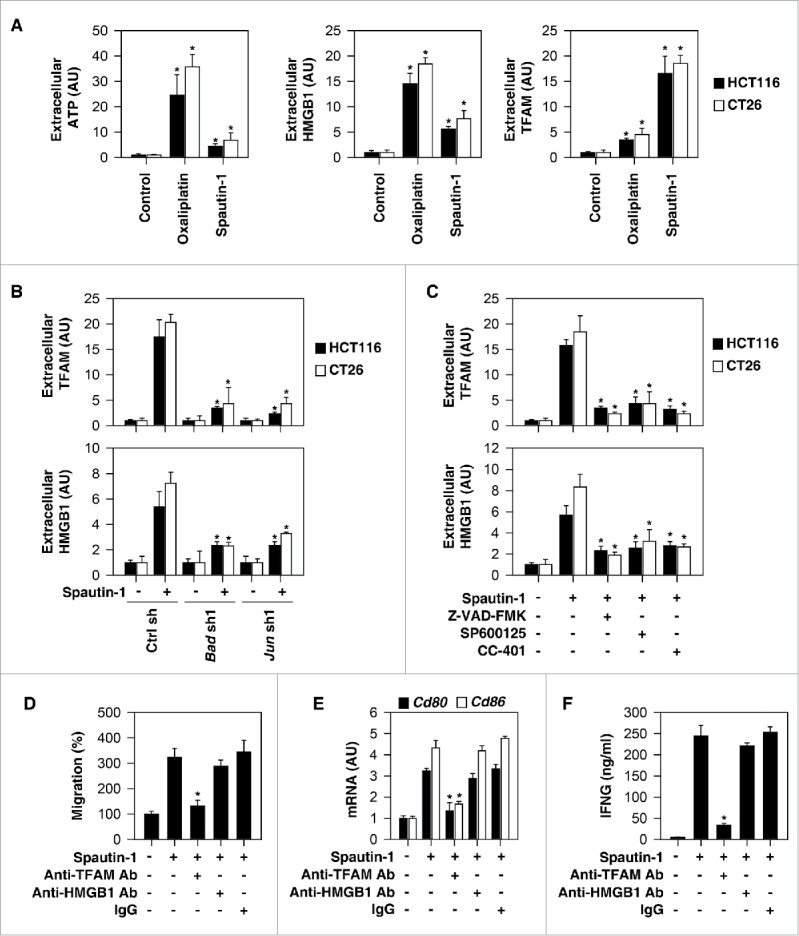
Apoptotic signaling molecules are required for spautin-1-induced ICD. (A) Analysis of ATP, HMGB1, and TFAM release in indicated cells following treatment with spautin-1 (10µM) or oxaliplatin (50µM) for 24 hours (n = 3, *p < 0.05 versus control group, unpaired t-test). (B) Knockdown of Bad or Jun inhibited spautin-1 (10µM, 24 hours)-induced HMGB1 and TFAM release in in indicated cells (n = 3, *p < 0.05 versus control shRNA group, unpaired t-test). (C) Administration of Z-VAD-FMK (20µM), SP600125 (500 nM), or CC-401 (100 nM) inhibited spautin-1 (10µM, 24 hours)-induced HMGB1 and TFAM release in in indicated cells (n = 3, *p < 0.05 versus spautin-1 group, unpaired t-test). (D) Anti-TFAM Ab (10 mg/ml), but not anti-HMGB1 Ab (10 mg/ml) or control IgG (10 mg/ml), inhibited DC2.4 cell migration in response to spautin-1-treated CT26 cells (n = 3, *p < 0.05 versus control group, unpaired t-test). (E) Anti-TFAM Ab (10 mg/ml), but not anti-HMGB1 Ab (10 mg/ml) or control IgG (10 mg/ml), inhibited CD80 and CD86 expression in DC2.4 cells in response to spautin-1-treated CT26 cells (n = 3, *p < 0.05 versus control group, unpaired t-test). (F) Anti-TFAM Ab (10 mg/ml), but not anti-HMGB1 Ab (10 mg/ml) or control IgG (10 mg/ml), inhibited IFN-γ release in mouse splenic CD8+ T cells in response to spautin-1-treated CT26 cells (n = 3, *p < 0.05 versus control group, unpaired t-test).
To determine whether HMGB1 and TFAM promote the recruitment and activation of antigen-presenting cells in vitro, we used the DC2.4 mouse DC line as a model to perform transwell cell invasion assay in response to supernatants of spautin-1-treated CT26 cells. These supernatants induce cell migration (Fig. 5D) and mRNA expression of costimulatory molecules (CD80 and CD86) (Fig. 5E) in DC2.4 cell lines. Neutralization of TFAM antibody, but not HMGB1, by specific antibodies, reduced supernatant-induced cell migration (Fig. 5D) and mRNA expression of CD80 and CD86 (Fig. 5E). Anti-TFAM antibody also abolished the capacity of spautin-1-treated CT26 cells to prime T cells for IFNG/IFN-γ (interferon gamma) production (Fig. 5F). In sum, these results raise the possibility that the release of TFAM contributes to spautin-1-induced ICD.
Spautin-1-induced ICD suppressed tumor growth in vivo
To determine whether spautin-1-induced ICD suppressed tumor growth in vivo, spautin-1-treated CT26 cells were injected subcutaneously into the right flank of immunocompetent BALB/c mice. Used as a tumor vaccine, spautin-1-treated CT26 were able to protect the majority of mice against rechallenge with live CT26 cells injected into the opposite flank one week later (Fig. 6A). As a positive control, oxaliplatin-treated CT26 cells vaccinated as efficiently as spautin-1-treated cells against cancer (Fig. 6A).
Figure 6.

Spautin-1-induced ICD suppressed tumor growth in vivo. (A) CT26 cells were treated with oxaliplatin (50µM) or spautin-1 (10µM) for 24 h in vitro before the subcutaneous injection of the dying cells in one flank. At day 7, mice were inoculated with live syngeneic tumor cells in the opposite flank and tumor growth was monitored. The percentage of tumor-free mice is indicated (n = 10 mice/group, *p < 0.05). (B) The depletion of TFAM or AGER (but not HMGB1 and control IgG [data not shown]) with a specific blocking antibody (20 mg/kg) abolished the capacity of spautin-1 treated tumor cells to vaccinate against CT26 tumor cells. The percentage of tumor-free mice is indicated (n = 10 mice/group, *p < 0.05). (C) The depletion of HMGB1 (but not TFAM and control IgG [data not shown]) with a specific blocking antibody (20 mg/kg) abolished the capacity of oxaliplatin-treated tumor cells to vaccinate against CT26 tumor cells. The percentage of tumor-free mice is indicated (n = 10 mice/group, *p < 0.05). (D, E) Analysis of expression of indicated cytokines and chemokines in tumor (D) and surface marker expression of CD8α+ CD11c*+ DCs in spleens of treated mice at day 15 post-tumor inoculation in the setting of panel B (n = 5 mice/group, *p < 0.05, unpaired t-test). (F) Schematic summary of the mechanism and role of TFAM release in the mediated spautin-1-induced immunogenic apoptotic cell death.
Next, we investigated whether blocking TFAM activation would affect spautin-1-induced ICD. AGER/RAGE (advanced glycosylation end-product specific receptor) is a receptor of TFAM in immune cells.28 When spautin-1-killed CT26 cells were co-administered together with anti-TFAM or anti-AGER antibodies (but not anti-HMGB1) they failed to elicit protection against CT26 cancers (Fig. 6B). This contrasts with the observation that anti-HMGB1 (but not anti-TFAM) antibody limited the cancer-protective activity of a vaccine composed by oxaliplatin-treated CT26 cells (Fig. 6C). These results confirm previous findings that HMGB1 is a mediator of oxaliplatin-induced ICD5 at the same as they demonstrate the HMGB1 is not required for spautin-1-induced ICD.
To further characterize the influence of spautin-1 on the tumor microenvironment, we analyzed cytokine mRNA profiles in tumor tissue by Q-PCR. These studies revealed that spautin-1 treatment of established tumors increased mRNA levels of Ifnb1/Ifn-β (interferon beta 1), Cxcl10 (C-X-C motif chemokine ligand 10), Il12b/Il-12p40 (interleukin 12B), Ifng, Il6/Il-6 (interleukin 6), and Il5/Il-5 (interleukin 5), indicative of a proinflammatory mixed Th1/Th2 profile (Fig. 6D). Analysis of splenic CD8α+ DCs from spautin-1 treated mice revealed increased expression levels of CD69, CD80, CD86, and MHC-II (major histocompatibility complex, class II), indicative of a mature DC phenotype (Fig. 6E). Importantly, these effects were reversed by injection of antibodies neutralizing TFAM, AGER, but not HMGB1 (Fig. 6D and 6E). Altogether, these results indicated that the TFAM-AGER pathway contributes to the immunogenicity of spautin-1-induced cell death.
Discussion
Therapy-induced ICD has emerged as a powerful tool to boost the immune system to fight against cancer and infectious disease.2 Although DAMPs play an essential role in mediating ICD as immune adjuvanticity, they may exhibit different dynamic behaviors under different death stimuli such as exposure of the endoplasmic reticulum chaperone calreticulin on the outer plasma membrane surface by early apoptotic cells, secretion of ATP by autophagic cells, and release of HMGB1 by late apoptotic or secondary necrotic cells. In this study, we demonstrate that TFAM could act as a specific mitochondrial DAMP involved in spatuin-1-induced immunogenic apoptotic cell death, therefore highlighting new mechanistic insights into ICD elicited by chemotherapeutics.
system driven by ATG proteins and their posttranslational modifications.29 It plays dual roles in cancer biology30 and can induce autophagic cell death that may generally act immunogenically.6 Spautin-1 was initially studied in the inhibition of autophagy though degradation of components of PIK3C3 complexes, including BECN1.7 Our results indicate that the anticancer activity of spautin-1 is not dependent on its known function in the suppression of autophagy and deubiquitinating enzymes. In contrast, spautin-1 may play a role in the induction of caspase-dependent apoptosis, but not other types of regulated cell death such as necroptosis and ferroptosis. In cells treated with spautin-1, we found that increased oxidative damage from mitochondria drives apoptosis through upregulation of BAD. BAD promotes apoptosis by displacing BAX from binding to BCL2 and BCL2L1, which finally results in the release of mitochondrial death inducers such as cytochrome c.31 In contrast, the binding of BAD to 14–3-3 proteins limits the pro-apoptotic activity of BAD.32
Our findings confirm and extend the idea that the JNK pathway plays a critical role in various forms of apoptosis.33 Activation of JNK can trigger apoptosis through at least two mechanisms: upregulation of pro-apoptotic genes via the transactivation of specific transcription factors, or direct phosphorylation of apoptotic regulators such as BCL2 family proteins, including BAD.33 JNK-mediated BAD phosphorylation at Ser128 induces apoptosis in primary granule neurons of the rat cerebellum.34 In contrast, JNK-mediated BAD phosphorylation at Thr201 limits interleukin-3 withdrawal-induced apoptosis in FL5.12 cells (a murine prolymphocytic cell line).35 In this study, we indicate that JNK is one of the downstream effectors of spautin-1 and activation of JNK promotes apoptosis through JUN-dependent BAD expression in several solid cancer cell lines. Thus, the function of JNK in apoptosis is dependent on the cell type and stimulus used.
We provided additional data to support that TFAM is a new driver of immunogenic apoptotic cell death. TFAM is a highly abundant mitochondrial protein that is structurally related to HMGB1, the prototypical nuclear DAMP, in various types of cell death and tissue injury.36 Although we observed an increase in the release of HMGB1, the contribution of HMGB1 to spautin-1-induced ICD seems to be limited. The immunity stimulatory activity of HMGB1 is defined by its release mechanism and redox status, as well as receptors.37 For example, HMGB1 can be oxidized by ROS in apoptosis, thereby promoting tolerance.38 Binding of HMGB1 to CD24 or HAVCR2/TIM3 (hepatitis A virus cellular receptor 2) also limits its immune activity in some cases.39,40 As a mitochondrial DAMP, release of TFAM has been implicated in various immune and inflammatory pathologies through various receptors, including AGER.28,41,42 We demonstrated that blocking the TFAM-AGER pathway limits spautin-1-induced ICD. These findings reinforce the notion that mitochondrial signals control danger signals and immune responses.43,44
In summary, the current studies summarize preclinical evidence that spautin-1 elicits ICD in DAMP-associated adaptive immunity. The immunogenicity of spautin-1-induced apoptosis is controlled by TFAM, which may restore anticancer immunesurveillance. Further investigations are needed to identify the significance of TFAM release in other forms of ICD driven by different anticancer agents.
Materials and methods
Antibodies and reagents
The antibodies to MAP1LC3B (#3868), actin (#3700), c-CASP8 (#8592 and #9496), C-CASP9 (#9505 and #9509), BAD (#9268), BBC3 (#4976), BAX (#2772), BCL2L1 (#2764), BCL2 (#2872), C-CASP3 (#9664), JNK (#9252), p-JNK (#9255), ERK (#4695), p-ERK (#4370), p38 (#8690), p-p38 (#4511), JUN (#9165), and p-JUN (#3270) were obtained from Cell Signaling Technology (Danvers, MA, USA). Monoclonal anti-HMGB1 neutralizing antibody (clone 2G7) was a gift from Dr. Kevin Tracey. Monoclonal anti-TFAM neutralizing antibody (clone F-6; #sc-166965) was obtained from Santa Cruz Biotechnology (Dallas, Texas, USA). Monoclonal anti-AGER neutralizing antibody (clone 697023; #MAB11795) was obtained from R&D System (Minneapolis, MN, USA). Spautin-1 (#S7888), 3-methyladenine (#S2767), LY294002 (#S1105), chloroquine (#S4157), bafilomycin A1 (#S1413), oxaliplatin (#S1224), Z-VAD-FMK (#S7023), necrostatin-1 (#S8037), necrosulfonamide (#S8251), ferrostatin-1 (#S7234), liproxstatin-1 (#S7699), SP600125 (#S1460), SB203580 (#S1076), SB239063 (#S7741), SCH772984 (#S7101), and LY3214996 (#S8534) were obtained from Selleck Chemicals (Houston, TX, USA). 5-fluorouracil (#F6627), TRAIL (#T5694), Mito-TEMPO (#SML0737), and CC-401 (#SML1613) were obtained from Sigma (St. Louis, MO, USA).
Cell culture
All tumor cell lines were obtained from American Type Culture Collection (ATCC, USA) or the National Cancer Institute (NCI, USA). DC2.4 cells were obtained from Millipore (Temecula, CA, USA). Ripk1−/−, Ripk3−/−, and Mlkl−/− mouse embryonic fibroblasts (MEFs) were a gift from Dr. Douglas Green. Gpx4−/- MEFs were a gift from Dr. Marcus Conrad. Bax−/−/Bak−/− MEFs were purchased from ATCC. These cells were grown in Dulbecco's Modified Eagle's Medium or RPMI-1640 Medium with 10% fetal bovine serum, 2 mM L-glutamine, and 100 U/ml of penicillin and streptomycin. All cells were mycoplasma-free and authenticated by Short Tandem Repeat DNA Profiling Analysis.
Mouse CD8+ T cell isolation
The EasySep™ Mouse CD8+ T Cell Isolation Kit (#19853, STEMCELL Technologies Inc., Cambridge, MA, USA) was used to isolate CD8+ T cells from single-cell suspensions of splenocytes by negative selection. Unwanted cells were targeted for removal with biotinylated antibodies directed against non-CD8+ T cells and streptavidin-coated magnetic particles (RapidSpheres™). Labeled cells were separated using an EasySep™ magnet without the use of columns. Desired cells were poured off into a new tube.
Enrichment of splenic DCs
DCs were enriched using the Dynabeads Mouse DC Enrichment Kit (#11429D, Thermo Fisher Scientific Inc., Pittsburgh, PA, USA) according to the manufacturer's instructions. For enrichment of DC subsets, biotinylated antibodies were added during magnetic bead separation to obtain total splenic DCs. DC maturation was determined by flow cytometry using antibodies to CD69 (clone H1.2F3; #11–0691-81; Thermo Fisher Scientific Inc.), CD80 (clone 16–10A1; #11–0801-81; Thermo Fisher Scientific Inc.), CD86 (clone GL-1; #MA1–10300; Thermo Fisher Scientific Inc.), and MHC-II (clone M5/114.15.2; #36–5321-85, Thermo Fisher Scientific Inc.).
Cell viability assay
Cell viability was evaluated using the Cell Counting Kit-8 (CCK-8) (#96992, Sigma) according to the manufacturer's instructions. The assay is based on utilizing the highly water-soluble tetrazolium salt WST-8 [2-(2-methoxy-4-nitrophenyl)-3-(4-nitrophenyl)-5-(2,4-disulfophenyl)-2H-tetrazolium,monosodium salt] to produce a water-soluble formazan dye upon reduction in the presence of an electron carrier. Absorbance at 450 nm is proportional to the number of living cells in the culture.
Western blot analysis
Proteins in the cell lysate were resolved on 4%-12% Criterion XT Bis-Tris gels (#3450124, Bio-Rad, Hercules, CA, USA) and transferred to a nitrocellulose membrane.45-47 After blocking with 5% milk, the membrane was incubated for two hours at 25°C or overnight at 4°C with various primary antibodies. After incubation with peroxidase-conjugated secondary antibodies for one hour at routine temperature, the signals were visualized via using SuperSignal™ West Pico Chemiluminescent Substrate (Thermo Fisher Scientific Inc., #34080) or SuperSignal™ West Femto Maximum Sensitivity Substrate (Thermo Fisher Scientific Inc., #34095) and blots were analyzed using the ChemiDoc™ Touch Imaging System (Bio-Rad). Image Lab™ Software (Bio-Rad) was used for relative quantification of bands, normalized to total protein loaded in each lane.
MAP1LC3B puncta formation assays
Cells were seeded in six-well plates and cultured in the presence of various stimuli for given times, then fixed with 3% paraformaldehyde and stained with MAP1LC3B antibody (1:500). Secondary antibodies were goat IgG-conjugated Alexa 647 fluorochromes. Nuclear morphology was visualized with the fluorescent dye Hoechst 33342 (Sigma). Images were collected using a laser-scanning confocal microscope (Fluoview FV-1000; Olympus) using a 60x Plan Apo/1.45 oil immersion objective at 25°C and were captured and analyzed by Fluoview software (FV10-ASW 1.6; Olympus, Olympus Corp, Tokyo, Japan).48
RNAi and gene transfection
The human Pik3c3-shRNA-1 (Sequence: CCGGGAGATGTACTTGAACGTAATGCTCGAGCATTACGTTCAAGTACATCTCTTTTTG); human Pik3c3-shRNA-2 (Sequence: CCGGGTTGAAGTTCTCAGGACTATACTCGAGTATAGTCCTGAGAACTTCAACTTTTTG); human Becn1-shRNA-1 (Sequence: CCGGCCCGTGGAATGGAATGAGATTCTCGAGAATCTCATTCCATTCCACGGGTTTTTG); human Becn1-shRNA-2 (Sequence: CCGGCTCAAGTTCATGCTGACGAATCTCGAGATTCGTCAGCATGAACTTGAGTTTTTG); human Usp10-shRNA-1 (Sequence: CCGGCCTATGTGGAAACTAAGTATTCTCGAGAATACTTAGTTTCCACATAGGTTTTT); human Usp10-shRNA-2 (Sequence: CCGGCCCATGATAGACAGCTTTGTTCTCGAGAACAAAGCTGTCTATCATGGGTTTTT); human Usp13-shRNA-1 (Sequence: CCGGGCCAGTATCTAAATATGCCAACTCGAGTTGGCATATTTAGATACTGGCTTTTT); human Usp13-shRNA-2 (Sequence: CCGGCGCCTGATGAACCAATTGATACTCGAGTATCAATTGGTTCATCAGGCGTTTTT); human Casp3-shRNA-1 (Sequence: CCGGCCGAAAGGTGGCAACAGAATTCTCGAGAATTCTGTTGCCACCTTTCGGTTTTT); human Casp3-shRNA-2 (Sequence: CCGGCCTGAGATGGGTTTATGTATACTCGAGTATACATAAACCCATCTCAGGTTTTT); mouse Casp3-shRNA-1 (Sequence: CCGGGCACATTCTCACTCGCGTTAACTCGAGTTAACGCGAGTGAGAATGTGCTTTTTG); mouse Casp3-shRNA-2 (Sequence: CCGGCTACAGCACCTGGTTACTATTCTCGAGAATAGTAACCAGGTGCTGTAGTTTTTG); human Mlkl-shRNA-1 (Sequence: CCGGCCTCTGACAGTAACTTTGATACTCGAGTATCAAAGTTACTGTCAGAGGTTTTTTG); human Mlkl-shRNA-2 (Sequence: CCGGGAGTCAAATCTACAGCATATCCTCGAGGATATGCTGTAGATTTGACTCTTTTTTG); mouse Mlkl-shRNA-1 (Sequence: CCGGCGGACAGCAAAGAGCACTAAACTCGAGTTTAGTGCTCTTTGCTGTCCGTTTTT); mouse Mlkl-shRNA-2 (Sequence: CCGGGCAGGATTTGAGTTAAGCAAACTCGAGTTTGCTTAACTCAAATCCTGCTTTTT); human Acsl4-shRNA-1 (Sequence: CCGGGCAGTAGTTCATGGGCTAAATCTCGAGATTTAGCCCATGAACTACTGCTTTTTG); human Acsl4-shRNA-2 (Sequ-ence: CCGGCCAGTGTTGAACTTCTGGAAACTCGAGTTTCCAGAAGTTCAACACTGGTTTTTG); mouse Acsl4-shRNA-1 (Sequence: CCGGGCAGAAGATTATTGTGTTGATCTCGAGATCAACACAATAATCTTCTGCTTTTT); mouse Acsl4-shRNA-2 (Sequence: CCGGGCAGAGTGAATAACTTTGGAACTCGAGTTCCAAAGTTATTCACTCTGCTTTTT); human Bad-shRNA-1 (Sequence: CCGGCCGGAGTCGCCACAGCTCCTACTCGAGTAGGAGCTGTGGCGACTCCGGTTTTTG); human Bad-shRNA-2 (Sequence: CCGGGACTCCTTTAAGAAGGGACTTCTCGAGAAGTCCCTTCTTAAAGGAGTCTTTTTG); mouse Bad-shRNA-1 (Sequence: CCGGTGGGATCGAAACTTGGGCAAACTCGAGTTTGCCCAAGTTTCGATCCCATTTTT); mouse Bad-shRNA-2 (Sequence: CCGGCGAAGGATGAGCGATGAGTTTCTCGAGAAACTCATCGCTCATCCTTCGTTTTTG); human Jun-shRNA-1 (Sequence: CCGGTGGGTGCCAACTCATGCTAACCTCGAGGTTAGCATGAGTTGGCACCCATTTTTG); human Jun-shRNA-2 (Sequence: CCGGCCAGCGTATCTATATGGAATTCTCGAGAATTCCATATAGATACGCTGGTTTTTG); mouse Jun-shRNA-1 (Sequence: CCGGGCTGGCATCCACGGCCAACATCTCGAGATGTTGGCCGTGGATGCCAGCTTTTTG); mouse Jun-shRNA-2 (Sequence: CCGGCGGTGCCTACGGCTACAGTAACTCGAGTTACTGTAGCCGTAGGCACCGTTTTTG) were obtained from Sigma. Bad-cDNA (#35567) were obtained from Addgene (Cambridge, MA, USA). Pik3c3-cDNA (#RC205317) and Usp10-cDNA (#RC200835) were obtained from OriGene Technologies (Rockville, MD, USA). Transfections were performed with Lipofectamine™ 3000 (#L3000008, Invitrogen) according to the manufacturer's instructions.
Quantitative real time polymerase chain reaction (Q-PCR) analysis
First-strand cDNA synthesis was carried out using a reverse transcription system kit according to the manufacturer's instructions (#11801–025, OriGene Technologies). cDNA from various cell samples was amplified with specific primers (human Pik3c3: 5′-GCGTTCTTTGCTGGCTGCACAA-3′ and 5′- CTCCAAGCAATGCCTGTAGTCTC-3′; human Becn1: 5′- CTGGACACTCAGCTCAACGTCA-3′ and 5′- CTCTAGTGCCAGCTCCTTTAGC-3′; human Usp10: 5′-AAATGCCACCGAACCTATCGGC-3′ and 5′- CAGCCATTCAGACCGATCTGGA-3′; human Usp13: 5′- CCTCTAACAGGCAGCAAGATGC-3′ and 5′- GCACTGAATGCGTTCTTCCACC-3′; human Bax: 5′-TCAGGATGCGTCCACCAAGAAG-3′ and 5′- TGTGTCCACGGCGGCAATCATC-3′; mouse Bax: 5′- AGGATGCGTCCACCAAGAAGCT-3′ and 5′- TCCGTGTCCACGTCAGCAATCA-3′; human Bak: 5′-TTACCGCCATCAGCAGGAACAG-3′ and 5′- GGAACTCTGAGTCATAGCGTCG-3′; mouse Bak: 5′- GGAATGCCTACGAACTCTTCACC-3′ and 5′- CAAACCACGCTGGTAGACGTAC-3′; human Bid: 5′-TGGGACACTGTGAACCAGGAGT-3′ and 5′- GAGGAAGCCAAACACCAGTAGG-3′; mouse Bid: 5′- CCACAACATTGCCAGACATCTCG-3′ and 5′-TCACCTCATCAAGGGCTTTGGC-3′; human Bcl2l11: 5′-CAAGAGTTGCGGCGTATTGGAG-3′ and 5′- ACACCAGGCGGACAATGTAACG-3′; mouse Bcl2l11: 5′- GGAGATACGGATTGCACAGGAG-3′ and 5′- CTCCATACCAGACGGAAGATAAAG-3′; human Bbc3: 5′- ACGACCTCAACGCACAGTACGA-3′ and 5′- CCTAATTGGGCTCCATCTCGGG -3′; mouse Bbc3: 5′-ACCGCTCCACCTGCCGTCAC-3′ and 5′- ACGGGCGACTCTAAGTGCTGC-3′; human Bad: 5′- CCAACCTCTGGGCAGCACAGC-3′ and 5′- TTTGCCGCATCTGCGTTGCTGT-3′; mouse Bad: 5′-CGACTTTTGGCATTCCGAGGCT-3′ and 5′- GTGCTCTCCTTAATCGCCGTCT-3′; human Bcl2: 5′-CGACTTTTGGCATTCCGAGGCT-3′ and 5′- GTGCTCTCCTTAATCGCCGTCT -3′; mouse Bcl2: 5′-GGGAGCAACATTCATCAGCAGG-3′ and 5′- CGTCCTCGAAAAGGGCTAAGCT-3′; human Bcl2l1: 5′- GCCACTTACCTGAATGACCACC-3′ and 5′- AACCAGCGGTTGAAGCGTTCCT-3′; mouse Bcl2l1: 5′-GCCACCTATCTGAATGACCACC-3′ and 5′- AGGAACCAGCGGTTGAAGCGC-3′; human Mcl1: 5′- CCAAGAAAGCTGCATCGAACCAT-3′ and 5′- CAGCACATTCCTGATGCCACCT-3′; mouse Mcl1: 5′-AGCTTCATCGAACCATTAGCAGAA-3′ and 5′- CCTTCTAGGTCCTGTACGTGGA-3′; human Jun: 5′- CCTTGAAAGCTCAGAACTCGGAG-3′ and 5′- TGCTGCGTTAGCATGAGTTGGC-3′; mouse Jun: 5′- CAGTCCAGCAATGGGCACATCA-3′ and 5′- GGAAGCGTGTTCTGGCTATGCA-3′; mouse Cd80: 5′- CCTCAAGTTTCCATGTCCAAGGC-3′ and 5′- GAGGAGAGTTGTAACGGCAAGG-3′; mouse Cd86: 5′- ACGTATTGGAAGGAGATTACAGCT-3′ and 5′- TCTGTCAGCGTTACTATCCCGC-3′; mouse Ifnb1: 5′- GCCTTTGCCATCCAAGAGATGC -3′ and 5′- ACACTGTCTGCTGGTGGAGTTC -3′; mouse Cxcl10: 5′-ATCATCCCTGCGAGCCTATCCT-3′ and 5′- GACCTTTTTTGGCTAAACGCTTTC-3′; mouse Il12b: 5′- TTGAACTGGCGTTGGAAGCACG-3′ and 5′- CCACCTGTGAGTTCTTCAAAGGC-3′; mouse Ifng: 5′-CAGCAACAGCAAGGCGAAAAAGG-3′ and 5′- TTTCCGCTTCCTGAGGCTGGAT-3′; mouse Il6: 5′- TACCACTTCACAAGTCGGAGGC-3′ and 5′- CTGCAAGTGCATCATCGTTGTTC-3′; mouse Il5: 5′-GATGAGGCTTCCTGTCCCTACT-3′ and 5′- TGACAGGTTTTGGAATAGCATTTCC-3′ and the data was normalized to mouse 18S Rna (5′-GCAATTATTCCCCATGAACG-3′ and 5′-GGCCTCACTAAACCATCCAA-3′); and human 18S Rna (5′-CTACCACATCCAAGGAAGCA-3′ and 5′-TTTTTCGTCACTACCTCCCCG-3′).
Mitochondrial membrane potential assay
Mitochondrial membrane potential depolarization was measured using a fluorescent cationic dye, 1,1′3,3′- tetraethylbenzamidazolocarbocyanin iodide (JC-1, #T3168, Thermo Fisher Scientific Inc., Pittsburgh, PA, USA).13,49 JC-1 dye exhibits potential-dependent accumulation in the mitochondria, indicated by a fluorescence emission shift from green (∼529 nm) to red (∼590 nm). Consequently, mitochondrial depolarization is assessed by a decrease in the red/green fluorescence intensity ratio.
Mitochondrial ROS assay
Mitochondrial ROS was measured using a fluorescent dye MitoSOX™ Red reagent (#M36008, Thermo Fisher Scientific Inc., Pittsburgh, PA, USA). It was live-cell permeant and was rapidly and selectively targeted to the mitochondria. Once in the mitochondria, MitoSOX™ Red reagent was oxidized by superoxide and exhibited red fluorescence. It had excitation/emission maxima of approximately 510/580 nm.
Cytoplasmic cytochrome C assay
Cytosol was isolated using a Mitochondria/Cytosol Fractionation Kit (#ab65320, Abcam, Cambridge, MA, USA) according to the manufacturer's instructions. The level of cytochrome c in the cytosol was further assayed using a Cytochrome C ELISA Kit (#ab221832, Abcam) according to the manufacturer's instructions.
CASP3 activity assay
The activity of CASP3 in cell lysates was assayed using the CASP3 Activity Assay Kit (#5723, Cell Signaling Technology, Danvers, MA, USA) according to the manufacturer's protocol. It contained a fluorogenic substrate (N-Acetyl-Asp-Glu-Val-Asp-7-amino-4-methylcoumarin or Ac-DEVDAMC) for caspase-3. During the assay, activated caspase-3 cleaved this substrate between DEVD and AMC, generating highly fluorescent AMC that can be detected using a fluorescence reader with excitation at 380 nm and emission between 420–460 nm.
ELISA assay
Release of ATP (#ab83355, Abcam), TFAM (#ab123455, Abcam; #ABIN429978, antibodies-online), HMGB1 (#326054329, Shino-Test Corporation), and IFNG (#MIF00, R&D Systems) in cell culture medium were assayed using ELISA Kits according to the manufacturer's instructions.
Secrete-pair luminescence assay
Indicated cells were transfected with pEZX-PG04-Bad-promoter-Gaussia luciferase /secreted alkaline phosphatase (GeneCopoeia, #MPRM37247-PG04 and # HPRM45437-PG04). After 48 h, these cells were treated with spautin-1 (10 µM) for 24 hours. The Bad promoter luciferase activity was measured with a secrete-pair dual luminescence assay kit (GeneCopoeia, #SPDA-D010) in accordance with the manufacturer's guidelines.
Animal models
All animal experiments were approved by the Institutional Animal Care and Use Committees and performed in accordance with the Association for Assessment and Accreditation of Laboratory Animal Care guidelines (http://www.aaalac.org).
A total of 3 × 10⁶ CT26 cells, untreated or treated with either oxaliplatin (50 µM) or spautin-1 (10 µM) for 24 h, were inoculated subcutaneously in 200 µl phosphate buffered saline into the lower flank of six-week-old female BALB/c mice (Charles River), whereas 5 × 10⁵ untreated control cells were inoculated into the contralateral flank seven days later.27 The percentage of tumor-free mice was monitored every week.
Statistical analysis
Data are expressed as means ± SD of three independent experiments. Unpaired Student's t tests were used to compare the means of two groups. One-way Analysis of Variance (ANOVA) was used for comparison among the different groups. When ANOVA was significant, post hoc testing of differences between groups was performed using the Least Significant Difference test. The Kaplan-Meier method was used to compare differences in mortality rates between groups. A p-value < 0.05 was considered statistically significant.
Funding Statement
HHS | National Institutes of Health (NIH) (R01GM115366, R01CA160417, and R01CA211070).
Disclosure of potential conflicts of interest
No potential conflicts of interest were disclosed.
Acknowledgments
We thank Christine Heiner (Department of Surgery, University of Pittsburgh) for her critical reading of the manuscript. This work was supported by grants from the US National Institutes of Health (R01GM115366, R01CA160417, and R01CA211070), the Natural Science Foundation of Guangdong Province (2016A030308011), the Natural Science Foundation of Hunan Province (2016JJ3171), the American Cancer Society (Research Scholar Grant RSG-16–014-01-CDD), the National Natural Science Foundation of China (31671435, 81400132, 81772508, and 81570154), Guangdong Province Universities and Colleges Pearl River Scholar Funded Scheme (2017), and Lin He's Academician Workstation of New Medicine and Clinical Translation (2017). This project partly utilized University of Pittsburgh Cancer Institute shared resources supported by award P30CA047904. GK is supported by the Ligue contre le Cancer Comité de Charente-Maritime (équipe labelisée); Agence National de la Recherche (ANR) – Projets blancs; ANR under the frame of E-Rare-2, the ERA-Net for Research on Rare Diseases; Association pour la recherche sur le cancer (ARC); Cancéropôle Ile-de-France; Chancelerie des universités de Paris (Legs Poix), Fondation pour la Recherche Médicale (FRM); the European Commission (ArtForce); the European Research Council (ERC); Fondation Carrefour; Institut National du Cancer (INCa); Inserm (HTE); Institut Universitaire de France; LeDucq Foundation; the LabEx Immuno-Oncology; the RHU Torino Lumière, the Searave Foundation; the SIRIC Stratified Oncology Cell DNA Repair and Tumor Immune Elimination (SOCRATE); the SIRIC Cancer Research and Personalized Medicine (CARPEM); and the Paris Alliance of Cancer Research Institutes (PACRI).
References
- 1.Zitvogel L, Tesniere A, Kroemer G. Cancer despite immunosurveillance: immunoselection and immunosubversion. Nat Rev Immunol. 2006;6:715–27. doi: 10.1038/nri1936. PMID:16977338. [DOI] [PubMed] [Google Scholar]
- 2.Galluzzi L, Buque A, Kepp O, Zitvogel L, Kroemer G. Immunogenic cell death in cancer and infectious disease. Nat Rev Immunol. 2017;17:97–111. doi: 10.1038/nri.2016.107. PMID:27748397. [DOI] [PubMed] [Google Scholar]
- 3.Kroemer G, Galluzzi L, Kepp O, Zitvogel L. Immunogenic cell death in cancer therapy. Annual Rev Immunol. 2013;31:51–72. doi: 10.1146/annurev-immunol-032712-100008. [DOI] [PubMed] [Google Scholar]
- 4.Obeid M, Tesniere A, Ghiringhelli F, Fimia GM, Apetoh L, Perfettini JL, Castedo M, Mignot G, Panaretakis T, Casares N, et al.. Calreticulin exposure dictates the immunogenicity of cancer cell death. Nat Med. 2007;13:54–61. doi: 10.1038/nm1523. PMID:17187072. [DOI] [PubMed] [Google Scholar]
- 5.Apetoh L, Ghiringhelli F, Tesniere A, Obeid M, Ortiz C, Criollo A, Mignot G, Maiuri MC, Ullrich E, Saulnier P, et al.. Toll-like receptor 4-dependent contribution of the immune system to anticancer chemotherapy and radiotherapy. Nat Med. 2007;13:1050–9. doi: 10.1038/nm1622. PMID:17704786. [DOI] [PubMed] [Google Scholar]
- 6.Michaud M, Martins I, Sukkurwala AQ, Adjemian S, Ma Y, Pellegatti P, Shen S, Kepp O, Scoazec M, Mignot G, et al.. Autophagy-dependent anticancer immune responses induced by chemotherapeutic agents in mice. Science. 2011;334:1573–7. doi: 10.1126/science.1208347. PMID:22174255. [DOI] [PubMed] [Google Scholar]
- 7.Liu J, Xia H, Kim M, Xu L, Li Y, Zhang L, Cai Y, Norberg HV, Zhang T, Furuya T, et al.. Beclin1 controls the levels of p53 by regulating the deubiquitination activity of USP10 and USP13. Cell. 2011;147:223–34. doi: 10.1016/j.cell.2011.08.037. PMID:21962518. [DOI] [PMC free article] [PubMed] [Google Scholar]
- 8.Klionsky DJ. Autophagy: from phenomenology to molecular understanding in less than a decade. Nat Rev Mol Cell Biol. 2007;8:931–7. doi: 10.1038/nrm2245. PMID:17712358. [DOI] [PubMed] [Google Scholar]
- 9.Shao S, Li S, Qin Y, Wang X, Yang Y, Bai H, Zhou L, Zhao C, Wang C. Spautin-1, a novel autophagy inhibitor, enhances imatinib-induced apoptosis in chronic myeloid leukemia. Int J Oncol. 2014;44:1661–8. doi: 10.3892/ijo.2014.2313. PMID:24585095. [DOI] [PMC free article] [PubMed] [Google Scholar]
- 10.Horie R, Nakamura O, Yamagami Y, Mori M, Nishimura H, Fukuoka N, Yamamoto T. Apoptosis and antitumor effects induced by the combination of an mTOR inhibitor and an autophagy inhibitor in human osteosarcoma MG63 cells. Int J Oncol. 2016;48:37–44. doi: 10.3892/ijo.2015.3227. PMID:26530936. [DOI] [PMC free article] [PubMed] [Google Scholar]
- 11.Correa RJ, Valdes YR, Peart TM, Fazio EN, Bertrand M, McGee J, Préfontaine M, Sugimoto A, DiMattia GE, Shepherd TG. Combination of AKT inhibition with autophagy blockade effectively reduces ascites-derived ovarian cancer cell viability. Carcinogenesis. 2014;35:1951–61. doi: 10.1093/carcin/bgu049. PMID:24562574. [DOI] [PMC free article] [PubMed] [Google Scholar]
- 12.Sui X, Chen R, Wang Z, Huang Z, Kong N, Zhang M, Han W, Lou F, Yang J, Zhang Q, et al.. Autophagy and chemotherapy resistance: a promising therapeutic target for cancer treatment. Cell Death Dis. 2013;4:e838. doi: 10.1038/cddis.2013.350. PMID:24113172. [DOI] [PMC free article] [PubMed] [Google Scholar]
- 13.Liu L, Yang M, Kang R, Wang Z, Zhao Y, Yu Y, Xie M, Yin X, Livesey KM, Lotze MT, et al.. HMGB1-induced autophagy promotes chemotherapy resistance in leukemia cells. Leukemia. 2011;25:23–31. doi: 10.1038/leu.2010.225. PMID:20927132. [DOI] [PubMed] [Google Scholar]
- 14.Wang J, Wu GS. Role of autophagy in cisplatin resistance in ovarian cancer cells. J Biol Chem. 2014;289:17163–73. doi: 10.1074/jbc.M114.558288. PMID:24794870. [DOI] [PMC free article] [PubMed] [Google Scholar]
- 15.Li J, Hou N, Faried A, Tsutsumi S, Takeuchi T, Kuwano H. Inhibition of autophagy by 3-MA enhances the effect of 5-FU-induced apoptosis in colon cancer cells. Annals Surg Oncol. 2009;16:761–71. doi: 10.1245/s10434-008-0260-0. [DOI] [PubMed] [Google Scholar]
- 16.Tan S, Peng X, Peng W, Zhao Y, Wei Y. Enhancement of oxaliplatin-induced cell apoptosis and tumor suppression by 3-methyladenine in colon cancer. Oncol Letters. 2015;9:2056–62. doi: 10.3892/ol.2015.2996. [DOI] [PMC free article] [PubMed] [Google Scholar]
- 17.Doll S, Proneth B, Tyurina YY, Panzilius E, Kobayashi S, Ingold I, Irmler M, Beckers J, Aichler M, Walch A, et al.. ACSL4 dictates ferroptosis sensitivity by shaping cellular lipid composition. Nat Chem Biol. 2017;13:91–8. doi: 10.1038/nchembio.2239. PMID:27842070. [DOI] [PMC free article] [PubMed] [Google Scholar]
- 18.Yuan H, Li X, Zhang X, Kang R, Tang D. Identification of ACSL4 as a biomarker and contributor of ferroptosis. Biochem Biophys Res Commun. 2016;478:1338–43. doi: 10.1016/j.bbrc.2016.08.124. PMID:27565726. [DOI] [PubMed] [Google Scholar]
- 19.Elmore S. Apoptosis: a review of programmed cell death. Toxicologic Pathol. 2007;35:495–516. doi: 10.1080/01926230701320337. [DOI] [PMC free article] [PubMed] [Google Scholar]
- 20.Kim K, Fisher MJ, Xu SQ, el-Deiry WS. Molecular determinants of response to TRAIL in killing of normal and cancer cells. Clin Cancer Res Official J Am Assoc Cancer Res. 2000;6:335–46. [PubMed] [Google Scholar]
- 21.Smith RA, Hartley RC, Murphy MP. Mitochondria-targeted small molecule therapeutics and probes. Antioxidants Redox Signal. 2011;15:3021–38. doi: 10.1089/ars.2011.3969. [DOI] [PubMed] [Google Scholar]
- 22.Czabotar PE, Lessene G, Strasser A, Adams JM. Control of apoptosis by the BCL-2 protein family: implications for physiology and therapy. Nat Rev Mol Cell Biol. 2014;15:49–63. doi: 10.1038/nrm3722. PMID:24355989. [DOI] [PubMed] [Google Scholar]
- 23.Wada T, Penninger JM. Mitogen-activated protein kinases in apoptosis regulation. Oncogene. 2004;23:2838–49. doi: 10.1038/sj.onc.1207556. PMID:15077147. [DOI] [PubMed] [Google Scholar]
- 24.Davis RJ. Signal transduction by the JNK group of MAP kinases. Cell. 2000;103:239–52. doi: 10.1016/S0092-8674(00)00116-1. PMID:11057897. [DOI] [PubMed] [Google Scholar]
- 25.Xie Y, Zhu S, Zhong M, Yang M, Sun X, Liu J, Kroemer G, Lotze M, Zeh HJ 3rd, Kang R, et al.. Inhibition of Aurora kinase a induces Necroptosis in pancreatic carcinoma. Gastroenterology. 2017;153:1429–43 e5. doi: 10.1053/j.gastro.2017.07.036. [DOI] [PMC free article] [PubMed] [Google Scholar]
- 26.Yang H, Ma Y, Chen G, Zhou H, Yamazaki T, Klein C, Pietrocola F, Vacchelli E, Souquere S, Sauvat A, et al.. Contribution of RIP3 and MLKL to immunogenic cell death signaling in cancer chemotherapy. Oncoimmunol. 2016;5:e1149673. doi: 10.1080/2162402X.2016.1149673. [DOI] [PMC free article] [PubMed] [Google Scholar]
- 27.Tesniere A, Schlemmer F, Boige V, Kepp O, Martins I, Ghiringhelli F, Aymeric L, Michaud M, Apetoh L, Barault L, et al.. Immunogenic death of colon cancer cells treated with oxaliplatin. Oncogene. 2010;29:482–91. doi: 10.1038/onc.2009.356. PMID:19881547. [DOI] [PubMed] [Google Scholar]
- 28.Julian MW, Shao G, Bao S, Knoell DL, Papenfuss TL, VanGundy ZC, Crouser ED. Mitochondrial transcription factor A serves as a danger signal by augmenting plasmacytoid dendritic cell responses to DNA. J Immunol. 2012;189:433–43. doi: 10.4049/jimmunol.1101375. PMID:22675199. [DOI] [PMC free article] [PubMed] [Google Scholar]
- 29.Xie Y, Kang R, Sun X, Zhong M, Huang J, Klionsky DJ, Tang D. Posttranslational modification of autophagy-related proteins in macroautophagy. Autophagy 2015; 11:28–45. doi: 10.4161/15548627.2014.984267. PMID:25484070. [DOI] [PMC free article] [PubMed] [Google Scholar]
- 30.Levy JMM, Towers CG, Thorburn A. Targeting autophagy in cancer. Nat Rev Cancer. 2017;17:528–42. doi: 10.1038/nrc.2017.53. PMID:28751651. [DOI] [PMC free article] [PubMed] [Google Scholar]
- 31.Yang E, Zha J, Jockel J, Boise LH, Thompson CB, Korsmeyer SJ. Bad, a heterodimeric partner for Bcl-XL and Bcl-2, displaces Bax and promotes cell death. Cell. 1995;80:285–91. doi: 10.1016/0092-8674(95)90411-5. PMID:7834748. [DOI] [PubMed] [Google Scholar]
- 32.Zha J, Harada H, Yang E, Jockel J, Korsmeyer SJ. Serine phosphorylation of death agonist BAD in response to survival factor results in binding to 14–3-3 not BCL-X(L). Cell. 1996;87:619–28. doi: 10.1016/S0092-8674(00)81382-3. PMID:8929531. [DOI] [PubMed] [Google Scholar]
- 33.Dhanasekaran DN, Reddy EP. JNK signaling in apoptosis. Oncogene. 2008;27:6245–51. doi: 10.1038/onc.2008.301. PMID:18931691. [DOI] [PMC free article] [PubMed] [Google Scholar]
- 34.Donovan N, Becker EB, Konishi Y, Bonni A. JNK phosphorylation and activation of BAD couples the stress-activated signaling pathway to the cell death machinery. J Biol Chem. 2002;277:40944–9. doi: 10.1074/jbc.M206113200. PMID:12189144. [DOI] [PubMed] [Google Scholar]
- 35.Yu C, Minemoto Y, Zhang J, Liu J, Tang F, Bui TN, Xiang J, Lin A. JNK suppresses apoptosis via phosphorylation of the proapoptotic Bcl-2 family protein BAD. Mol Cell. 2004;13:329–40. doi: 10.1016/S1097-2765(04)00028-0. PMID:14967141. [DOI] [PubMed] [Google Scholar]
- 36.Kang D, Kim SH, Hamasaki N. Mitochondrial transcription factor A (TFAM): roles in maintenance of mtDNA and cellular functions. Mitochondrion. 2007;7:39–44. doi: 10.1016/j.mito.2006.11.017. PMID:17280879. [DOI] [PubMed] [Google Scholar]
- 37.Kang R, Chen R, Zhang Q, Hou W, Wu S, Cao L, Huang J, Yu Y, Fan XG, Yan Z, et al.. HMGB1 in health and disease. Mol Aspects Med. 2014;40:1–116. doi: 10.1016/j.mam.2014.05.001. PMID:25010388. [DOI] [PMC free article] [PubMed] [Google Scholar]
- 38.Kazama H, Ricci JE, Herndon JM, Hoppe G, Green DR, Ferguson TA. Induction of immunological tolerance by apoptotic cells requires caspase-dependent oxidation of high-mobility group box-1 protein. Immunity. 2008;29:21–32. doi: 10.1016/j.immuni.2008.05.013. PMID:18631454. [DOI] [PMC free article] [PubMed] [Google Scholar]
- 39.Chen GY, Tang J, Zheng P, Liu Y. CD24 and Siglec-10 selectively repress tissue damage-induced immune responses. Science. 2009;323:1722–5. doi: 10.1126/science.1168988. PMID:19264983. [DOI] [PMC free article] [PubMed] [Google Scholar]
- 40.Chiba S, Baghdadi M, Akiba H, Yoshiyama H, Kinoshita I, Dosaka-Akita H, Fujioka Y, Ohba Y, Gorman JV, Colgan JD, et al.. Tumor-infiltrating DCs suppress nucleic acid-mediated innate immune responses through interactions between the receptor TIM-3 and the alarmin HMGB1. Nat Immunol. 2012;13:832–42. doi: 10.1038/ni.2376. PMID:22842346. [DOI] [PMC free article] [PubMed] [Google Scholar]
- 41.Yao X, Carlson D, Sun Y, Ma L, Wolf SE, Minei JP, Zang QS. Mitochondrial ROS induces cardiac inflammation via a pathway through mtDNA damage in a pneumonia-related sepsis model. PloS One. 2015;10:e0139416. doi: 10.1371/journal.pone.0139416. PMID:26448624. [DOI] [PMC free article] [PubMed] [Google Scholar]
- 42.Little JP, Simtchouk S, Schindler SM, Villanueva EB, Gill NE, Walker DG, Wolthers KR, Klegeris A. Mitochondrial transcription factor A (Tfam) is a pro-inflammatory extracellular signaling molecule recognized by brain microglia. Mol Cell Neurosci. 2014;60:88–96. doi: 10.1016/j.mcn.2014.04.003. PMID:24769106. [DOI] [PubMed] [Google Scholar]
- 43.Weinberg SE, Sena LA, Chandel NS. Mitochondria in the regulation of innate and adaptive immunity. Immunity. 2015;42:406–17. doi: 10.1016/j.immuni.2015.02.002. PMID:25786173. [DOI] [PMC free article] [PubMed] [Google Scholar]
- 44.Galluzzi L, Kepp O, Kroemer G. Mitochondria: master regulators of danger signalling. Nat Rev Mol Cell Biol. 2012;13:780–8. doi: 10.1038/nrm3479. PMID:23175281. [DOI] [PubMed] [Google Scholar]
- 45.Xie M, Yu Y, Kang R, Zhu S, Yang L, Zeng L, Sun X, Yang M, Billiar TR, Wang H, et al.. PKM2-dependent glycolysis promotes NLRP3 and AIM2 inflammasome activation. Nat Commun. 2016;7:13280. doi: 10.1038/ncomms13280. PMID:27779186. [DOI] [PMC free article] [PubMed] [Google Scholar]
- 46.Yang M, Liu L, Xie M, Sun X, Yu Y, Kang R, Yang L, Zhu S, Cao L, Tang D. Poly-ADP-ribosylation of HMGB1 regulates TNFSF10/TRAIL resistance through autophagy. Autophagy. 2015;11:214–24. doi: 10.4161/15548627.2014.994400. PMID:25607248. [DOI] [PMC free article] [PubMed] [Google Scholar]
- 47.Yang L, Xie M, Yang M, Yu Y, Zhu S, Hou W, Kang R, Lotze MT, Billiar TR, Wang H, et al.. PKM2 regulates the Warburg effect and promotes HMGB1 release in sepsis. Nat Commun. 2014;5:4436. PMID:25019241. [DOI] [PMC free article] [PubMed] [Google Scholar]
- 48.Tang D, Kang R, Livesey KM, Cheh CW, Farkas A, Loughran P, Hoppe G, Bianchi ME, Tracey KJ, Zeh HJ 3rd, et al.. Endogenous HMGB1 regulates autophagy. J Cell Biol. 2010;190:881–92. doi: 10.1083/jcb.200911078. PMID:20819940. [DOI] [PMC free article] [PubMed] [Google Scholar]
- 49.Wang Z, Cao L, Kang R, Yang M, Liu L, Zhao Y, Yu Y, Xie M, Yin X, Livesey KM, et al.. Autophagy regulates myeloid cell differentiation by p62/SQSTM1-mediated degradation of PML-RARalpha oncoprotein. Autophagy. 2011;7:401–11. doi: 10.4161/auto.7.4.14397. PMID:21187718. [DOI] [PMC free article] [PubMed] [Google Scholar]