

Abstract
Objective
To examine the patterns of insurance coverage among nine Latino subgroups and assess heterogeneous effects of the Affordable Care Act (ACA) among these groups.
Data Sources
American Community Survey (2010–2014).
Study Design
We examined pre‐ACA disparities in coverage using linear probability models. Then, we used interrupted time series and triple‐difference models to evaluate coverage changes associated with the ACA and Medicaid expansion, respectively.
Principal Findings
Pre‐ACA coverage disparities between Latino subgroups were nearly 30 percentage points—larger than the gap between whites and Latinos as a whole. Coverage changes associated with the ACA and Medicaid expansion differed significantly between subgroups, with the largest gains among South Americans, Central Americans, and Mexicans.
Conclusions
Latino subgroups show marked heterogeneity in baseline coverage rates and responses to the ACA.
Keywords: Insurance, racial/ethnic disparities, health reform
Hispanics and Latinos make up the largest minority group in the nation, totaling 17.6 percent of the population, and they have the highest uninsured rates of any major racial or ethnic group (Smith and Medalia 2015). It is a diverse population with markedly different economic, political, and migration histories, as well as different barriers to health insurance. Groups falling under the pan‐ethnic labels of “Hispanic” or “Latino” differ dramatically in income, education, language proficiency, and other characteristics. Understanding how these differences affect overall rates of insurance coverage—and how the Affordable Care Act (ACA) has impacted these differences—is necessary for crafting appropriate policies and narrowing long‐standing disparities in the United States.
It is well established that Latinos and Hispanics have worse access to health care than whites across a host of measures. Utilization of preventive care is lower among Mexicans and Central/South Americans than other Latino groups (Vargas Bustamante et al. 2010), whereas mental health utilization is higher among Puerto Ricans (Keyes et al. 2012). Access to care and perceived quality of care among Latinos also vary based on documentation status (Rodriguez, Vargas Bustamante, and Ang 2009). Self‐reported health is higher among Mexicans compared to Puerto Ricans, although the magnitude of the effects differs based on acculturation and socioeconomic status (Zsembik and Fennell 2005).
Insurance coverage is another important example of disparities and variation in health care access among Hispanics and Latinos (Smedly, Stith, and Nelson 2002; Ortega, Rodriguez, and Vargas 2015). One study found lower coverage rates among Mexicans than non‐Mexican Latinos (Vargas Bustamante et al. 2009). Another study found California's 2012 Medicaid expansion increased insurance coverage for both groups, although it lacked the statistical power to test whether the groups experienced differential changes in coverage (Sommers et al. 2015).
Nationally, insurance coverage rates have increased substantially since the implementation of the ACA in 2014 (Collins et al. 2015; Shartzer et al. 2015; Smith and Medalia 2015). Non‐elderly Latinos saw an additional 4 percentage‐point drop in the uninsured rate compared to whites. However, this represented only an 18 percent relative reduction in the baseline Latino uninsured rate, compared to a 28 percent reduction among whites (Sommers et al. 2014). Meanwhile, awareness of the ACA remains low among Latinos (Garcia Mosqueira, Hua, and Sommers 2015), and despite the ACA, overall health care utilization rates are projected to remain below‐average among recent immigrants compared to other groups (Vargas Bustamante and Chen 2014). Most recently, Alcala et al. (2017) published an analysis of insurance coverage and access to care among five Latino ethnicities using the National Health Interview Survey (NHIS). They found that Mexicans and Central Americans were less likely to be insured than non‐Latino whites, whereas Cubans and Central Americans were more likely to have forgone care. However, their ability to distinguish measurable differences between these groups was limited by the NHIS's sample size (the smallest group in the study had fewer than 900 observations).
Our study builds on this evidence base and considers several extensions. First, we take advantage of a much larger dataset that those used in the studies above, enabling a more refined categorization of eight Latino and Hispanic subgroups, all of which contain at least 20,000 observations in our sample. Second, we not only document differences in coverage at baseline and after the ACA, but also use a sequential regression model to detect which factors explain baseline disparities in coverage between these groups. Third, we estimate the specific coverage effects of the ACA's Medicaid expansion among low‐income adults in each subgroup. Given the variable geographic distribution of Latino ethnicities across states and interest in increasing enrollment through the ACA, documenting disparities in coverage among ethnicities may yield important insights for policy makers and insurers.
Methods
Data
We used the US Census Bureau's American Community Survey (ACS) public microdata for 2010–2014. The survey includes information about economic, demographic, and health insurance characteristics. The public use file contains over 3.5 million respondents each year and a response rate of over 97 percent.
Analysis
Ethnic Classifications
The ACS contains detailed information about national, ethnic, and ancestral origin, from which we created eight subgroups among those who answered “yes” to the question, “Is this person of Hispanic, Latino, or Spanish origin?” While there is reason to think that those of Spanish origin are a distinct group from other Hispanic and Latinos, the Census Bureau definition and question wording means that health services researchers using these datasets are frequently combining all three groups into a single category (which may be variably labeled as “Hispanic,” “Latino,” or “Latino/Hispanic” in most prior research).1 In our results, we generally refer to this aggregate group as “Latino/Hispanic.”
Within this aggregate ethnic grouping, we defined the following eight subgroups. We considered Puerto Ricans and Cubans as their own groups reflecting their unique legal status: Puerto Ricans are U.S. citizens by birth and most Cuban immigrants have a viable path to residency or citizenship through the Cuban Adjustment Act. We then created groups for those who described their ethnicity based on nationality: Mexicans, Dominicans, and Spanish. For those from nations with fewer observations, we aggregated them into two categories: Central American and South American. Finally, we use the Census Bureau's classification of “All other Hispanics and Latinos” for the remaining less common ancestral origins. Although we do not advocate sweeping pan‐ethnic aggregations, to facilitate comparison with previous literature, we classified individuals who did not report Hispanic or Latino ethnicity into white, black, and all others. Our final sample contained non‐elderly adults ages 19–64 years in any of the eight Latino/Hispanic groups, as well as non‐Latino whites, blacks, and Others (N = 9,284,631).
Pre‐ACA Coverage Disparities
To assess patterns of insurance coverage among our groups before the full implementation of the ACA (2010–2013), we used linear probability models to examine baseline variation in coverage and the sources of disparity among our minority groups. In keeping with the literature on racial/ethnic disparities, we began by presenting unadjusted estimates of disparity in uninsured rates for each minority group using whites as the reference group (Granados et al. 2001; Vargas Bustamante et al. 2009; Cook, McGuire, and Zaslavsky 2012). We then added an increasing number of covariates and calculated the change in adjusted estimates as a percentage of the unadjusted estimates for each minority group. We interpreted these results as the amount of baseline disparity that can be explained by covariates other than race/ethnicity. The covariates we examined were citizenship and presence of a non‐citizen in the household, English proficiency, sex, age, education, employment, income, and state of residence. See Appendix SA2 for full regression equations.
Changes in Health Insurance in 2014
Next, we used an interrupted time‐series model to evaluate changes in coverage concurrent with ACA implementation in 2014:
| (1) |
Group i is a vector of indicator variables for each racial/ethnic group, Year t is a linear time trend, Post t is an indicator for Year t = 2014, X is is a vector of covariates as listed above, with the addition of state‐year unemployment. β 3 captures the change coinciding with the ACA's 2014 coverage expansions for the reference group (whites), whereas β 4 is a vector of coefficients providing estimates of the additional changes in coverage for each group in 2014, compared to whites.
Medicaid Expansion
We used a differences‐in‐differences‐in‐differences model to compare changes for Medicaid expansion versus nonexpansion states within each race/ethnicity. For this analysis, we restricted our sample to non‐elderly adults with incomes at or below 138 percent of the Federal Poverty Level (FPL), (N = 2,398,784).2 We estimate:
| (2) |
The variable expState s indicates living in a state that had expanded its Medicaid program by 2014, and all other variables are defined as in equation (1). β 5 provides the estimated impact of Medicaid expansion for the reference group (whites), whereas β 6 estimates the additional impact of Medicaid expansion for minority groups compared to whites. This model used robust standard errors clustered by state.
All analyses were conducted using STATA 14.1 (StataCorp LLC, 4905 Lakeway Drive, College Station, Texas 77845‐4512 USA) and used ACS survey weights.
Results
Demographic Differences
Table S1 presents the descriptive statistics by race/ethnicity. Mexicans make up the largest portion (62.5 percent) of the Latino/Hispanic population, followed by Central Americans (9.9 percent) and Puerto Ricans (9.4 percent). Spanish individuals have the highest per‐capita income and educational attainment. Citizenship rates were highest among Puerto Ricans (99.3 percent), in contrast to much lower rates among Dominicans (57.5 percent) and Cubans (75.2 percent). English proficiency was highest among Spanish (93.2 percent) and lowest among Central Americans (43.5 percent).
Coverage Trends
Figure 1 illustrates the percentage of uninsured adults in each Latino/Hispanic ethnic group from 2010 to 2014, as well as comparable figures for whites, blacks, and the pan‐ethnic “Latino/Hispanic” group. There is a greater absolute difference in coverage across Latino/Hispanic ethnicities (e.g., a 26 percentage‐point difference between the Spanish and Central Americans) than between whites and blacks (8 percentage points), or whites and all Latinos/Hispanics (18 percentage points). All groups experienced large decreases in uninsured rates in 2014.
Figure 1.
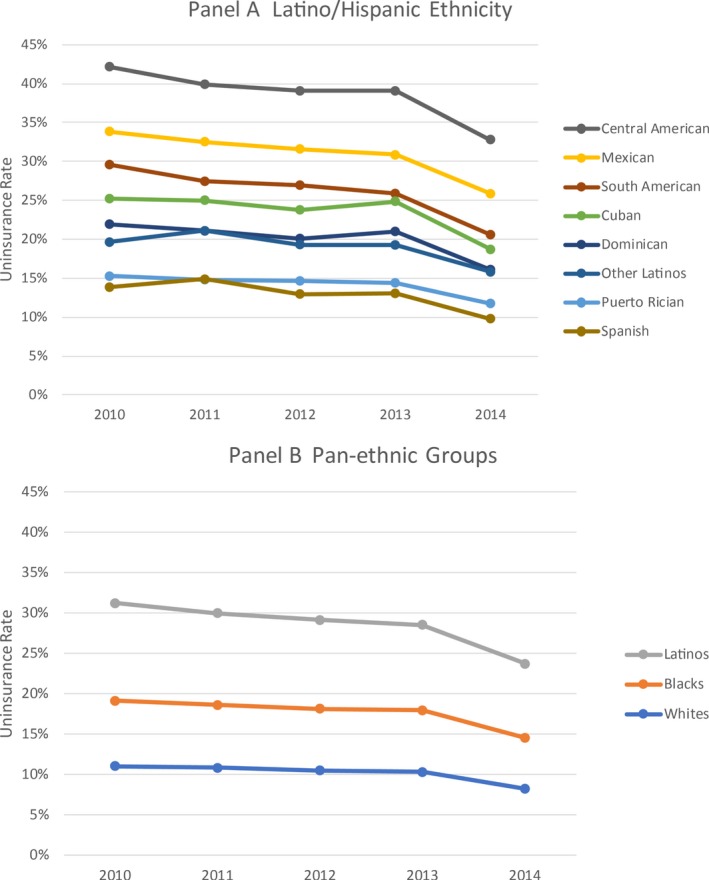
Uninsured Rates by Race/Ethnicity, 2010–2014 [Color figure can be viewed at http://wileyonlinelibrary.com]
Pre‐ACA Disparities in Health Insurance
Table S2 presents the unadjusted racial/ethnic gaps in pre‐ACA health insurance rates and how these gaps are differentially explained by our control variables. Table S3 summarizes the percent of the disparity that can be explained by each added sets of covariates. Pre‐ACA coverage disparities compared to whites were largest for Central Americans (+37.9 percentage points) and Mexicans (+30.6 percentage points). Citizenship accounted for 26 percent of the coverage gap relative to whites observed among Mexicans and 50 percent for Dominicans, but essentially zero for Puerto Ricans. Individual sociodemographics had the largest marginal impact for most groups. English proficiency explained an additional 31 percent of the white‐Dominican coverage gap and 12 percent for Mexicans and Central Americans.
Coverage Changes Associated with the ACA's 2014 Expansions
Table 1 presents the changes in insurance coverage associated with implementation of the ACA 2014 by race/ethnicity, as well as marginal effects for minorities compared to whites. Adjusted coverage gains were largest among Cubans, Central Americans, Mexicans, and South Americans, with the drop in the uninsured rate ranging from 6.6 to 8.3 percentage points, significantly larger than the 3.7 percentage‐point change among whites. Coverage gains were significantly larger for most minority groups compared to whites, other than Spanish and Puerto Rican adults, whose 2014 changes resembled whites.
Table 1.
Changes in the Percentage of Uninsured Adults (Ages 19–64 years) in 2014, by Racial/Ethnic Group†
| 2014 Change | 2014 Change Relative to Whites | |
|---|---|---|
| White (ref.) | −0.0373*** (0.0006) | N/A |
| Black | −0.0541*** (0.0013) | −0.0168*** (0.0014) |
| Mexican | −0.0692*** (0.0016) | −0.0318*** (0.0016) |
| Central American | −0.0663*** (0.0040) | −0.0290*** (0.0040) |
| Puerto Rican | −0.0396*** (0.0036) | −0.0023 (0.0036) |
| Dominican | −0.0488*** (0.0067) | −0.0114* (0.0067) |
| Cuban | −0.0827*** (0.0059) | −0.0454*** (0.0059) |
| South American | −0.0735*** (0.0045) | −0.0362*** (0.0045) |
| Other Latino/Hispanic | −0.0580*** (0.0065) | −0.0187*** (0.0064) |
| Spanish | −0.0501*** (0.0082) | −0.0128 (0.0083) |
| N | 9,209,815 | |
| R 2 | 0.181 | |
Standard errors in parentheses.
*p < .1, ** p < .05, ***p < .01.
†Adjusted for citizenship, presence of a non‐citizen in the household, English proficiency, age, sex, marital status, income, employment, education, state fixed effects, and state‐year unemployment.
Heterogeneous Effects of Medicaid Expansion
Table 2 shows the estimated effects of being in an expansion (vs. nonexpansion) state during 2014 for non‐elderly adults at or below 138 percent of FPL. whites experienced a 4.3 percentage‐point reduction in the uninsured rate due to Medicaid expansion. Blacks, Mexicans, and Other Latinos/Hispanics saw decreases ranging from 5.0 to 5.9 percentage points, Dominicans experienced a 3.0 percentage‐point reduction, and Spanish adults experienced an 8.4 percentage‐point reduction. Meanwhile, low‐income Central Americans, Puerto Ricans, Cubans, and South Americans did not experience statistically significant changes. A joint significance test of the estimates for the Latino or Hispanic ethnicities demonstrates significant heterogeneity of the policy impact between subgroups (p < .0001).
Table 2.
Effects of Medicaid Expansion on the Percent Uninsured among Adults (Ages 19–64 Years) with Incomes below 138 Percent of FPL, by Racial/Ethnic Group†
| Medicaid Expansion Effect on Percent Uninsured | Medicaid Expansion Effect, Relative to Whites | |
|---|---|---|
| White (ref.) | −0.0427*** (0.0108) | N/A |
| Black | −0.0562*** (0.0091) | −0.0135** (0.0067) |
| Mexican | −0.0595*** (0.0119) | −0.0168 (0.0123) |
| Central American | −0.0272 (0.0329) | 0.0156 (0.0323) |
| Puerto Rican | −0.0182 (0.0137) | 0.0245** (0.0116) |
| Dominican | −0.0296* (0.0159) | 0.0131 (0.0174) |
| Cuban | −0.0095 (0.0334) | 0.0333 (0.0357) |
| South American | −0.0087 (0.0177) | 0.0340** (0.0160) |
| Other Latino/Hispanic | −0.0504*** (0.0130) | −0.0077 (0.0145) |
| Spanish | −0.0839*** (0.0255) | −0.0411 (0.0262) |
| N | 2,398,784 | |
| R 2 | 0.135 | |
Standard errors in parentheses, clustered at the state level.
*p < .10, ** p < .05, *** p < .01.
†Adjusted for citizenship, presence of a non‐citizen in the household, English proficiency, age, sex, marital status, income, employment, education, state fixed effects, and state‐year unemployment.
Discussion
We found notable differences in health insurance coverage among Latino and Hispanic subgroups both before and after implementation of the ACA in national survey data from 2010 to 2014. Baseline uninsured rates exhibit even wider disparities between our ethnic groupings than do simple black‐white or Latino/Hispanic‐white comparisons. Citizenship is a key mediating factor in coverage disparities for some groups, while differences in socioeconomic status play a large role in disparities for all Hispanic or Latino ethnicities when compared to whites.
These results are consistent with findings that the ACA has increased coverage by three additional percentage points among all Latinos compared to whites (Chen et al. 2016). However, we find that the magnitude of these changes differed considerably across our subgroups, consistent with the findings of Alcala and colleagues’ recent analysis of the NHIS. Our study builds on those results and provides more detail about both the heterogeneity of coverage gains and the factors contributing to these intra‐ethnic coverage disparities by leveraging the large sample size of the ACS.
Unlike Alcala et al., we were also able to provide estimates specific to the Medicaid expansion. We find that the Medicaid expansion produced overall reductions in the uninsured rate of 5.5 percentage points for low‐income whites and 3.5–8.5 percentage points for most other groups—similar to recent research aggregating across these groups (Kaestner et al. 2015), although again we found significant heterogeneity across Latino/Hispanic subgroups. These findings are especially relevant to several states that have rejected Medicaid expansion thus far, such as Texas and Florida, which have a high proportion of the nation's Mexican and Cuban populations, respectively.
Our findings have important implications for both researchers and policy makers. In terms of research implications, our key central finding is that the pan‐ethnic label “Hispanic or Latino” obscures marked differences in coverage that exceed the differences between groups that are traditionally used in policy research, such as whites and blacks, or Latinos/Hispanics and whites. To the extent that disparities in coverage are worthy of attention (and we think they are), then differences between Latino/Hispanic ethnicities should be examined in policy evaluations whenever feasible. Of course, the use of eight subgroups will not be practical in many research contexts given that the ACS is the only commonly used data source that offers a large enough sample size and detailed ethnicity information to allow for such a granular analysis.
Nonetheless, in some circumstances, more refined assessments of race and ethnicity are almost certainly feasible. Mexicans are a large enough group to justify separate analysis in most cases, something that has already been used in practice (Vargas Bustamante et al. 2009; Sommers et al. 2015). Our findings suggest that there exist other aggregations of Latino/Hispanic ethnicities that could provide useful results, without going to the level of detail in this study. For instance, there were similarities among Puerto Ricans, Spanish, and Other Latinos/Hispanics in terms of lower baseline uninsured rates, high citizenship rates, and more modest responses to the ACA, suggesting that these may be a reasonable set of groups to combine for measurement purposes. Meanwhile, Central and South Americans shared several features on average: lower citizenship rates, high pre‐ACA uninsured populations, and large coverage gains in 2014. Finally, both Dominicans and Cubans were generally in the middle of the distribution of citizenship and uninsured rates, suggesting another potential grouping. Heuristic groupings like these (Table S4) may present an appropriate balance between detailed refined groupings and statistical power.
An additional implication of these findings for researchers is that unpacking the “other race” category used in many analyses is likely to yield similar insights into wide yet often invisible disparities in the experiences of groups such as Asians, Pacific Islanders, and Native Americans. Future research on this topic is needed.
Our findings also have relevance to several current challenges being faced by state and federal policy makers. First, our findings highlight the intersection between health policy and immigration policy. The variation we observed between ethnicities coincided tightly with the proportion of citizens in each group. Groups with high citizenship rates (Puerto Ricans, Spanish, and Other Latinos) had higher pre‐ACA coverage rates and were less likely to experience large coverage increases in 2014 compared to whites. Although the ACA does not subsidize coverage for undocumented immigrants, many non‐citizens—particularly those with permanent residency status—are eligible for subsidized coverage (Parmet 2013). It appears that the law provided significant beneficial impact for these groups, likely in part because they had below‐average incomes and higher baseline uninsured rates. These increases in coverage among non‐citizens may also alleviate additional barriers to health care access for children in mixed‐status families, a common challenge among Mexicans and Central American immigrant communities. However, our findings indicate that coverage gaps that remain after implementation of the ACA fall disproportionately on non‐citizens, especially those from Mexico and Central America. Significantly narrowing these disparities likely will require comprehensive immigration reform, which appears unlikely in the current political climate (Sommers 2013).
Second, our findings can offer insights for policy makers who are seeking to boost enrollment in the ACA's insurance marketplaces. Insurers may stand to gain from higher rates of uptake by several groups in our analysis who are younger on average and likely less costly to cover—namely, Mexicans, Central Americans, and Other Latinos. Moreover, immigrants from these nations tend to be healthier than their non‐immigrant counterparts (Centers for Disease Control, 2015), which may provide additional motivation for targeted outreach to these groups. Of course, narrowing coverage disparities—even without reference to the risk pool—is a worthwhile policy goal as well, and analyses like ours can be used to support more culturally competent targeting efforts to these groups.
Our study has important limitations. Our time‐series model is subject to numerous potential confounders and only offers suggestive evidence on the ACA's impact. However, recent studies argue that nearly all of the coverage increase in 2014 is attributable to the ACA (Blumberg, Garrett, and Holahan 2016). Our Medicaid expansion analysis, while using a quasi‐experimental approach, likely was underpowered to detect significant changes for smaller groupings, which in part may explain why many researchers prefer using larger pan‐ethnic groupings. Finally, in using individuals’ self‐reported primary ancestral origin to create our groups, we ignored the complexity of mixed ethnicities.
Despite these limitations, our results demonstrate substantial heterogeneity in insurance coverage rates among Latinos and Hispanics, both before the ACA and afterwards. As researchers and policy makers continue to evaluate the ACA and other large‐scale public policies, including the possible repeal of the ACA, our results argue for the consideration of more refined ethnic groups when feasible to better understand the full impact of such policies on the increasingly diverse U.S. population.
Supporting information
Appendix SA1: Author Matrix.
Appendix SA2: Methods.
Table S1. Descriptive Statistics for the Sample (N = 9,284,631).
Table S2. Pre‐ACA Disparity in Uninsured Rates by Race/Ethnicity, Compared to Whites.
Table S3. Percent of Baseline Disparity in Uninsured Rates (vs. Whites) Accounted for by Multivariate Controls.
Table S4. Results Summary by Ethnicity and Proposed Larger Groupings.
Acknowledgments
Joint Acknowledgment/Disclosure Statement: Funding for the time, software licenses, and material resources used to complete this project was provided by the Harvard University Graduate School of Arts and Science and T.H. Chan School of Public Health.
Disclosures: None.
Disclaimer: None.
Notes
In most of the studies discussed in the literature review above, we see no evidence that researchers are attempting to separate out people of Spanish origin from “Latino/Hispanic,” even if one could argue they would be more accurately treated as a subset of European Americans.
Income was defined based on the notion of the health insurance unit—that is, an adult, his/her spouse, and any dependent children.
References
- Alcala, H. E. , Chen J., Langellier B. A., Rody D. H., and Ortega A. N.. 2017. “Impact of Affordable Care Act on Health Care Access and Utilization among Latinos.” Journal of the American Board of Family Medicine 30 (1): 53–62. [DOI] [PubMed] [Google Scholar]
- Blumberg, L. J. , Garrett B., and Holahan J.. 2016. “Estimating the Counterfactual: How Many Uninsured Adults Would There Be Today without the ACA?” Journal of Health Care Organization, Provision, and Financing 53: 1–13. [DOI] [PMC free article] [PubMed] [Google Scholar]
- Centers for Disease Control and Prevention . 2015. “Vital Signs: Leading Causes of Death, Prevalence of Diseases and Risk Factors, and the Use of Health Services among Hispanics in the United States—2009–2013.” Morbidity and Mortality Weekly Report 64 (17): 469–78. [PMC free article] [PubMed] [Google Scholar]
- Chen, J. , Vargas Bustamante A., Mortensen K., and Ortega A. N.. 2016. “Racial and Ethnic Disparities in Health Care Access and Utilization under the Affordable Care Act.” Medical Care 54 (2): 140–6. [DOI] [PMC free article] [PubMed] [Google Scholar]
- Collins, S. R. , Rasmussen P. W., Doty M. M., and Beutel S.. 2015. The Rise in Health Care Coverage and Affordability Since Health Reform Took Effect. New York: The Commonwealth Fund. [PubMed] [Google Scholar]
- Cook, B. L. , McGuire T. G., and Zaslavsky A. M.. 2012. “Measuring Racial/Ethnic Disparities in Health Care: Methods and Practical Issues.” Health Services Research 47 (3): 1232–54. [DOI] [PMC free article] [PubMed] [Google Scholar]
- Garcia Mosqueira, A. , Hua L. M., and Sommers B. D.. 2015. “Racial Differences in Awareness of the Affordable Care Act and Application Assistance among Low‐Income Adults in Three Southern States.” Inquiry 52: 1–4. [DOI] [PMC free article] [PubMed] [Google Scholar]
- Granados, G. , Puvvula J., Berman N., and Dowling P.. 2001. “Health Care for Latino Children: Impacts of Child and Parental Birthplace on Insurance Status and Access to Health Services.” American Journal of Public Health 9 (11): 1806–7. [DOI] [PMC free article] [PubMed] [Google Scholar]
- Kaestner, R. , Garrett B., Gangopadhyaya A., and Fleming C.. 2015. Effects of ACA Medicaid Expansion on Health Insurance Coverage and Labor Supply. NBER Working Paper No 21836. [DOI] [PubMed]
- Keyes, K. M. , Martins S. S., Hatzenbuehler M. L., Blanco C., Bates L. M., and Hasin D. S.. 2012. “Mental Health Service Utilization for Psychiatric Disorders among Latinos Living in the United States: The Role of Ethnic Subgroup, Ethnic Identity, and Language/Social Preferences.” Social Psychiatry and Psychiatric Epidemiology 47 (3): 383–94. [DOI] [PMC free article] [PubMed] [Google Scholar]
- Ortega, A. N. , Rodriguez H. P., and Vargas B. A.. 2015. “Policy Dilemmas in Latino Health Care and Implementation of the Affordable Care Act.” Annual Review of Public Health 36: 525–44. [DOI] [PMC free article] [PubMed] [Google Scholar]
- Parmet, W. E. 2013. “Holes in the Safety Net—Legal Immigrants’ Access to Health Insurance.” New England Journal of Medicine 369: 596–98. [DOI] [PubMed] [Google Scholar]
- Rodriguez, M. A. , Vargas Bustamante A., and Ang A.. 2009. “Perceived Quality of Care, Receipt of Preventive Care, and Usual Source of Health Care among Undocumented and Other Latinos.” Journal of General Internal Medicine 24 (Suppl 3): 508–13. [DOI] [PMC free article] [PubMed] [Google Scholar]
- Shartzer, A. , Long S. K., Karpman M., Kenney G. M., and Zuckerman S.. 2015. QuickTake: Insurance Coverage Gains Cross Economic, Social, and Geographic Boundaries. Washington, DC: Urban Institute. [Google Scholar]
- Smedly, B. D. , Stith A. Y., and Nelson A.. 2002. Unequal Treatment: Confronting Racial and Ethnic Disparities in Health Care. Washington, DC: Institute of Medicine. [Google Scholar]
- Smith, J. C. , and Medalia C.. 2015. Health Insurance Coverage in the United States: 2014. Washington, DC: U.S. Census Bureau. [Google Scholar]
- Sommers, B. D. 2013. “Stuck Between Health and Immigration Reform—Care for Undocumented Immigrants.” New England Journal of Medicine 369: 593–5. [DOI] [PubMed] [Google Scholar]
- Sommers, B. D. , Musco T., Finegold K., Gunja M. Z., Burke A., and McDowell A. M.. 2014. “Health Reform and Changes in Health Insurance Coverage in 2014.” New England Journal of Medicine 371: 867–74. [DOI] [PubMed] [Google Scholar]
- Sommers, B. D. , Chua K. P., Kenney G. M., Long S. K., and McMorrow S.. 2015. “California's Early Coverage Expansion under the Affordable Care Act: A County‐Level Analysis.” Health Services Research 51 (3): 825–45. [DOI] [PMC free article] [PubMed] [Google Scholar]
- Vargas Bustamante, A. , and Chen J.. 2014. “The Great Recession and Health Spending among Uninsured U.S. Immigrants: Implications for the Affordable Care Act Implementation.” Health Services Research 49 (6): 1900–24. [DOI] [PMC free article] [PubMed] [Google Scholar]
- Vargas Bustamante, A. , Fang H., Rizzo J. A., and Ortega A. N.. 2009. “Heterogeneity in Health Insurance Coverage among US Latino Adults.” Journal of General Internal Medicine 24 (3): 561–6. [DOI] [PMC free article] [PubMed] [Google Scholar]
- Vargas Bustamante, A. , Chen J., Rodriguez H. P., Rizzo J. A., and Ortega A. N.. 2010. “Use of Preventive Care Services among Latino Subgroups.” American Journal of Preventive Medicine 38 (6): 610–9. [DOI] [PubMed] [Google Scholar]
- Zsembik, B. , and Fennell D.. 2005. “Ethnic Variation in Health and Determinants of Health among Latinos.” Social Science and Medicine 6 (1): 53–63. [DOI] [PubMed] [Google Scholar]
Associated Data
This section collects any data citations, data availability statements, or supplementary materials included in this article.
Supplementary Materials
Appendix SA1: Author Matrix.
Appendix SA2: Methods.
Table S1. Descriptive Statistics for the Sample (N = 9,284,631).
Table S2. Pre‐ACA Disparity in Uninsured Rates by Race/Ethnicity, Compared to Whites.
Table S3. Percent of Baseline Disparity in Uninsured Rates (vs. Whites) Accounted for by Multivariate Controls.
Table S4. Results Summary by Ethnicity and Proposed Larger Groupings.