

Abstract
Background
Indoor air pollution (IAP) leads to important respiratory morbidity and mortality in humans. Companion dogs and cats share the same household environment with their owners and are exposed to IAP.
Hypothesis
Pets with respiratory disease are more commonly exposed to indoor air pollutants in their homes and to worse air quality than pets without respiratory disease.
Animals
Three hundred and forty‐eight animals (230 dogs and 118 cats) were recruited.
Methods
Dogs and cats attending the National Taiwan University Veterinary Hospital were prospectively enrolled over a 12‐month period. Questionnaires were collected from pet owners regarding the status of signs of respiratory problem of animals and air pollutants in their homes. Clinical assessment was performed by veterinarians on all animals included in the case‐control study and the presence/absence of respiratory disease and diagnoses were recorded. Individual exposure to particulate matter of 2.5 μm or less (PM2.5) was estimated in the domestic microenvironment of the animals.
Results
Dogs with respiratory disease were more commonly exposed to incense burning than control dogs (30 versus 13%, P = .045), but household PM2.5 level was not different between dogs with and without respiratory disease [median 30.8 μg/m3, range 10.8‐214.2 versus median 38.2 μg/m3, range 5.4‐69.4, P = .57]. Signalment factors (age, body weight, and body condition score) instead of IAP factors were associated with respiratory disease in dogs using multivariable logistic regression. In contrast, household PM2.5 level was significantly higher in cats with respiratory disease than in control cats [median 38.6 μg/m3, range 17.8‐131.2 versus median 27.4 μg/m3, range 15.4‐70.0, P = .017]. Cats living in households with PM2.5 > 35 μg/m3 were more likely to have respiratory disease than those living in households with acceptable levels of PM2.5 (OR = 4.13, 95% CI 1.12‐15.27, P = .03).
Conclusions and Clinical Importance
The link between IAP and respiratory disease in dogs is complicated. An unacceptable level of household PM2.5 (>35 μg/m3) is significantly associated with respiratory disease in cats. The effect of IAP on the respiratory health of companion animals warrants further attention.
Keywords: airway, canine, feline, environmental tobacco smoke, indoor air pollution, one medicine, pm2.5, respiratory disease, spontaneous disease model
Abbreviations
- CI
confidence intervals
- ETS
environmental tobacco smoke
- IAP
indoor air pollution
- OR
odds ratio
- PM2.5
particulate matter of 2.5 μm or less
- WHO
World Health Organization
1. INTRODUCTION
Indoor air pollution (IAP) has been recognized as a worldwide health threat by the World Health Organization (WHO) for over a decade and results in acute respiratory effects, worsening of chronic respiratory disease, and death in humans.1, 2, 3 Of the millions of deaths associated with IAP every year, many occur in children and women, who spend more time indoors.1 In urban areas, pet dogs and cats frequently live an indoor lifestyle and share the same household environment with their pet owners. Detection of cotinine, nicotine, and organohalogenated contaminants in the serum, urine, and hair of pet dogs and cats has shown the existence of indoor pollution exposure in these companion animals.4, 5, 6, 7, 8, 9 Therefore, the impact of IAP on respiratory health care shall be an important issue for both human and veterinary medicine.
To date, few studies have investigated the health effect of IAP on client‐owned dogs and cats. Among various well‐known air pollutants, environmental tobacco smoke (ETS) has long been suspected of causing or exacerbating some chronic respiratory diseases in the veterinary literatures, such as feline lower airway disease, canine chronic bronchitis, and canine lymphoplasmacytic rhinitis.10, 11 In a controlled study using a questionnaire survey, exposure to ETS was not found to be a significant risk factor for chronic cough in client‐owned dogs.12 Nevertheless, differences on lower airway cytology and pulmonary function were detected between dogs with and without ETS exposure determined by serum or urine cotinine concentration.4, 7 The risk of respiratory system cancer has also been investigated in dogs, and exposure to ETS was not found to be a strong risk factor in these earlier studies.13, 14, 15 However, indoor kerosene or coal combustion was identified as an important environment risk factor for sinonasal cancer among pet dogs in one study.15
Sources other than ETS also contribute to poor indoor air quality. For instance, byproducts from cooking and numerous household chemicals are common indoor environmental hazards.1, 15, 16 Moreover, regionally prevalent household air pollutants in some countries, such as incense burning for religious use, should also be considered as important sources of IAP.17 Many of these pollutants result in dramatic increase in particulate matter of 2.5 μm or less (PM2.5), which can be used as an indicator for air quality level.16, 18 Studies have shown the adverse effect of PM2.5 on respiratory health in both experimental animals and human patients,3, 16, 19 but little is known about it in companion dogs and cats.
The aims of our study were to: (1) investigate the association between the existence of well‐known household air pollutants and the presence of respiratory disease in pets living an indoor lifestyle, (2) estimate air quality by screening PM2.5 level in the domestic microenvironment of pet dogs and cats, and (3) compare the air quality level in the domestic microenvironment between pets with and without respiratory disease. We hypothesized that the proportion of pets having respiratory disease is associated with the presence of indoor air pollutants in their homes, and pets with respiratory disease expose to worse air quality than pets without respiratory disease.
2. MATERIALS AND METHODS
2.1. Animals and study design
The study population consisted of client‐owned dogs and cats that attended the National Taiwan University Veterinary Hospital, which is a teaching hospital located in the middle of Taipei city receiving both referred and nonreferred cases. Dogs and cats were prospectively recruited over a 12‐month period (August 2016 through July 2017). Animals with and without respiratory disease were enrolled in a case‐control study if their owners signed an inform consent, joined a written questionnaire survey, and agreed quantifiable measurement of PM2.5 concentration around the household areas where the animal spent most of its time. The definition of “signs of respiratory problem” in our study is having any of the following clinical signs: coughing, sneezing, reverse sneezing, nasal discharge, noisy breathing, snoring, respiratory distress, tachypnea, cyanosis, and syncope; the definition of “respiratory disease” in our study is having a clinical diagnosis of a disease involving the respiratory system.
Written questionnaires were collected from the pet owners regarding the presence or absence of various signs of respiratory problem as well as the presence or absence of common household air pollutants in their home. Proper instruction or assistance was provided by veterinarians, veterinary assistants, or veterinary students to help the owners understand all of the investigated signs of respiratory problem. Clinical assessment was performed by veterinarians (C‐H Lin and P‐Y Lo) on each animal. History taking and thoracic auscultation were carried out on all animals, while further diagnostics such as thoracic radiography, pulmonary function testing, bronchoalveolar lavage with or without bronchoscopy, echocardiography, or computed tomography were suggested if there were appropriate indications. Assignment to the group with or without respiratory disease was determined by the clinical judgment of the veterinarians according to the findings of the clinical assessment. Animals with chronic or current respiratory disease (alone or along with various other diseases) were assigned to the respiratory disease group, whereas animals without current respiratory disease and history of previous respiratory disease (could be either healthy or ill) were assigned to the control group. Exclusion criteria were animals living an outdoor lifestyle (eg, unlimited outdoor access, no confinement indoors, or having daily activities such as sleeping and eating outside the house) rather than an indoor lifestyle (eg, having daily activities such as sleeping and eating inside the house, being confined indoors, and with no or restricted outdoor access), animals that had moved into the present house for less than 2 months at enrollment, the age of the animal being younger than 1 year old, and lack of sufficient information for veterinarians to make a judgment of the presence or absence of respiratory disease.
For estimating the prevalence of signs of respiratory problem and household air pollutants, additional written questionnaires (not for the animals enrolled in the case‐control study) were collected from the pet owners who visited the hospital for various purposes. There was no requirement for interviewing with veterinarians while answering the questionnaire and assistance was provided only if the owners requested it. Questionnaires for estimating the prevalence were excluded from analysis if more than 50% of the responses were missing, more than one questionnaire had been filled in for the same animal (medical record number and signalment information were examined), or questions had been answered with inappropriate responses (eg, multiple boxes were checked for single choice questions).
2.2. Questionnaire for household air pollutants and signs of respiratory problem
The existence of well‐known and regionally popular household air pollutants were investigated through a written questionnaire. The questionnaires for both case‐control study and prevalence estimation used identical questions. The pet owners responded to questions about the presence or absence of “long‐term or intermittent exposure to second‐hand smoke,” “cooking behavior/cooking fume exposure,” “incense burning for religious use,” and “frequent use of household chemicals (eg, paint)” in their homes by checking boxes on the questionnaire. If an owner selected there was the existence of second‐hand smoke in the house, a following question regarding three different exposure levels (“always,” “often,” “occasionally”) was offered. In addition to the choice‐type questions, an open question was provided to let the owners describe other possible household air pollutants in their houses.
Three different frequency levels (“often or more,” “sometimes,” “rarely or never”) for various clinical signs, including “coughing,” “sneezing/reverse sneezing/nasal discharge,” “noisy breathing/snoring,” “respiratory distress or tachypnea,” and “cyanosis or syncope,” were rated by the owners. If any of the above clinical signs was noted by the owner, the duration of the clinical sign was also requested on the questionnaire.
2.3. Household PM2.5 estimation
Quantifiable assessment of household air pollution was estimated by the measurement of PM2.5 concentration (μg/m3) for which a PM2.5 air quality monitor (TES‐5321, TES Electrical Electronic Corp, Taiwan) was used in accordance with the manufacturer's instructions with a measurement range of 0–500 μg/m3, a resolution of 1 μg/m3, and an accuracy of ±5 μg/m3 for ≤ 50 μg and ±10% for > 50 μg. All the samplings were performed when the owners were present at their homes. The air was sampled at the height of the animal's breathing zone, and readings were taken from five places most commonly frequented by the animal in the house. The temperature and humidity were measured and recorded at the same time. The average PM2.5 concentration of the 5 breathing zones was used for the final analysis.
2.4. Statistical analysis
Statistical analyses were processed with commercial software (SPSS 19.0.0; IBM Corporation, Armonk, New York; SAS 9.4; SAS Institute Inc, Cary, North Carolina). Variables were tested for Gaussian distribution using the Shapiro‐Wilk test, and data were expressed as mean ± SD for normally distributed data or median with range for nonparametric data. Comparisons of qualitative factors and the prevalence of household air pollutants between animals with and without respiratory disease were made using the chi‐squared test or Fisher exact test (when at least one expected value in the cells of a contingency table was less than five). Continuous variables were compared using t‐test or the Mann‐Whitney rank sum test. The concentration of PM2.5 ≤ 35 μg/m3 was defined as an acceptable level in our study. A cut‐off value of 35 μg/m3 was chosen and modified from the standard for indoor air quality announced by the Environmental Protection Administration of Taiwan, WHO air quality guidelines, and evidence from research on humans.20, 21 Univariable and multivariable logistic regression models were used to analyze the association between IAP and respiratory disease. Univariable logistic regression analysis was used to estimate the odds ratios (ORs) and 95% confidence intervals (CIs) of exposure factors for respiratory disease. The variables with P value < .1 in the univariable logistic regression model were selected into the multivariable logistic regression model, and only one variable was selected from two variables with collinearity. The Box‐Tidwell approach was used to evaluate linearity between the log‐odds and the continuous variables.22 The continuous variables were changed into categorical variables if the assumption of linearity was not met. Statistical significance was set at P < .05.
3. RESULTS
A total of 348 companion animals were recruited over a 12‐month period (August 2016‐July 2017): 202 of them were enrolled in the case‐control study (121 pet dogs and 81 pet cats), and 146 additional written questionnaires were collected for estimating the prevalence of signs of respiratory problem and household air pollutants.
The prevalence of signs of respiratory problem in pet dogs and cats was 89.0% and 73%, respectively, and the presence of signs of respiratory problem with “often or more” frequency was found for 45.0% of pet dogs and 19% of pet cats. The prevalence of second‐hand smoke, cooking behavior/cooking fumes, incense burning, and household chemicals in the pets home were 32.9%, 72.6%, 17.1%, and 11.6%, respectively.
3.1. Dogs
Eighty‐three dogs with various respiratory diseases and 38 control dogs without respiratory disease (attending for routine health care or problems other than signs of respiratory illness) were included in the case‐control study. Among the dogs with respiratory disease, approximately half of them (54%) were diagnosed with more than one category of respiratory disease or problem. Clinical diagnoses of dogs with respiratory disease included lower respiratory tract disease (such as, bronchomalacia or chronic bronchitis) in 65/83 dogs, tracheal collapse in 28/83 dogs, upper airway disease (such as, rhinitis or laryngeal disease) in 25/83 dogs, concurrent left atrial enlargement in 16/83 dogs, and pneumonia in 7/83 dogs along with other infrequent diagnoses such as undetermined etiology (3/83), esophageal disease‐related cough (2/83), obesity‐related respiratory problems (2/83), or nasal tumor (1/83).
The baseline characteristics of the pet dogs with and without respiratory disease are summarized in Table 1, in which the proportion of presence of long‐term/intermittent exposure to second‐hand smoke, cooking behavior/fumes, and frequent use of household chemicals in the household between pet dogs with and without respiratory disease were not significantly different. The proportion of existence of incense burning (30% versus 13%) in the household were statistically higher in the pet dogs with respiratory disease than those without (P = .045). Median household PM2.5 concentration in dogs with and without respiratory disease were 30.8 μg/m3 (range, 10.8–214.2) and 38.2 μg/m3 (range, 5.4–69.4), respectively (Figure 1A). There was no statistically significant difference between the two groups (P = .57). A PM2.5 concentration > 35 μg/m3 in the household was found for 48.3% of all dogs with no statistical difference between dogs with and without respiratory disease (45% versus 55%, P = .30).
Table 1.
Baseline characteristics of dogs and cats with and without respiratory disease, proportion of existence of selected household air pollutants, and household PM2.5 measurements
| Dogs | Cats | |||||
|---|---|---|---|---|---|---|
| Variable | Respiratory group (n = 83) | Control group (n = 38) | P | Respiratory group (n = 64) | Control group (n = 17) | P |
| Age (years) | 9.8 ± 3.3 | 7.7 ± 4.3 | .0092 | 8.0 (1–19) | 5.0 (1–14) | .063 |
| Sex (males) | 51.8 (43/83) | 44.7 (17/38) | .47 | 57.8 (37/64) | 52.9 (9/17) | .72 |
| Body weight (kg) | 5.1 (1.5‐44.2) | 10.9 (1.4‐36.2) | <.001 | 4.7 (2.9–10.9) | 4.6 (2.4–7.1) | .49 |
| 9‐point body condition score | 5 (2–8) | 5 (3–7) | .076 | 5 (3–9) | 5 (4–6) | .65 |
| Second‐hand smoke (%) | 33 (27/81) | 18 (7/38) | .093 | 27 (17/64) | 12 (2/17) | .33 |
| Incense burning (%) | 30 (25/83) | 13 (5/38) | .045 | 22 (14/64) | 6 (1/17) | .17 |
| Cooking behavior/fume (%) | 71 (58/82) | 79 (30/38) | .34 | 70 (45/64) | 53 (9/17) | .18 |
| Household chemicals (%) | 2 (2/83) | 5 (2/38) | .59 | 3 (2/63) | 12 (2/17) | .20 |
| Average PM2.5 (μg/m3) | 30.8 (10.8–214.2) | 38.2 (5.4–69.4) | .57 | 38.6 (17.8‐131.2) | 27.4 (15.4–70.0) | .017 |
| Environmental temperature (°C) | 25.2 ± 3.7 | 27.1 ± 2.9 | .0087 | 26.0 ± 3.3 | 27.8 ± 3.0 | .045 |
| Environmental humidity (%) | 65.7 ± 8.5 | 69.3 ± 8.7 | .034 | 64.3 ± 8.1 | 62.3 ± 8.8 | .36 |
| Unacceptable PM2.5 level (%) | 45 (36/80) | 55 (21/38) | .30 | 59 (38/64) | 29 (5/17) | .028 |
Bolded values indicating 2‐tailed P < .05.
Data are presented as mean ± standard deviation, median with range, or percentage with numbers.
Figure 1.
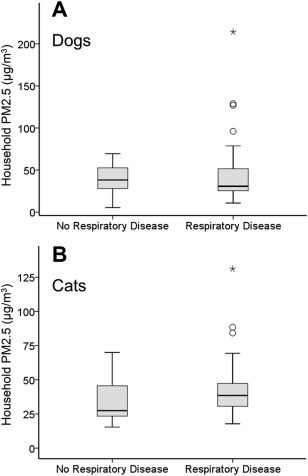
A, Distribution of household PM2.5 concentration for dogs without respiratory disease (n = 38) and dogs with respiratory disease (n = 83). The box represents the interquartile range (25th‐75th percentile). The horizontal line within each box represents the median. The whisker bars represent the highest and lowest values within 1.5 times of the interquartile range, the open circle indicates outlier that is more than 1.5 times the interquartile range, and the black star indicates extreme value that is more than 3 times the interquartile range. There was no statistical difference in household PM2.5 level between dogs without and with respiratory disease (P = .57). B, Distribution of household PM2.5 concentration for cats without respiratory disease (n = 17) and cats with respiratory disease (n = 64). Cats with respiratory disease lived in the households with significantly higher PM2.5 level compared to cats without respiratory disease (P = .017)
The results of univariable and multivariable logistic regression analyses are reported in Table 2. After adjustment for age, body weight, body condition score, and environmental temperature and humidity, second‐hand smoke or incense burning was not recognized as a significant risk factor for respiratory disease in pet dogs. Older age, smaller body weight (refers to small breeds), and increased body condition score (refers to level of obesity) were associated with an increased risk of respiratory disease in pet dogs.
Table 2.
Univariable and multivariable logistic regression analyses of factors potentially associated with the presence of respiratory disease in dogs
| Univariable analysis | Multivariable analysis | |||||
|---|---|---|---|---|---|---|
| Variable | Crude OR | 95% CI | P | Adjusted OR | 95% CI | P |
| Age (years) | 1.17 | 1.05‐1.31 | .0049 | 1.16 | 1.02‐1.33 | .027 |
| Body weight (kg) a | ||||||
| <4.3 | 1.00 | 1.00 | ||||
| 4.3–6.4 | 0.28 | 0.07‐1.06 | .062 | 0.21 | 0.04‐1.13 | .069 |
| >6.4 | 0.15 | 0.05‐0.43 | .0004 | 0.08 | 0.02‐0.28 | .0001 |
| 9‐Point body condition score | 1.36 | 0.96‐1.93 | .081 | 1.86 | 1.14‐3.04 | .013 |
| Second‐hand smoke (%) | 2.21 | 0.86‐5.68 | .098 | 2.37 | 0.72‐7.80 | .15 |
| Incense burning (%) | 2.84 | 0.99‐8.14 | .051 | 1.96 | 0.53‐7.24 | .31 |
| Cooking behavior/fume (%) | 0.64 | 0.26‐1.61 | .35 | NA | NA | NA |
| Household chemicals (%) | 0.44 | 0.06‐3.28 | .43 | NA | NA | NA |
| Average PM2.5 (μg/m3) | 1.01 | 0.99‐1.02 | .50 | NA | NA | NA |
| Environmental temperature (°C) | 0.85 | 0.75‐0.96 | .011 | 0.89 | 0.76‐1.04 | .14 |
| Environmental humidity (%) | 0.95 | 0.91‐1.00 | .037 | 0.97 | 0.92‐1.04 | .39 |
| Unacceptable PM2.5 level (%) | 0.66 | 0.30‐1.44 | .30 | NA | NA | NA |
Bolded values indicating 2‐tailed P < .05.
Abbreviation: NA, not applicable (not included in multivariable model).
aThe continuous body weight variable was divided into three categories by tertile since the assumption of linearity between the log‐odds and the body weight was not met.
3.2. Cats
Sixty‐four cats with various respiratory diseases and 17 control cats without respiratory disease (attending for routine health care or problems other than signs of respiratory illness) were included in the case‐control study. Among cats with respiratory disease, only a minority (22%) were diagnosed with having more than one category of respiratory disease or problem. Clinical diagnoses of cats with respiratory disease included feline lower airway disease including feline asthma, chronic bronchitis, or mixed‐type inflammatory airway disease in 40/64 cats, upper airway disease such as rhinitis, nasopharyngeal, or laryngeal disease in 15/64, pneumonia in 12/64, interstitial lung disease in 6/64, primary or metastatic lung cancer in 5/64, and undetermined etiology in 5/64 as well as other infrequent diagnoses such as nasal tumor (2/64), pneumothorax because of ruptured bullae or emphysema (1/64), or diaphragmatic hernia (1/64).
The baseline characteristics of the pet cats with and without respiratory disease are summarized in Table 1, in which the proportion of existence of long‐term/intermittent exposure to second‐hand smoke, incense burning, cooking behavior/fumes, and frequent use of household chemicals in the household were not significantly different between cats with and without respiratory disease. Median household PM2.5 concentration in pet cats with respiratory disease (38.6 μg/m3; range, 17.8–131.2) was significantly higher than for those without (27.4 μg/m3; range, 15.4–70.0; P = .017; Figure 1B). An unacceptable level of PM2.5 concentration (>35 μg/m3) in the household was present in 53% of all cats with a significant difference between cats with and without respiratory disease (59% versus 29%, P = .028).
The results of univariable and multivariable logistic regression analyses are shown on Table 3. An unacceptable level of PM2.5 concentration (>35 μg/m3) and lower environmental temperature were found to be possible risk factors for respiratory disease in cats in the univariable analyses. After adjustment for age and environmental temperature, we found that cats living in households with a PM2.5 level > 35 μg/m3 were more likely to have respiratory disease than those living in households with an acceptable level of PM2.5 (OR = 4.13, 95% CI 1.12–15.27; P = .03).
Table 3.
Univariable and multivariable logistic regression analyses of factors potentially associated with the presence of respiratory disease in cats
| Univariable analysis | Multivariable analysis | |||||
|---|---|---|---|---|---|---|
| Variable | Crude OR | 95% CI | P | Adjusted OR | 95% CI | P |
| Age (years) | 1.13 | 0.99‐1.30 | .076 | 1.09 | 0.94‐1.26 | .24 |
| Body weight (kg) | 1.25 | 0.80‐1.96 | .32 | NA | NA | NA |
| 9‐point body condition score | 1.29 | 0.80‐2.09 | .30 | NA | NA | NA |
| Second‐hand smoke (%) | 2.71 | 0.56‐13.12 | .21 | NA | NA | NA |
| Incense burning (%) | 4.48 | 0.55‐36.78 | .16 | NA | NA | NA |
| Cooking behavior/fume (%) | 2.11 | 0.71‐6.28 | .18 | NA | NA | NA |
| Household chemicals (%) | 0.25 | 0.03‐1.89 | .18 | NA | NA | NA |
| Average PM2.5 (μg/m3) | 1.04 | 1.00–1.09 | .080 | NA | NA | NA |
| Environmental temperature (°C) | 0.84 | 0.70‐1.00 | .051 | 0.79 | 0.64‐0.97 | .023 |
| Environmental humidity (%) | 1.03 | 0.97‐1.10 | .36 | NA | NA | NA |
| Unacceptable PM2.5 level (%) | 3.51 | 1.10‐11.15 | .033 | 4.13 | 1.12‐15.27 | .033 |
Bolded values indicating 2‐tailed P < .05.
Abbreviation: NA, not applicable (not included in multivariable model).
4. DISCUSSION
In our study, we investigated the prevalence of several well‐known household air pollutants and quantified household air quality by estimating PM2.5 concentration in the animals' breathing zones in pets with and without respiratory disease. The results of our study revealed that cats with respiratory disease were living in households with significantly higher PM2.5 concentration compared to cats without respiratory disease. A household PM2.5 concentration > 35 μg/m3 was significantly associated with respiratory disease in pet cats but not in pet dogs.
Some previous studies have found that dogs' exposure to cigarette smoking or concentrated ambient 0.1–2.5 μm fine particles was able to cause mucosal lesions in central airways and bronchioles, impair mucociliary function, increase neutrophil percentage or lymphocyte and macrophage count in bronchoalveolar lavage fluid, and induce changes on pulmonary function.4, 7, 19, 23 In our study, exposure to second‐hand smoke and several other indoor air pollutants was not found to be a significant risk factor for respiratory disease in dogs. This finding is very similar to a previous study, which also failed to recognize the association between second‐hand smoke in the house and chronic coughing signs in pet dogs.12 Although the inclusion criteria for patient enrollment and the overall study design in our study were different from this previous study, it is noteworthy that the majority of dogs had a diagnosis of lower airway problems in both studies, implying the population composition in the two studies might be comparable. These results suggest that a strong association between respiratory disease and IAP either does not exist in pet dogs or is undetectable through questionnaire methodology.
Moreover, the household PM2.5 level of dogs with respiratory disease were even lower than those of the control dogs in our study—a finding that might further disapprove the association between IAP and respiratory disease in dogs. Nevertheless, there were more outliers and extreme values observed in dogs with respiratory disease compared with the control dogs (Figure 1A), inferring that extremely high values of PM2.5 readings tended to be present in the households of dogs with respiratory disease. When second‐hand smoke and incense burning were combined under a single exposure category, the proportion of its presence between dogs with and without respiratory disease was significantly different (14% versus 0%, P = .016). Therefore, it cannot be simply concluded that IAP was not important in dogs with respiratory disease, but the association might be far more complicated than previously supposed. Compared with air pollution factors, signalment characteristics such as age, body weight, and body condition were more evident risk factors for respiratory disease in dogs. Furthermore, over half of the pet dogs presented with multiple respiratory diagnoses, which might have complicated subsequent analysis. Many of these dogs had concurrent structural problems, such as bronchomalacia or tracheal collapse, which are congenital disorders and typically induce coughing, thus respiratory disease status in these dogs was less likely to be related to IAP.
In contrast to dogs, less than one‐fourth of cats were diagnosed with more than one respiratory disease. Inflammatory disease (eg, inflammatory lower airway disease, rhinitis, or pneumonia) comprised the majority of the respiratory diagnoses in our study cats, which might explain why unacceptable household air quality was found to significantly affect cats in our study. Indoor particulate matter could have induced inflammatory respiratory illness through oxidative stress and proinflammatory effects.16 Airway neutrophilic inflammation, proliferation of goblet cells in larger airways, increased nonspecific airway responsiveness, impairment of bacteriosuppressive activity of alveolar macrophages, and lung injury after exposure to air pollutants have been reported in experimental animals.23, 24 Human epidemiologic studies have extensively presented evidence that associates IAP with chronic obstructive pulmonary disease, asthma, pneumonia, rhinitis, and acute respiratory clinical signs.1, 2, 3, 25 The results in our study indicate that a similar scenario was observed among pet cats living an indoor lifestyle. While “One Medicine” or “One Health” is a growing issue, the concept of using companion animals as sentinels for human health has been proposed in many aspects of the veterinary and medical professions.26, 27 It could have the potential of considering pet cats as a spontaneous disease model for IAP‐related respiratory disease.
The concentration of PM2.5 in the animals' breathing zones was chosen to estimate air quality in places most commonly frequented by the study animal in the house. The deposition of ambient particulate matter in the respiratory tract is determined by particle size, chemical composition, and characteristics of the airflow. In average human adults, larger size particulate matter (2.5–10 μm) is likely to be deposited in the nasal cavity, pharynx, and larynx, whereas fine (0.1–2.5 μm) and ultrafine (<0.1 μm) particulate matter are likely to be deposited in the tracheobronchial tree and alveoli.16, 18 Species differences such as disparate airway caliber, anatomical geometry, and nasal versus mouth breathing could affect airflow characteristics and particles deposition.18 Little is known about the actual deposition of particulate matter in the respiratory tract of cats, but the diameter of a cat's terminal bronchiole (100–432 μm)28 shall allow fine particles (PM2.5) to be inhaled without anatomical obstruction. An unacceptable PM2.5 level was significantly associated with respiratory disease in cats in our study, implying these fine particles were able to deposit in the respiratory tract of cats and cause detrimental effects.
When one particular indoor air pollutant was considered, exposure to second‐hand smoke (27% versus 12%), incense burning (22% versus 6%) and cooking behavior/fumes (70% versus 53%) in the household were more common in cats with respiratory disease but not statistically different from cats without respiratory disease. Nevertheless, when an overall indicator (PM2.5) was used, significantly worse air quality was recorded in the households of cats with respiratory disease. Levels of PM2.5 were reported to be significantly correlated with the presence of smokers in the household in a previous study3; however, no statistically significant association was found between the average PM2.5 level and any of the household air pollutants investigated in our study (data not shown). This is not surprising because the measured PM2.5 levels would track with cumulative instead of individual sources of particulate matters. Even though different exposure levels of second‐hand smoke were considered in additional analyses, we were still unable to detect statistically significant correlation between the existence of second‐hand smoke and respiratory disease. This might reflect that the reason for poor air quality is multifactorial,16 and the complexity of human activity affects the strength of the contribution of a particular indoor air pollutant. For instance, some pet owners with a smoking habit were aware of the detrimental effect of ETS exposure to their family members, thereby they would avoid smoking indoors or try improving air circulation whenever possible. The owner's behavior could dramatically affect the amount of pollutants that an animal received, thus the information from a questionnaire cannot actually correspond to the extent of IAP in a given household.
In clinical practice, it is usually not possible to quantify air quality in a pet's household. Therefore, whether an environmental factor exists that induces or exacerbates signs of respiratory problem is usually determined through history taking by clinicians. Our study showed that the result of quantitative assessment for IAP rather than qualitative evaluation was associated with respiratory disease. It should be kept in mind that the presence or absence of IAP as an exacerbating factor could not be fully ruled out from the patient history while evaluating and managing clinical cases with respiratory disease.
Our study had some limitations. Firstly, the prevalence of signs of respiratory problem was high among the study population, and so it was more difficult to recruit animals free of any respiratory disease into the control group. It has been reported that the prevalence of signs of respiratory problem were as high as 56.3% in Swedish Yorkshire terriers, a small breed of dog prone to respiratory disease.29 Small breeds also comprised the majority of the dogs in our study (68%), which might explain the extremely frequent signs of respiratory problem observed. Secondly, household PM2.5 level was estimated by averaging the real‐time readings taken from several places most commonly frequented by the animal in the house in our study, whereas air sampling in human epidemiologic studies has usually been performed by installing a monitor in the living room or selected location over a period of time (eg, 24 hours) and averaging all readings over the sampling period.2, 3, 16 It should be borne in mind that a single time assessment of household PM2.5 levels might not reflect the day‐in, day‐out exposure. The main problem with our method was that dynamic changes in PM2.5 concentrations during a period of time were not considered,3 although the effect of this possible measurement bias was equal for both the case and control groups. Otherwise, for house pets, we believe that air sampling from breathing zones of multiple places that the animals spent most time at was more representative for the air quality level in their domestic microenvironment. More accurate estimation of PM2.5 concentration during a certain time period in the breathing zone can be obtained by utilizing wearable monitor technology,18, 30 but applying this to pet dogs and cats is not feasible at the moment. Thirdly, some invasive diagnostic procedures such as lower airway sampling or biopsy would not be allowed in pets without clinically apparent respiratory disease. Therefore, it remains unknown if some animals in the control group had a subclinical respiratory disease, and misclassification of grouping might have affected the outcome of statistical analysis. Lastly, cases in respiratory disease group included various etiologies, but IAP might impact the risk of each type of respiratory disease differently. This is an important limitation because the clinical case mix can be associated with low power and might thus lead to insignificant results. The case numbers in each disease category in our study were insufficient for appropriate subgroup analyses; therefore, further investigations are warranted to examine the effect of IAP on individual respiratory illness in companion animals, particularly in pet cats.
In conclusion, our study provided clinical evidence of the role of IAP on the respiratory health of companion dogs and cats. Exposure to household incense burning was significantly more common in dogs with respiratory disease compared with dogs without respiratory disease, but there was no strong association found between IAP and respiratory disease in pet dogs. In contrast to dogs, cats with respiratory disease lived in the households with significantly higher PM2.5 concentration compared to cats without respiratory disease. After adjusting for age and environmental temperature, an unacceptable level of household PM2.5 concentration (>35 μg/m3) was found to be significantly associated with respiratory disease in cats (OR = 4.13, 95% CI 1.12–15.27). Quantifying IAP can help recognize and monitor environmental hazards to animal health, and the effect of IAP on the respiratory health of companion animals warrants further attention.
CONFLICT OF INTEREST DECLARATION
Authors declare no conflict of interest.
OFF‐LABEL ANTIMICROBIAL DECLARATION
Authors declare no off‐label use of antimicrobials.
INSTITUTIONAL ANIMAL CARE AND USE COMMITTEE (IACUC) OR OTHER APPROVAL DECLARATION
Authors declare no IACUC or other approval was needed.
ACKNOWLEDGMENTS
Part of the data was presented in the format of poster presentations at the 35th Annual Symposium of Veterinary Comparative Respiratory Society, October 2017, in Champaign, Illinois. The authors acknowledge statistical assistance provided by the Department of Medical Research in National Taiwan University Hospital. They also thank all those dedicated pet owners involved in this study for their collaboration. The work was done at National Taiwan University Veterinary Hospital, National Taiwan University, Taiwan. This study was supported by Ministry of Science and Technology, Taiwan (MOST 105–2313‐B‐002–055 ‐).
Lin C‐H, Lo P‐Y, Wu H‐D, Chang C, Wang L‐C. Association between indoor air pollution and respiratory disease in companion dogs and cats. J Vet Intern Med. 2018;32:1259–1267. https://doi.org/10.1111/jvim.15143
Funding information Ministry of Science and Technology, Taiwan (MOST 105‐2313‐B‐002‐055 ‐)
REFERENCES
- 1. Mortimer K, Gordon SB, Jindal SK, Accinelli RA, Balmes J, Martin WJ II. Household air pollution is a major avoidable risk factor for cardiorespiratory disease. Chest. 2012;142:1308–1315. [DOI] [PMC free article] [PubMed] [Google Scholar]
- 2. Simoni M, Scognamiglio A, Carrozzi L, et al. Indoor exposures and acute respiratory effects in two general population samples from a rural and an urban area in Italy. J Expo Sci Environ Epidemiol. 2004;14:S144–S152. [DOI] [PubMed] [Google Scholar]
- 3. Osman LM, Douglas JG, Garden C, et al. Indoor air quality in homes of patients with chronic obstructive pulmonary disease. Am J Respir Crit Care Med. 2007;176:465–472. [DOI] [PubMed] [Google Scholar]
- 4. Yamaya Y, Sugiya H, Watari T. Tobacco exposure increased airway limitation in dogs with chronic cough. Vet Rec. 2014;174:18. [DOI] [PMC free article] [PubMed] [Google Scholar]
- 5. Smith VA, McBrearty AR, Watson DG, Mellor DJ, Spence S, Knottenbelt C. Hair nicotine concentration measurement in cats and its relationship to owner‐reported environmental tobacco smoke exposure. J Small Anim Pract. 2017;58:3–9. [DOI] [PubMed] [Google Scholar]
- 6. Ali N, Malik RN, Mehdi T, et al. Organohalogenated contaminants (OHCs) in the serum and hair of pet cats and dogs: biosentinels of indoor pollution. Sci Total Environ. 2013;449:29–36. [DOI] [PubMed] [Google Scholar]
- 7. Roza MR, Viegas CA. The dog as a passive smoker: effects of exposure to environmental cigarette smoke on domestic dogs. Nicotine Tob Res. 2007;9:1171–1176. [DOI] [PubMed] [Google Scholar]
- 8. Knottenbelt CM, Bawazeer S, Hammond J, Mellor D, Watson DG. Nicotine hair concentrations in dogs exposed to environmental tobacco smoke: a pilot study. J Small Anim Pract. 2012;53:623–626. [DOI] [PubMed] [Google Scholar]
- 9. McNiel EA, Carmella SG, Heath LA, Bliss RL, Le KA, Hecht SS. Urinary biomarkers to assess exposure of cats to environmental tobacco smoke. Am J Vet Res. 2007;68:349–353. [DOI] [PubMed] [Google Scholar]
- 10. Johnson LR. Clinical Canine and Feline Respiratory Medicine. 1st ed. Ames, IA: Wiley‐Blackwell; 2010. [Google Scholar]
- 11. Mackin AJ. Lymphoplasmacytic rhinitis In: King LG, ed. Textbook of Respiratory Disease in Dogs and Cats. 1st ed.; Chapter 39. St. Louis, MO: Elsevier Saunders; 2004:305–310. [Google Scholar]
- 12. Hawkins EC, Clay LD, Bradley JM, Davidian M. Demographic and historical findings, including exposure to environmental tobacco smoke, in dogs with chronic cough. J Vet Intern Med. 2010;24:825–831. [DOI] [PMC free article] [PubMed] [Google Scholar]
- 13. Reif JS, Dunn K, Ogilvie GK, Harris CK. Passive smoking and canine lung cancer risk. Am J Epidemiol. 1992;135:234–239. [DOI] [PubMed] [Google Scholar]
- 14. Reif JS, Bruns C, Lower KS. Cancer of the nasal cavity and paranasal sinuses and exposure to environmental tobacco smoke in pet dogs. Am J Epidemiol. 1998;147:488–492. [DOI] [PubMed] [Google Scholar]
- 15. Bukowski JA, Wartenberg D, Goldschmidt M. Environmental causes for sinonasal cancers in pet dogs, and their usefulness as sentinels of indoor cancer risk. J Toxicol Environ Health Part A. 1998;54:579–591. [DOI] [PubMed] [Google Scholar]
- 16. Bernstein JA, Alexis N, Bacchus H, et al. The health effects of nonindustrial indoor air pollution. J Allergy Clin Immunol. 2008;121:585–591. [DOI] [PubMed] [Google Scholar]
- 17. Lin TC, Krishnaswamy G, Chi DS. Incense smoke: clinical, structural and molecular effects on airway disease. Clin Mol Allergy. 2008;6:3. [DOI] [PMC free article] [PubMed] [Google Scholar]
- 18. Ivester KM, Couetil LL, Zimmerman NJ. Investigating the link between particulate exposure and airway inflammation in the horse. J Vet Intern Med. 2014;28:1653–1665. [DOI] [PMC free article] [PubMed] [Google Scholar]
- 19. Clarke RW, Coull B, Reinisch U, et al. Inhaled concentrated ambient particles are associated with hematologic and bronchoalveolar lavage changes in canines. Environ Health Perspect. 2000;108:1179–1187. [DOI] [PMC free article] [PubMed] [Google Scholar]
- 20. Chen YY, Sung FC, Chen ML, Mao IF, Lu CY. Indoor air quality in the metro system in north Taiwan. Int J Environ Res Public Health. 2016;13:1200. [DOI] [PMC free article] [PubMed] [Google Scholar]
- 21. Bruce N, Pope D, Rehfuess E, Balakrishnan K, Adair‐Rohani H, Dora C. WHO indoor air quality guidelines on household fuel combustion: strategy implications of new evidence on interventions and exposure‐risk functions. Atmos Environ. 2015;106:451–457. [Google Scholar]
- 22. Box GEP, Tidwell PW. Transformation of the independent variables. Technometrics. 1962;4:531–550. [Google Scholar]
- 23. Park SS, Kikkawa Y, Goldring IP, et al. An animal model of cigarette smoking in beagle dogs: correlative evaluation of effects on pulmonary function, defense, and morphology. Am Rev Respir Dis. 1977;115:971–979. [DOI] [PubMed] [Google Scholar]
- 24. Dye JA, Lehmann JR, McGee JK, et al. Acute pulmonary toxicity of particulate matter filter extracts in rats: coherence with epidemiologic studies in Utah Valley residents. Environ Health Perspect. 2001;109 Suppl 3:395–403. [DOI] [PMC free article] [PubMed] [Google Scholar]
- 25. Simoni M, Annesi‐Maesano I, Sigsgaard T, et al. School air quality related to dry cough, rhinitis and nasal patency in children. Eur Respir J. 2010;35:742–749. [DOI] [PubMed] [Google Scholar]
- 26. Reif JS. Animal sentinels for environmental and public health. Public Health Rep. 2011;126:50–57. [DOI] [PMC free article] [PubMed] [Google Scholar]
- 27. Spontaneous animal models of human disease. Vet Rec. 2005;156:559–560. [DOI] [PubMed] [Google Scholar]
- 28. Klingele TG, Staub NC. Terminal bronchiole diameter changes with volume in isolated, air‐filled lobes of cat lung. J Appl Physiol. 1971;30:224–227. [DOI] [PubMed] [Google Scholar]
- 29. Madsen MF, Granstrom S, Toft N, Houe H, Willesen JL, Koch J. Prevalence of respiratory signs and identification of risk factors for respiratory morbidity in Swedish Yorkshire terriers. Vet Rec. 2012;170:565. [DOI] [PubMed] [Google Scholar]
- 30. Chakrabarti B, Fine PM, Delfino R, Sioutas C. Performance evaluation of the active‐flow personal DataRAM PM2.5 mass monitor (Thermo Anderson pDR‐1200) designed for continuous personal exposure measurements. Atmos Environ. 2004;38:3329–3340. [Google Scholar]