

Summary
Head and neck squamous cell carcinoma (HNSCC) is a highly immunosuppressive malignancy. Exosomes in HNSCC patients' plasma are enriched in inhibitory cargo and mediate immunosuppression. As these exosomes are products of various cells, the cellular origin of immunoregulatory proteins they carry is unknown. To test whether tumour‐ or T cell‐derived exosomes in patients' plasma are immunosuppressive and impact upon disease activity, we separated CD3(–) from CD3(+) exosomes by immunocapture using anti‐CD3 antibodies. The exosome protein cargo was evaluated for immunoregulatory proteins using on‐bead flow cytometry. Tumour protein‐enriched CD3(–) exosomes were CD44v3(+). Surprisingly, mean levels of programmed death ligand 1 (PD‐L1), cytotoxic T lymphocyte antigen 4 (CTLA‐4) and cyclooxygenase‐2 (COX‐2) were similar in CD3(+) and CD3(–) exosomes, although the latter induced higher (P < 0·0025) ex‐vivo apoptosis of CD8(+) T cells and greater (P < 0·005) conversion of CD4+ T cells to CD4(+)CD39(+) regulatory T cells (Treg). CD3(+) and CD3(–) exosomes carrying high levels of immunosuppressive proteins were highly effective in mediating these functions. Exosomes of patients with Union for International Cancer Control (UICC) stages III/IV disease had higher levels of PD‐L1 and COX‐2 than stages I/II patients (P < 0·005). Patients with nodal involvement had exosomes with the higher inhibitory protein content than N0 patients (P < 0·03). CD3(+) and CD3(–) exosomes of HNSCC patients had higher PD‐L1, COX‐2 and CD15s levels than healthy donors' exosomes (P < 0·009), although levels of immunostimulatory OX40 or OX40L were not different. By isolating CD3(–)/CD44v3‐enriched and CD3(+) exosomes from plasma, the cellular origins of immunoregulatory proteins they carry were identified. Association of exosome molecular profiles with disease progression supports the exosome potential as future cancer biomarkers.
Keywords: disease progression, HNSCC, immune regulation, T cell‐derived exosomes, tumour‐derived exosomes (TEX)
Introduction
A role of the immune system in cancer development and progression is well established 1, 2. However, human tumours utilize various mechanisms to evade the immune system and protect themselves from tumour‐induced immune suppression 3, 4. Among the broad variety of mechanisms contributing to immune suppression in the tumour microenvironment (TME), more recent studies have identified tumour‐derived extracellular vesicles (EVs) as carriers of immunosuppressive proteins that upon delivery to recipient immune cells reprogramme their functions, inducing suppression of anti‐tumour activities 5, 6, 7. EVs also reprogramme non‐immune cells in the TME, converting them into producers of factors that promote tumour growth, on one hand, and suppress functions of immune cells on the other hand 8. Among EVs, exosomes are the smallest vesicles (30–150 nm) derived from the endocytic compartment of parent cells and carrying endocytic markers such as apoptosis‐linked gene 2‐interacting protein X (ALIX) or tumour susceptibility 101 (TSG101) 9, 10. Exosomes also carry molecular and genetic cargos that partly mimic those found in their parent cells. Exosomes serve as an effective communication system between the tumour and the host cells 11. With currently available methods, it has been possible to isolate from plasma and measure levels as well as cargo components of total plasma exosomes 12, 13. Human tumours, including head and neck squamous cell carcinomas (HNSCCs), produce large quantities of exosomes referred to as TEX, and plasma of patients with HNSCC contains significantly more exosomes than plasma of healthy donors 14. Further, plasma levels of total exosomes have a prognostic value and have been linked to overall survival in patients with melanoma 15 and to disease activity as well as stage in HNSCC 14. In addition, we have reported recently that programmed death ligand 1 (PD‐L1) levels in total plasma exosomes of patients with HNSCC correlated with disease activity, the Union for International Cancer Control (UICC) stage and nodal involvement 16. Here, in a different cohort of HNSCC patients, we determine the content and levels of several different immunosuppressive and immunosupportive proteins in CD3(+) versus CD3(–) exosomes in relation to the same clinical end‐points. PD‐L1, cytotoxic T lymphocyte antigen 4 (CTLA‐4) and cyclooxygenase 2 (COX‐2) are well‐known suppressive molecules, while OX40 and OX40L represent an immunostimulatory signalling pathway 17. CD15s is a newer, recently described marker for regulatory T cells (Treg). Programmed death 1 (PD‐1), a check‐point receptor, is expressed highly on lymphocytes, whereas PD‐L1 is found on various cell types, including tumour cells 18. CTLA‐4 is expressed highly on lymphocytes 19. OX40 is expressed mainly on activated CD4(+) and CD8(+) T cells and also on various haematopoietic cells. Its ligation induces activation and proliferation of CD8(+) effector cells and suppresses differentiation and activity of Treg simultaneously 20. OX40L is found on antigen‐presenting cells (APCs) such as B cells, dendritic cells (DCs) and macrophages and controls priming of antigen‐stimulated T cells 21.
Exosomes present in plasma are products of many different cells, including circulating immune cells, and the ratio of tumour‐derived/total plasma exosomes might vary among patients with cancer. Recently, we have isolated melanoma‐derived exosomes (MTEX) from plasma of patients with melanoma by immunocapture and separated MTEX from non‐tumour‐derived exosomes 22. The isolated MTEX were found to be highly enriched in melanoma‐associated antigens (MAA) and to carry immunosuppressive proteins. High levels of MTEX in melanoma patients' plasma associated with the presence of advanced metastatic melanoma, and especially invasive disease 22. Our study also demonstrated that isolation of exosome subsets using immunocapture is feasible and provides potentially useful information about exosome cargo and its relationship to cancer progression.
Based on our MTEX studies, we considered the possibility of separating T cell‐derived exosomes from all other exosomes present in plasma using an antibody specific for CD3, which is expressed only on T lymphocytes. The rationale for immunocapture of CD3(+) exosomes from plasma was to determine their content in exosomes of patients with cancer and evaluate their potential contribution to tumour progression. We hypothesized that in patients with cancer, circulating T cells are reprogrammed by TEX and begin to produce their own exosomes carrying a molecular cargo that can influence disease activity either by modulating tumour progression or by exercising immunoregulatory activities. In this study, we show that immune capture of the CD3(+) exosome subset from plasma exosomes is feasible, and that the molecular cargo they carry informs about functionality of the parent T cells altered by TEX in the TME. An important consequence of T cell reprogramming by TEX is a change in the exosome cargo which associates with disease activity. In addition, the CD3(–) exosome fraction, which is enriched in TEX, emerges as a source of information about the role of the TEX molecular content in disease progression.
Materials and methods
Patients
Randomly collected peripheral blood specimens were obtained from HNSCC patients seen at the UPMC Otolaryngology Clinic between years 2004 and 2017. The collection of blood samples and access to clinical data for research were approved by the Institutional Review Board of the University of Pittsburgh (IRB no. 960279, IRB no. 0403105 and IRB no. 0506140). Additionally, peripheral blood of six healthy controls was processed. All six healthy controls were male and the mean age was 40 years. Table 1 provides clinicopathological characteristics of the patients enrolled into the study. The blood samples were delivered in heparin tubes to the laboratory and were processed immediately. After centrifugation at 1000 g for 10 min, plasma specimens were stored in 1‐ml aliquots at −80°C and were thawed immediately prior exosome isolation.
Table 1.
Clinicopathological parameters for patients with head and neck squamous cell carcinoma (HNSCC) enrolled into the study
| Patients (n = 22) | ||
|---|---|---|
| n | % | |
| Age (years) | ||
| ≤ 64 | 9 | 41 |
| >64 | 13 | 59 |
| (range = 42–78) | ||
| Gender | ||
| Male | 16 | 73 |
| Female | 6 | 27 |
| Disease status | ||
| AD | 16 | 73 |
| NED | 6 | 27 |
| Primary tumour site | ||
| Oral cavity | 8 | 36 |
| Pharynx | 7 | 32 |
| Larynx | 7 | 32 |
| Tumour stage | ||
| T1 | 7 | 32 |
| T2 | 10 | 45 |
| T3 | 3 | 14 |
| T4 | 2 | 9 |
| Nodal status | ||
| N0 | 10 | 45 |
| N ≥ 1 | 12 | 55 |
| Distant metastasis | ||
| M0 | 0 | 0 |
| UICC stage | ||
| I | 10 | 45 |
| II | 5 | 23 |
| III | 5 | 23 |
| IV | 2 | 9 |
| Alcohol consumption | ||
| Yes | 14 | 64 |
| No | 8 | 36 |
| Tobacco consumption | ||
| Yes | 19 | 86 |
| No | 3 | 14 |
UICC = Union for International Cancer Control.
Exosome isolation by mini size‐exclusion chromatography (mini‐SEC)
The mini‐SEC method for exosome isolation was established and optimized in our laboratory as described previously 13 (EV‐TRACK ID = EV160007). Briefly, plasma samples were thawed and pre‐cleared by centrifugations at 2000 g, then 10 000 g and by ultrafiltration using a 0·22 μm filter 13. An aliquot of plasma (1 ml) was placed on a mini‐SEC column and eluted with phosphate‐buffered saline (PBS). The 4th void volume fraction (fraction #4) (1 mL) enriched in exosomes was collected as described previously 13.
Characteristics of plasma‐derived exosomes
Exosomes isolated by mini‐SEC were evaluated for their size by qNano (Izon, Cambridge, MA, USA), morphology by transmission electron microscopy and cellular origin by Western blots, as follows.
Exosome size and concentration assessment by tunable resistive pulse‐sensing (TRPS)
Size ranges and concentrations of isolated exosome fractions were measured using TRPS, as recommended by the system manufacturer (Izon). Immediately before and after each experiment, calibration beads provided in the kit (200 EV, at a 1 : 1 ratio) were tested under the same conditions used for the samples. The measurement details were reported previously 14.
Transmission electron microscopy
Isolated total exosomes were fixed with 4% paraformaldehyde (Electron Microscopy Services, Hatfield, PA, USA) and were placed on a formvar‐coated 300 mesh copper grid (Electron Microscopy Services); after the addition of 50 µl of uranyl‐acetate solution, the exosomes were visualized in a Hitachi H‐7100 transmission electron microscope (TEM; Hitachi High Technologies, Tokyo, Japan), as described previously 14.
Western blot
Western blots were performed as described previously 14. Briefly, exosomes were lysed in Lane Marker Reducing Sample Buffer (Pierce, Thermo Scientific, Waltham, MA, USA), separated on 7–15% sodium dodecyl sulphate‐polyacrylamide gel electrophoresis (SDS/PAGE) gels (Bio‐Rad, Hercules, CA, USA), always applying 10 µg protein/lane, and transferred onto an Immobilon‐P polyvinylidene difluoride (PVDF) membrane (EMD Millipore, Burlington, MA, USA). The membrane was incubated overnight with TSG101 antibody (1 : 500, ab 30871; Abcam, Cambridge, MA, USA). After washing, horseradish peroxidase (HRP)‐conjugated secondary antibody (1 : 5000; Pierce, Thermo Fisher) was added for 1 h at room temperature, and blot was developed with ECL detection reagents (GE Healthcare Biosciences, Piscataway, NJ, USA).
BCA protein assay and exosome concentration
The protein concentration of the isolated exosome fraction #4 was determined using a Pierce BCA protein assay kit (Pierce Biotechnology, Rockford, IL, IDA), according to the manufacturer's instructions. Exosomes were concentrated using Vivaspin 500 (VS0152, 300 000 MWCO; Sartorius, Göttingen, Germany). For fluorescence activated cell sorter (FACS) analyses, 10 μg of protein in 100 μl of PBS were used.
Titrations of anti‐CD3 antibody for exosome capture
The optimal ratio of anti‐CD3 monoclonal antibody (mAb) to exosome protein to beads to be used for capture was determined in preliminary experiments. Exosomes isolated by miniSEC from supernatants of the CD8+ Jurkat cell line were used. Titrations were performed with varying exosome protein concentrations (5, 10, 20 µg) using anti‐CD3 mAb at concentrations ranging from 0·1 to 2·0 μg and different volumes of beads (10–100 µl). Titration results were evaluated by detection flow cytometry, as described below. The reproducibility of the capture method was tested by using exosomes from plasma of three different HNSCC patients for immune capture with anti‐CD3 antibody. Each batch of exosomes was divided into three aliquots. Each of these aliquots was again divided into three parts and used for detection of CD3(+) and CD3(–) exosomes on beads. Intra‐ and interclass correlation coefficients were calculated and were 0·98 with 95% prediction intervals at ±6 and 0·9 with 95% prediction intervals at ±7, respectively. These data were similar to results we reported previously for capture of MTEX 22.
Exosome capture on magnetic beads
Total plasma exosomes in fraction #4 were captured on ExoCap™ streptavidin magnetic beads (MBL International, Woburn, MA, USA). In preliminary titration experiments described above, capture of CD3(+) exosomes was performed. After the optimal ratios of exosome, mAb beads were established, exosomes (10/100 µl PBS in 0·5 ml in Eppendorf microfuge tubes) were co‐incubated with biotin‐labelled anti‐CD3 mAb (clone Hit3a from Biolegend, San Diego, CA, USA), adjusted to a concentration of 1 µg for 2 h at room temperature. Next, a 50‐μl aliquot of beads was added, and the tubes were again incubated for 2 h at room temperature. The uncaptured fraction was removed using a magnet. Samples were washed ×1 with dilution buffer provided by the ExoCap™ kit. The captured bead/anti‐CD3 antibody–exosome complexes were used for antigen detection by on‐bead flow cytometry as described below.
Flow cytometry for detection of surface proteins on exosomes
For flow cytometry‐based detection of antigens carried by exosomes coupled to beads, the method described by Morales‐Kastresana 23 was modified as described previously by us 16.
Staining of exosome‐on‐beads complexes
Exosomes on beads were dispensed into Eppendorf tubes and a fluorochrome‐labelled detection antibody of choice was added to each tube. Exosomes were incubated with antibodies for 30 min at room temperature on a shaker, washed ×3 using a magnet and were resuspended in 300 µl of PBS for antigen detection by flow cytometry. The following antibodies were used for detection: anti‐PD‐L1 phycoerythrin (PE) (12‐5983‐42), anti‐PD‐1 PE (12‐2799‐42) from eBioscience (San Diego, CA, USA), allophycocyanin (APC) (Biolegend 349908), anti‐OX40‐PE (eBioscience 12‐1347‐42), anti‐OX40L‐APC (R&D FAB10541A), anti‐CD15s‐PE (Santa Cruz sc‐32243); labelled isotype control antibodies recommended by each vendor were used in all cases: immunoglobulin (Ig)G1 mouse PE (12‐4714‐81; eBioscience) for anti‐PD‐L1 and anti‐PD‐1, IgG1 mouse allophycocyanin (APC) (400122; Biolegend) for anti‐CTLA‐4, IgG1 mouse PE (12‐4714‐42; eBioscience) for anti‐OX40, IgG1 mouse allophycocyanin (IC002A; R&D) for anti OX40L, IgM mouse PE (sc‐2870; Santa Cruz) for anti‐CD15s.
The non‐captured exosome fraction was recaptured with CD63 biotinylated antibody to place exosomes on beads, as described previously 16 and stained for PD‐1, PD‐L1, CTLA‐4, OX40 and OX40L as described above and also for CD44v3‐PE (R&D FAB5088A).
Staining for COX‐2 in the exosome lumen was performed using CD3(+) and CD3(–) exosome fractions following incubation of the antibody–exosome–bead complexes with 100 µl of Fix/Perm buffer (no. 421403; Biolegend) on a shaker for 40 min. After one wash with Perm buffer, mouse serum was added for 30 min to block non‐specific staining. Permeabilized exosomes on beads were then stained with PE‐labelled anti‐COX‐2 antibody (BD 334090) for 1 h on the shaker in the dark and after washing were evaluated by flow cytometry.
Titrations of antibodies for flow cytometry‐based detection
In preliminary titration experiments, different concentrations of the fluorochrome‐conjugated detection antibodies and isotype control antibodies were used to determine the optimal conditions for staining and detection of the antigens of interest. The isotype control was used in all cases at the same concentration as the test antibody. The antibody concentration that gave the highest separation index between the detection antibody and the isotype control upon flow cytometry was selected for all experiments based on the formula: MFI)1–MFI2/[√(SD1+SD2)].
Flow cytometry
Antigen detection on exosomes was performed immediately after staining using the Gallios flow cytometer equipped with Kaluza version 1.0 software (Beckman Coulter, Krefeld, Germany). Samples were run for 2 min and approximately 10 000 events were acquired. Gates were set on the bead fraction visible in the forward/side light‐scatter.
When exosomes obtained from plasma of HNSCC patients were analysed by flow cytometry, the lower edge of the ‘positive’ gate was set so that 2% of the isotype control was included in this gate [2 standard deviations (s.d.) from the mean of isotype]. As this method detects exosomes bound on beads, the correct way of presenting the data is relative fluorescence intensity [RFI = mean fluorescence intensity (MFI) of stained sample/MFI of isotype control]. This type of analysis defines the staining intensity of the entire population of exosomes captured on beads. In some instances, where separation of total exosomes into discrete fractions upon antibody‐based capture is described, we included the percentages of positive exosome–bead complexes as determined by flow cytometry. As the percentages of positive exosome reflect the relative RFI values, although are not identical to these values, we felt justified to use percentages to denote fractions of captured versus non‐captured exosomes. This was performed to simplify the concept of separating exosomes captured on beads from non‐captured exosomes.
Functional assays
Apoptosis assay in CD8+ cells
Freshly isolated from peripheral blood mononuclear cells (PBMC) primary CD8+ T cells (106/ml) were activated with the CD3/CD28 T cell activator (25 μl/ml; Stemcell, Vancouver, BC, Canada) and interleukin (IL)‐2 (150 IU/ml; PeproTech, Rocky Hill, CT, USA) in freshly prepared RPMI for 16 h. Next, exosomes (50 μl of the whole fraction, CD3(+) or CD3(–) fractions) isolated from plasma of HNSCC patients were added and co‐cultures were incubated for 6 h. Only the CD3(+) fraction was bound on beads. Co‐cultures containing no exosomes (50 μl PBS alone) or anti‐CD3 antibody‐coated beads alone served as negative controls. Apoptosis of CD8+ T cells was measured by flow cytometry using an annexin V assay (Beckman Coulter, Atlanta, GA, USA) and a Galios flow cytometer.
Exosomes carrying the immunoregulatory proteins, as determined by flow cytometry, were divided into the high versus low groups based on the mean values calculated for every marker. Exosomes carrying low or high levels of markers were co‐incubated with activated T cells and apoptosis was measured as described above.
CD39 induction in CD4(+) T cells by patients' exosomes
Freshly isolated, normal human resting CD4(+) T cells (105/100 µl) were co‐incubated with CD3(+) exosomes bound to beads and isolated from HNSCC patients in the presence of 20 μM of exogenous ATP. Samples incubated with no exosomes (PBS only) and without ATP were used as controls. Following incubation for 20 h, anti‐CD4‐PE antibody (Beckman Coulter) and anti‐CD39‐FITC antibody (eBioscience) and appropriate isotype controls were used to determine the percentages of CD4+CD39+ T cells by flow cytometry.
Functional assays with on‐bead exosomes
All functional assays were performed with freshly captured or non‐captured exosomes on beads. These exosomes were not fixed or permeabilized. One lot of captured/non‐captured exosomes was used for detection of markers by flow cytometry and a parallel lot of the same exosomes was used for functional assays. The presence of beads did not interfere with the assays as determined by co‐incubating T cells with beads coated with the capture antibodies alone (data not shown).
Statistics
Statistical analysis was performed using GraphPad Prism version 7 (GraphPad Software, La Jolla, CA, USA). All data were normalized to 1 ml plasma used for exosome isolation by miniSEC. Scatter‐plots depict means and standard error of the mean (s.e.m.). When data are presented as box‐plots, the bar indicates the median, the box shows the interquartile range (25–75%) and the whiskers extend to ×1·5 the interquartile range. The Kruskal–Wallis test was used for group comparisons. Spearman's correlation coefficient was used to identify correlations between groups. The standard error of measurement was used to determine the 95% prediction intervals. The P‐value of < 0·05 was used to evaluate significance of the data.
Results
Clinicopathological characteristics of HNSCC patients
The clinicopathological data for all patents are listed in Table 1. The patients' mean age was 64 years, and they were predominantly male. Anatomical locations of the primary tumours were the oral cavity (36%), the pharynx (32%) and the larynx (32%). Sixteen patients (73%) donated blood at the time of initial diagnosis prior to any therapy. These patients had active disease (AD). Six patients (27%) donated blood after completing curative therapy at the time when they had no evidence of disease (NED), as determined by clinical evaluations. The NED patients were treated with different therapy regimens, as follows: two patients had only surgery and four patients had surgery plus adjuvant radiotherapy. Most patients (77%) presented with an early tumour stage (T1, T2) and 45% had a negative nodal status (N0). Patients with positive nodal status are referred to as N+. No patient had distant metastases (100% M0); 78% were UICC stages I or II and 32% were stages UICC III or IV. The majority of patients had a moderate histological differentiation grade by histopathology; 86% of patients consumed tobacco and/or alcohol (64%) at the time of diagnosis. None of the patients received immune check‐point inhibition immunotherapy.
Characteristics of the plasma‐derived exosomes
Exosomes isolated by size exclusion chromatography from plasma of HNSCC patients met the criteria attributed to exosomes (Supporting information, Fig. S1). They have a size range of 30–150 nm based on TRPS. TEM images showed their vesicular morphology and confirmed the vesicle diameter approaching 100 nm. Western blots of these exosomes indicate the presence of Tsg101, an endocytic marker, in the exosome cargo.
Immunocapture of CD3(+) exosomes
Successful immune capture of CD3(+) exosomes and their separation from the CD3(–) exosome fraction depended upon results of titration experiments in which the ratio optimal for capture of exosomes to anti‐CD3 antibody to beads was determined. The concentrations/volumes that gave the highest percentage of positive exosome–bead complexes and the highest RFI values for CD8(+) and CD63(+) exosomes were found to be 10 μg exosome protein, 1 μg anti‐CD3 mAb and 50 μl of beads (Table 2a). Once these optimal capture conditions for anti‐CD3 mAb were established using Jurkat‐derived exosomes, plasma‐derived exosomes were titrated similarly (Table 2b). The most effective ratio of exosomes/anti‐CD3 antibody/beads for plasma‐derived exosomes was 10 μg exosome protein/1 µg of anti‐CD3 antibody/50 µl of beads. Using these conditions, capture of exosomes with the isotype control antibody gave negative results. These ratios were used in all subsequent experiments. Figure 1 is a flow diagram of the capture method used. To evaluate the efficiency of this exosome capture method, the non‐captured exosome fraction (recovered after the removal of exosome–antibody–bead complexes with a magnet) was recaptured with anti‐CD3, anti‐T cell receptor (TCR) or anti‐CD4/CD8 mAbs. Supporting information, Fig. S2 shows representative flow cytometry data for the captured and uncaptured fractions indicating only minimal positivity for CD3, CD4 or CD8 in the uncaptured fraction. Interestingly, CD3(+) exosomes were found to constitute between 38 and 54% of total exosomes isolated from plasma of HNSCC patients (n = 4).
Table 2.
Titrations of biotinylated anti‐CD3 antibody used for capture of exosomes in supernatants of CD8+ Jurkat cells on streptavidin beads
| (a) Exosomes in supernatants of CD8+ Jurkat cells a | |||||
|---|---|---|---|---|---|
| Volume of beads | |||||
| Antibody dilution |
Exosomes (protein) |
10 µl | 25 µl | 50 µl | 100 µl |
|
Biotinylated anti‐CD3 antibody Detection with anti‐CD63 (RFI/% positive) | |||||
| 1 : 10 (5 µg) | 10 µg | 1·7/95 | 1·4/73 | 2·5/72 | 1·3/79 |
| 1 : 25 (2 µg) | 10 µg | 1·9/65 | 1·2/51 | 1·9/30 | 1·2/32 |
| 1 : 50 (1 µg) | 10 µg | 1·2/25 | 1·2/23 | 2·8/98 | 2·4/95 |
|
Biotinylated anti‐CD3 antibody Detection with anti‐CD8 (RFI/% positive) | |||||
| 1 : 10 (5 µg) | 10 µg | 1·1/10 | 1·2/11 | 2·9/90 | 1·2/19 |
| 1 : 25 (2 µg) | 10 µg | 1·1/17 | 1·2/23 | 1·1/9·6 | 1·3/18 |
| 1 : 50 (1 µg) | 10 µg | 1·1/16 | 1/15 | 2·1/72·6 | 1·3/28 |
| (b) Exosomes in plasma of patients b | ||||
|---|---|---|---|---|
| Detection (RFI/% positive) | ||||
| Antibody dilution |
Exosomes (protein) |
CD3 | CD4 | CD8 |
|
Biotinylated anti‐CD3 antibody CD3 captured fraction |
||||
| 1 : 10 (5 µg) | 10 µg | 2/42·3 | 0·7/65 | 0·9/9 |
| 1 : 50 (1 µg) | 10 µg | 4·7/98 | 2·9/66 | 1·8/36 |
|
Biotinylated anti‐CD63 antibody CD3 uncaptured fraction |
||||
| 1 : 10 (5 µg) | 10 µg | 1·9/87 | 1·8/57 | 1·3/42 |
| 1 : 50 (1 µg) | 10 µg | 1/0·5 | 0·8/1 | 1·1/1·4 |
aThe above titrations were performed to be able to select optimal anti‐CD3 antibody dilution and bead volume (in bold type).
bThe capture conditions defined in Table 2a were used to determine the optimal anti‐CD3 antibody (capture antibody) dilution in exosomes from head and neck squamous cell carcinoma (HNSCC) patients' plasma. Optimal antibody dilution and bead volume marked in bold type.
Figure 1.
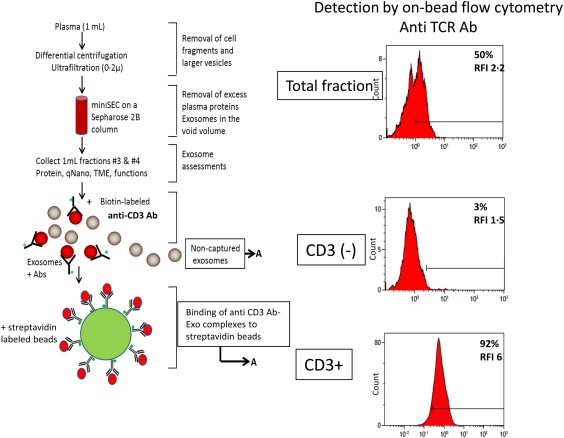
Immune capture of CD3(+) exosomes and detection of the exosome cargo by on‐bead flow cytometry. After exosome isolation from plasma via mini‐size exclusion chromatography (SEC), immune capture with anti‐CD3 biotinylated antibody on beads separated CD3(+) from uncaptured CD3(–) exosomes. Proteins carried by CD3(+) exosomes are detected by on‐bead flow cytometry. Non‐captured CD3(–) exosomes are captured on beads using biotinylated ant‐CD63 antibody for detection. [Colour figure can be viewed at http://wileyonlinelibrary.com]
Distribution and levels of different immunoregulatory proteins on exosomes from plasma of HNSCC patients
Following immunocapture of CD3(+) exosomes in 22 patients with HNSCC, antigenic profiles of CD3(+) as well as CD3(–) exosomes were determined by on‐bead flow cytometry (Table 3). In both fractions, we measured the individual RFI values for exosomes captured on beads that carried immunostimulatory OX40, OX40L or one of immunosuppressive proteins CTLA‐4, PD‐1, PD‐L1, CD15s and COX‐2. In the CD3(–) exosome fraction, recaptured on beads using anti‐CD63 antibody, staining for CD15s was omitted and, instead, staining for CD44v3 was added as a potential marker of HNSCC‐derived exosomes. The percentages of beads carrying exosomes positive for a given marker within all gated beads are also shown in Table 3. Table 3 compares RFI values or percentage of positive beads for each marker in CD3(+) and CD3(–) fractions. It shows that OX40 and PD‐1 levels are significantly higher in CD3(+) exosomes, whereas CD3(–) exosomes are enriched in OX40L. The distribution of PD‐L1 in the two fractions is not significantly different. Figure 2a compares heat‐maps for the distribution of the above‐listed markers in CD3(+) exosomes and CD3(–) exosomes of each patient. The heat‐maps suggest that whenever the levels of immunostimulatory antigens OX40 and OX40L are enriched, the immunoinhibitory antigens appear to be lower and vice versa (Fig. 2). The patients' results for OX40 and OX40L were divided into values high versus low values based on the mean. The data presented in Fig. 2b show a trend towards lower levels of immunosuppressive markers in the OX40/OX40L high group compared to the OX40/OX40L low group. Representative histograms are shown in Supporting information, Fig. S3. CD15s levels on the surface of CD3(+) exosomes, derived presumably from Treg, are highly variable (Table 3).
Table 3.
Comparisons of relative fluorescence intensity (RFI) values or percentages positive beads for each marker in the CD3(+) and CD3(–) fractions *
| CD3+ | CD3– | P‐values | ||||
|---|---|---|---|---|---|---|
| Marker | RFI | % | RFI | % | RFI | % |
| COX‐2 | 1·3 ± 0·4 | 13 ± 10·8 | 1·2 ± 0·2 | 11 ± 7 | 0·96 | 0·8 |
| OX40 | 1·8 ± 0·8 | 45 ± 28 | 1·6 ± 0·9 | 28 ± 17 | 0·35 | 0·03 |
| OX40L | 2·2 ± 0·7 | 44 ± 18 | 2·7 ± 1·3 | 56 ± 20 | 0·047 | 0·029 |
| CTLA‐4 | 0·9 ± 0·3 | 14 ± 19 | 1·3 ± 0·7 | 12 ± 15 | 0·047 | 0·79 |
| CD15s | 3·1 ± 2 | 47 ± 27 | – | – | – | – |
| CD44v3 | – | – | 1·9 ± 0·9 | 29 ± 25 | – | – |
| PD‐L1 | 1·6 ± 1 | 29 ± 30 | 1·8 ± 2 | 27 ± 26 | 0·79 | 0·89 |
| PD‐1 | 3·8 ± 2·7 | 92·7 ± 7·8 | 1·6 ± 0·6 | 47 ± 17 | 0·015 | < 0·0001 |
*The data are means ± standard error of the mean. The P‐values indicate differences in each marker expression levels in exosomes bound on beads [relative fluorescence intensity (RFI) or %]. COX‐2 = cyclo‐oxygenase 2; CTLA‐4 = cytotoxic T lymphocyte antigen‐4; PD‐L1 = programmed death ligand 2. Bold numbers indicate significant difference.
Figure 2.
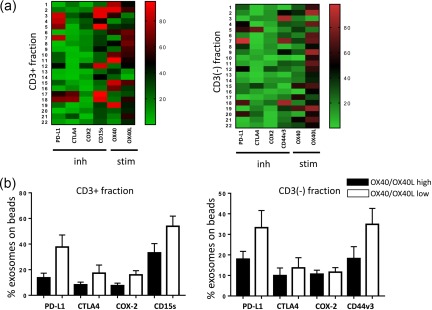
(a) Heat‐maps showing normalized values for positive exosome–bead complexes in each patient. As values for CD15s and OX40 are higher in the CD3(+) than those in the CD3(–) fraction, brighter colours are visible in the CD3(+) heat‐map. Patients with higher levels of inhibitory factors show low expression of stimulatory factors and vice versa. The ‘low’ versus ‘high’ levels of markers were defined by determining the mean values for all patients' exosomes and dividing all results into the < mean or > mean groups. (b) The percentages of positive exosomes on beads carrying low or high levels of OX40/OX40L in CD3(+) and CD3(–) exosome fractions indicate the reverse high/low relationship between the inhibitory and stimulatory exosomal markers. Inh = inhibitory proteins; stim = stimulatory proteins. [Colour figure can be viewed at http://wileyonlinelibrary.com]
Association of immunoregulatory protein levels in exosomes with clinicopathological end‐points
The levels of immunoregulatory proteins carried by CD3(+) or CD3(–) exosomes were examined for potential associations with the clinicopathological data available for all HNSCC patients. Figure 3 shows a significant enrichment in the levels of suppressive markers PD‐L1 and COX‐2 as well as CD15s in CD3(+) exosomes of patients with UICC stages III/IV versus those with the UICC stages I/II disease. In contrast, exosomes of patients with the UICC stages I/II disease were enriched significantly in immunostimulatory OX40 compared to UICC III/IV exosomes. OX40L also showed a trend towards higher levels in UICC I/II patients. In the CD3(–) fraction, CD44v3 and COX‐2 were enriched significantly in exosomes of patients with the high‐stage disease, and a similar trend, although not significant, was seen for PD‐L1 (Fig. 3a,b). Associations of immunoregulatory markers with N0 versus N + 1 disease in HNSCC patients are shown in Fig. 4, and they corroborate associations of immunostimulatory markers with N0 and of immunoinhibitory markers and high CD15s with N +1 disease.
Figure 3.
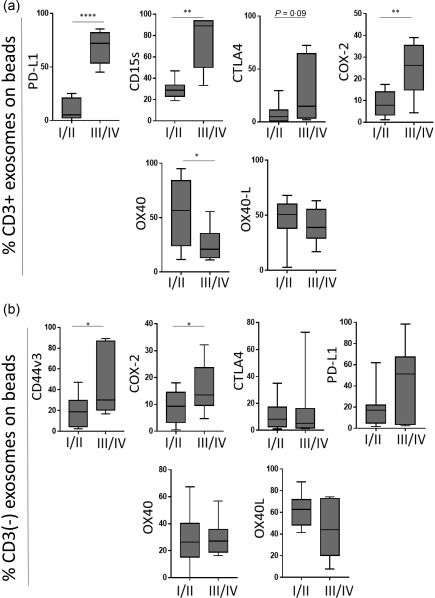
Associations of immunoregulatory protein levels carried on exosomes with clinicopathological end‐points. The data are normalized to 1 ml plasma used for exosome isolation by mini‐size exclusion chromatography (SEC) for each patient; n = 15 for stages I/II and n = 7 for stages III/IV patients. (a) Levels of programmed death ligand 1 (PD‐L1), CD15s, cytotoxic T lymphocyte antigen 4 (CTLA‐4) and cyclooxygenase 2 (COX‐2) are higher in exosomes of head and neck squamous cell carcinoma (HNSCC) patients with UICC III/IV stage disease compared to low‐stage patients (UICC I/II). OX40 is significantly higher in low‐stage patients. (b) Corresponding results are shown for the CD3(–) exosome fraction; *P < 0·05; **P < 0·005; ***P < 0·0001.
Figure 4.
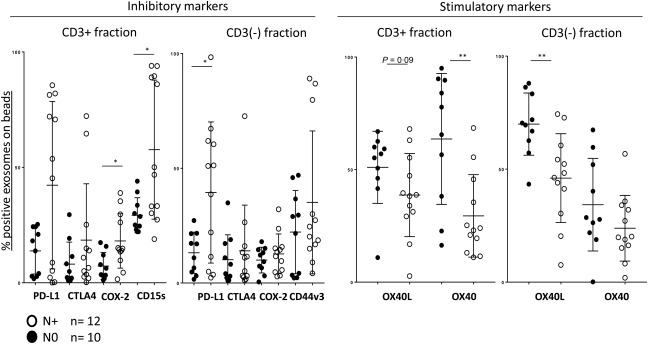
Associations of immunoregulatory proteins carried on exosomes with the lymph node involvement. The data are normalized as explained in the legend to Fig. 3. Higher levels of inhibitory proteins are carried by exosomes of patients with N+ (have lymph node metastasis) than with N0 (no lymph node metastasis). In contrast, exosomes from plasma of N0 patients carry higher levels of stimulatory OX40 and OX40L; *P < 0·05; **P < 0·005.
Levels of immunoregulatory proteins on CD3(+) and CD3(–) exosomes of healthy donors
Levels of the immunosuppressive and immunostimulatory proteins described above were also determined for exosomes of healthy donors in CD3(+) and CD3(–) fractions (Fig. 5). In contrast to exosomes in HNSCC patients, immunoinhibitory proteins, PD‐L1, COX‐2 and SD15S were significantly lower in CD3(+) exosomes as well as CD3(–) exosomes of healthy donors. Thus, CD3(+) and CD3(–) exosomes are enriched in immunoinhibitory proteins in patients with HNSCC compared to healthy donors. However, there was no difference in levels of immunosupportive OX40 or OX40L proteins carried on CD3(+) or CD3(–) exosomes between HNSCC patients and healthy donors. Based on flow cytometry values for immunosuppressive and immunostimulatory proteins on exosomes, we defined favourable and unfavourable protein profiles for CD3(+) and CD3(–) fractions (Supporting information, Fig. S3). The former were enriched in OX40 and OX40L (greater than the median value), did not carry CTLA‐4 or COX‐2 and were only minimally PD‐L1(+) or CD15s(+). The unfavourable profile had low levels of OX40 and OX40L (lower than the median value), but was enriched in PD‐L1, COX‐2, CTLA‐4 and CD15s or CD44v3 (CD3(–) fraction).
Figure 5.
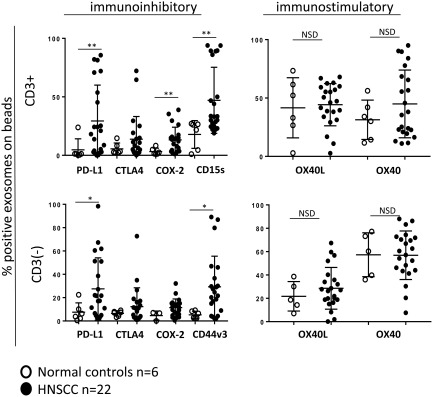
Comparisons of immunoregulatory protein levels in exosomes obtained from plasma of head and neck squamous cell carcinoma (HNSCC) patients versus healthy donors. CD3(+) and CD3(–) exosome fractions isolated from plasma of healthy donors have lower levels of immunoinhibitory proteins compared to exosomes of HNSCC patients. The levels of immunostimulatory proteins are similar in exosomes of healthy donors and HNSCC patients; *P < 0·05; **P < 0·005; n.s.d. = no significant difference.
Induction of apoptosis in CD8+ activated T cells by exosomes carrying immunoinhibitory markers
Co‐incubations of primary activated CD8(+) T cells with either whole exosome fractions, CD3(+) or CD3(–) exosomes defined the ability of these exosomes to induce T cell apoptosis. Prior flow cytometry analysis identified patients with exosomes containing high or low levels of immunoregulatory proteins (see above). We selected exosomes freshly isolated and captured from plasma of patients with low or high levels of immunoregulatory proteins for functional assays. As shown in Fig. 6, exosomes with high levels of PD‐L1, COX‐2, CTLA‐4, CD15s or CD44v3 in all three groups induced apoptosis of activated CD8(+) T cells. In contrast, exosomes carrying low levels of these proteins and high levels of OX40 and OX40L induced little or no apoptosis in activated CD8(+) T cells. Nevertheless, the CD3(–) exosomes with high CD40 and CD40L levels induced some apoptosis compared to the total exosomes (P = 0·036) or CD3(+) exosomes (P = 0·02) (Fig. 6a). It should be noted that the presence of antibody‐coated beads in CD3(+) exosome fractions did not interfere in the functional assays as tested in preliminary experiments (data not shown).
Figure 6.
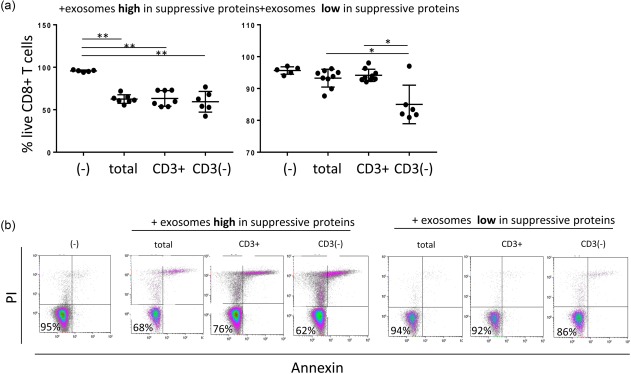
Apoptosis of activated CD8+ T cells co‐incubated with total exosomes, CD3+ or CD3(–) exosome fractions. (a) Exosomes which carry high levels of suppressive proteins induce apoptosis, and the % of live CD8(+) T cells are decreased significantly. In contrast, total exosomes or CD3(+) exosomes carrying low levels of inhibitory proteins do not induce significant apoptosis of CD8(+) T cells. Apoptosis is induced only by exosomes in CD3(–) fraction, which is enriched in tumour‐derived exosomes (TEX). (b) Representative density plots show % surviving CD8(+) T cells after co‐incubation with exosomes; *P < 0·05; **P < 0·005. [Colour figure can be viewed at http://wileyonlinelibrary.com]
Induction of CD39 expression in CD4(+)CD39(+) T cells by exosomes
Our previously reported data showed that exosomes derived from HNSCC cell line supernatants up‐regulated expression of CD39 ectonucleotidase on the surface of CD4(+)CD39(+) T cells and that this up‐regulation translated into elevated adenosine production and stronger suppression 24. To determine whether CD3(+) plasma‐derived exosomes had similar effects on CD4(+)CD39(+) T cells, we co‐incubated isolated resting CD4(+) T cells with total, CD3(+) and CD3(–) exosomes of HNSCC patients. We found that only exosomes carrying high levels of immunoinhibitory proteins up‐regulated CD39 expression levels significantly on CD4(+) T cells, while exosomes with lower levels of these markers and higher levels of OX40 and OX40L did not (Fig. 7).
Figure 7.
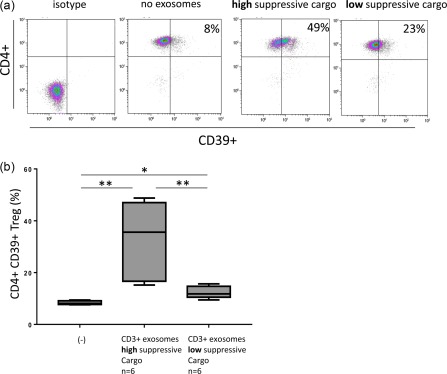
Generation of CD4(+)CD39(+) T cells by co‐incubation of primary CD4(+) T cells with CD3(+) exosomes. (a) Representative density plots showing % CD4(+)CD39(+) T cells in co‐cultures of CD4(+) T cells with exosomes carrying high or low levels of inhibitory proteins. (b) Box‐plots show increased conversion of conventional CD4(+) T cells to CD39(+) T cells upon co‐incubation with CD3(+) exosomes carrying high or low levels of inhibitory proteins; *P < 0·05; **P < 0·005. [Colour figure can be viewed at http://wileyonlinelibrary.com]
Discussion
Exosomes present in plasma or other body fluids are complex mixtures of vesicles derived from many different cells 25. Those derived from parent cells expressing a specific marker, such as TCR or CD3, on T lymphocytes are likely to carry the same protein and can be identified and separated from negative exosomes using immunocapture with antibodies specific for TCR or CD3. This strategy was used by us for separation of T cell‐derived CD3(+) exosomes from CD3(–) exosomes produced by cells other than T lymphocytes, including tumour cells in patients with active malignant disease.
We have shown previously that plasma of patients with HNSCC contains high protein levels of exosomes relative to those seen in healthy donors 14. Further, elevated levels of total plasma exosomes associated with disease activity and high tumour stages in patients with HNSCC 14. While these correlative data are provocative, suggesting a potential role for exosomes as disease biomarkers, they do not identify the parent cells producing these exosomes. Thus, plasma exosomes could be a product of immune cells, normal tissue cells or tumour cells. Using immune‐based capture with melanoma‐specific anti‐CSPG antibodies, we have shown earlier that the ratios of tumour‐derived to normal cell‐derived exosomes can differ broadly for patients with melanoma, and that these ratios are associated with disease progression 22. Here, we used the same strategy successfully for immune capture of T cell‐derived exosomes. The overall aim was to investigate whether T cell‐derived exosomes could serve as biomarkers of changes induced by tumours in TEX‐reprogrammed immune cells.
Surprisingly, we observed that CD3(+) exosomes represented more than 50% of total plasma exosomes in plasma of patients with HNSCC, compared to 20–30% in plasma of healthy donors. This finding suggests that in cancer, immune cell‐derived exosomes account for the majority of the fraction #4 exosomes isolated by size exclusion chromatography from plasma. This finding is consistent with a body of evidence indicating that T cells are chronically activated in patients with cancer and, operating in the TME conditioned by the tumour, are likely to produce an excess of exosomes 8. We reasoned that the molecular cargo of CD3(+) exosomes derived from T cells reprogrammed in vivo by TEX might indicate how competently these T cells mediate anti‐tumour immune functions. This type of information, obtained by examining CD3(+) exosomes in plasma, would allow for estimating a degree of immune activation or immune suppression of the parent T cells.
We have learnt that the cargo of immunoregulatory molecules carried on CD3(+) exosomes reflected the patients' clinicopathological data and correlated to the tumour stage and nodal status. Not surprisingly, we found that HNSCC patients with stages III/IV disease had higher levels of immunosuppressive markers in CD3(+) as well as CD3(–) exosomes compared to patients with stages I/II cancers. Concomitantly, these exosomes carried lower levels of immunosupportive markers such as OX40 and OX40L. While OX40 was highly enriched on CD3(+) exosomes, OX40L was most abundant in CD3(–) exosomes. The exosome levels of OX40 and OX40L associated with favourable clinicopathological parameters, such as the negative nodal status and low UICC stage in patients with HNSCC.
In the CD3(+) fraction, CD15s was used as a marker for highly activated and most suppressive Treg 26. Sakaguchi's group considers CD15s as a selective marker for Treg that is also a reliable marker of suppressor function 26. CD3(+) exosomes of HNSCC patients had a significantly higher content of CD15s compared to healthy donors. Assuming that CD15s(+)CD3(+) exosomes are being produced by Treg, our data are in agreement with reports showing that the content of Treg is higher in HNSCC patients than in healthy donors 27, 28. We also expected that CD3+ exosomes derived from more aggressive HNSCCs, reported to be enriched highly in Treg 29, would release exosomes that carry high levels of CD15s, a relatively selective Treg marker 26. Our study confirms that this is the case, implying that CD3(+)CD15s(+) exosomes derived from Treg may have prognostic significance in HNSCC. Because activities of Treg, as well as effector T cells, are critical for patients' outcome in HNSCC, the immunoregulatory profile of exosomes these T cells produce appears to be useful in decoding the immune signature prevailing in the TME, including peripheral circulation of cancer patients. Thus, CD3(+) exosomes in HNSCC patients' plasma emerge as potentially useful biomarkers of immunological climate in disease.
In contrast to CD3(+) exosomes, which are produced exclusively by T cells, CD3(–) exosomes in plasma of patients with active disease are expected to be enriched in proteins carried by the tumour cells. Recently, CD44v3 has been shown to be a relatively specific marker for various types of cancers, including HNSCC 30, 31. CD44v3 is a variant of CD44, which is created through alternative exon splicing 32. CD44v3 is over‐expressed in many HNSCC, and its expression associates with poor outcome in HNSCC 33, 34. Here, we show that the CD3(–) exosome fraction was enriched for CD44v3(+) TEX, which represented ∼30% of the non‐captured CD3(–) exosome fraction. Further, high levels of CD44v3 protein on CD3(–) exosomes were associated with unfavourable clinicopathological parameters.
Taken together, our data suggest that plasma‐derived exosomes have a promising potential as easily accessible, non‐invasive cancer biomarkers, as reported previously 15, 35. Further, by separating total exosomes into CD3(+) and CD3(–)/CD44v3‐enriched fractions, it is possible to gain insights simultaneously into relative levels and functions of immunoregulatory proteins carried by the exosome subsets derived from different immune and non‐immune cell populations in patients with cancer.
Disclosure
The authors claim no financial or commercial conflicts of interest.
Supporting information
Additional Supporting Information may be found in the online version of this article at the publisher's website:
Fig. S1. Characterization of exosomes. (a) Determination of size by qNano analysis. (b) Visualization by transmission electron microscopy (TEM). (c) Western blot of total exosomes showing TSG101 content, a protein specific for exosomes.
Fig. S2. Representative flow cytometric density plots of the CD3+ and CD3(–) exosomes stained for T cell receptor (TCR), CD3, CD8 or CD4. Results are in % positive exosome–bead complexes and relative fluorescence intensity (RFI) values. The percentages of positive exosomes on beads in the CD3‐negative fraction are lower than 5% for all markers.
Fig. S3. (a) Representative flow cytometry for CD3+ exosomes of a patient with a favourable molecular profile (low levels of suppressive proteins and high levels of immunostimulatory proteins in the upper panel) and another patient with an unfavourable molecular profile (high levels of suppressive proteins and low levels of immunostimulatory proteins in a lower panel). Results are in % positive exosomes on beads and in relative fluorescence intensity (RFI) values. (b) Representative data for CD3(–) exosomes illustrate a favourable and unfavourable molecular profiles. The CD3(–) exosomes are enriched in tumour‐derived exosomes (TEX) and generally have an unfavourable (i.e. suppressive) molecular profile.
Acknowledgements
M.‐N. T. performed all experiments, analysed the data and wrote the manuscript. T. K. H. read and edited the manuscript. T. L. W. designed the study, interpreted results and edited the manuscript. This work has been supported in part by NIH grants RO‐1 CA168628 and R21‐CA204644 to T. L. W. and by the Deutsche Forschungsgemeinschaft to M.‐N. T. (research fellowship no. TH 2172/1‐1).
References
- 1. Hanahan D, Weinberg RA. Hallmarks of cancer: the next generation. Cell 2011; 144:646–74. [DOI] [PubMed] [Google Scholar]
- 2. Ferris RL. Immunology and immunotherapy of head and neck cancer. J Clin Oncol 2015; 33:3293–304. [DOI] [PMC free article] [PubMed] [Google Scholar]
- 3. Whiteside TL, Demaria S, Rodriguez‐Ruiz ME, Zarour HM, Melero I. Emerging opportunities and challenges in cancer immunotherapy. Clin Cancer Res 2016; 22:1845–55. [DOI] [PMC free article] [PubMed] [Google Scholar]
- 4. Whiteside TL. Induced regulatory T cells in inhibitory microenvironments created by cancer. Expert Opin Biol Ther 2014; 14:1411–5. [DOI] [PMC free article] [PubMed] [Google Scholar]
- 5. Ruivo CF, Adem B, Silva M, Melo SA. The biology of cancer exosomes: insights and new perspectives. Cancer Res 2017; 77:6480–8. [DOI] [PubMed] [Google Scholar]
- 6. Hellwinkel JE, Redzic JS, Harland TA, Gunaydin D, Anchordoquy TJ, Graner MW. Glioma‐derived extracellular vesicles selectively suppress immune responses. Neuro Oncol 2016; 18:497–506. [DOI] [PMC free article] [PubMed] [Google Scholar]
- 7. Whiteside TL. Exosomes carrying immunoinhibitory proteins and their role in cancer. Clin Exp Immunol 2017; 189:259–67. [DOI] [PMC free article] [PubMed] [Google Scholar]
- 8. Whiteside TL. The effect of tumor‐derived exosomes on immune regulation and cancer immunotherapy. Future Oncol 2017; 13:2583–92. [DOI] [PMC free article] [PubMed] [Google Scholar]
- 9. Abels ER, Breakefield XO. Introduction to extracellular vesicles: biogenesis, RNA cargo selection, content, release, and uptake. Cell Mol Neurobiol 2016; 36:301–12. [DOI] [PMC free article] [PubMed] [Google Scholar]
- 10. Colombo M, Moita C, van Niel G et al Analysis of ESCRT functions in exosome biogenesis, composition and secretion highlights the heterogeneity of extracellular vesicles. J Cell Sci 2013; 126:5553–65. [DOI] [PubMed] [Google Scholar]
- 11. Zhang HG, Grizzle WE. Exosomes: a novel pathway of local and distant intercellular communication that facilitates the growth and metastasis of neoplastic lesions. Am J Pathol 2014; 184:28–41. [DOI] [PMC free article] [PubMed] [Google Scholar]
- 12. Lobb RJ, Becker M, Wen SW et al Optimized exosome isolation protocol for cell culture supernatant and human plasma. J Extracell Vesicles 2015; 4:27031. [DOI] [PMC free article] [PubMed] [Google Scholar]
- 13. Hong CS, Funk S, Muller L, Boyiadzis M, Whiteside TL. Isolation of biologically active and morphologically intact exosomes from plasma of patients with cancer. J Extracell Vesicles 2016; 5:29289. [DOI] [PMC free article] [PubMed] [Google Scholar]
- 14. Ludwig S, Floros T, Theodoraki MN et al Suppression of lymphocyte functions by plasma exosomes correlates with disease activity in patients with head and neck cancer. Clin Cancer Res 2017; 23:4843–54. [DOI] [PMC free article] [PubMed] [Google Scholar]
- 15. Peinado H, Aleckovic M, Lavotshkin S et al Melanoma exosomes educate bone marrow progenitor cells toward a pro‐metastatic phenotype through MET. Nat Med 2012; 18:883–91. [DOI] [PMC free article] [PubMed] [Google Scholar]
- 16. Theodoraki MN, Yerneni SS, Hoffman TK, Gooding WE, Whiteside TL. Clinical significance of PD‐L1+ exosomes in plasma of head and neck cancer patients. Clin Cancer Res 2017; 24:896–905. [DOI] [PMC free article] [PubMed] [Google Scholar]
- 17. Fujita T, Ukyo N, Hori T, Uchiyama T. Functional characterization of OX40 expressed on human CD8+ T cells. Immunol Lett 2006; 106:27–33. [DOI] [PubMed] [Google Scholar]
- 18. Kluger HM, Zito CR, Turcu G et al PD‐L1 studies across tumor types, its differential expression and predictive value in patients treated with immune checkpoint inhibitors. Clin Cancer Res 2017; 23:4270–9. [DOI] [PMC free article] [PubMed] [Google Scholar]
- 19. Ceeraz S, Nowak EC, Noelle RJ. B7 family checkpoint regulators in immune regulation and disease. Trends Immunol 2013; 34:556–63. [DOI] [PMC free article] [PubMed] [Google Scholar]
- 20. Lai C, August S, Albibas A et al OX40+ regulatory T cells in cutaneous squamous cell carcinoma suppress effector T‐cell responses and associate with metastatic potential. Clin Cancer Res 2016; 22:4236–48. [DOI] [PMC free article] [PubMed] [Google Scholar]
- 21. Ishii N, Takahashi T, Soroosh P, Sugamura K. OX40‐OX40 ligand interaction in T‐cell‐mediated immunity and immunopathology. Adv Immunol 2010; 105:63–98. [DOI] [PubMed] [Google Scholar]
- 22. Sharma P, Ludwig S, Muller L et al Immunoaffinity‐based isolation of melanoma cell‐derived exosomes from plasma of patients with melanoma. J Extracell Vesicles 2018; https://doi.org/10.1080/20013078.2018.1435138 [DOI] [PMC free article] [PubMed] [Google Scholar]
- 23. Morales‐Kastresana A, Jones JC. Flow cytometric analysis of extracellular vesicles. Methods Mol Biol 2017; 1545:215–25. [DOI] [PMC free article] [PubMed] [Google Scholar]
- 24. Muller L, Mitsuhashi M, Simms P, Gooding WE, Whiteside TL. Tumor‐derived exosomes regulate expression of immune function‐related genes in human T cell subsets. Sci Rep 2016; 6:20254. [DOI] [PMC free article] [PubMed] [Google Scholar]
- 25. Whiteside TL. Tumor‐derived exosomes and their role in cancer progression. Adv Clin Chem 2016; 74:103–41. [DOI] [PMC free article] [PubMed] [Google Scholar]
- 26. Miyara M, Chader D, Sage E et al Sialyl Lewis x (CD15s) identifies highly differentiated and most suppressive FOXP3high regulatory T cells in humans. Proc Natl Acad Sci USA 2015; 112:7225–30. [DOI] [PMC free article] [PubMed] [Google Scholar]
- 27. Schuler PJ, Harasymczuk M, Schilling B et al Effects of adjuvant chemoradiotherapy on the frequency and function of regulatory T cells in patients with head and neck cancer. Clin Cancer Res 2013; 19:6585–96. [DOI] [PMC free article] [PubMed] [Google Scholar]
- 28. Jie HB, Gildener‐Leapman N, Li J et al Intratumoral regulatory T cells upregulate immunosuppressive molecules in head and neck cancer patients. Br J Cancer 2013; 109:2629–35. [DOI] [PMC free article] [PubMed] [Google Scholar]
- 29. Schuler PJ, Saze Z, Hong CS et al Human CD4(+) CD39(+) regulatory T cells produce adenosine upon co‐expression of surface CD73 or contact with CD73(+) exosomes or CD73(+) cells. Clin Exp Immunol 2014; 177:531–43. [DOI] [PMC free article] [PubMed] [Google Scholar]
- 30. Wang SJ, Wreesmann VB, Bourguignon LY. Association of CD44 V3‐containing isoforms with tumor cell growth, migration, matrix metalloproteinase expression, and lymph node metastasis in head and neck cancer. Head Neck 2007; 29:550–8. [DOI] [PubMed] [Google Scholar]
- 31. Pacifico MD, Grover R, Richman PI, Daley FM, Buffa F, Wilson GD. CD44v3 levels in primary cutaneous melanoma are predictive of prognosis: assessment by the use of tissue microarray. Int J Cancer 2006; 118:1460–4. [DOI] [PubMed] [Google Scholar]
- 32. Turley EA, Noble PW, Bourguignon LY. Signaling properties of hyaluronan receptors. J Biol Chem 2002; 277:4589–92. [DOI] [PubMed] [Google Scholar]
- 33. Todoroki K, Ogasawara S, Akiba J et al CD44v3+/CD24‐ cells possess cancer stem cell‐like properties in human oral squamous cell carcinoma. Int J Oncol 2016; 48:99–109. [DOI] [PMC free article] [PubMed] [Google Scholar]
- 34. Franzmann EJ, Weed DT, Civantos FJ, Goodwin WJ, Bourguignon LY. A novel CD44 v3 isoform is involved in head and neck squamous cell carcinoma progression. Otolaryngol Head Neck Surg 2001; 124:426–32. [DOI] [PubMed] [Google Scholar]
- 35. Melo SA, Luecke LB, Kahlert C et al Glypican‐1 identifies cancer exosomes and detects early pancreatic cancer. Nature 2015; 523:177–82. [DOI] [PMC free article] [PubMed] [Google Scholar]
Associated Data
This section collects any data citations, data availability statements, or supplementary materials included in this article.
Supplementary Materials
Additional Supporting Information may be found in the online version of this article at the publisher's website:
Fig. S1. Characterization of exosomes. (a) Determination of size by qNano analysis. (b) Visualization by transmission electron microscopy (TEM). (c) Western blot of total exosomes showing TSG101 content, a protein specific for exosomes.
Fig. S2. Representative flow cytometric density plots of the CD3+ and CD3(–) exosomes stained for T cell receptor (TCR), CD3, CD8 or CD4. Results are in % positive exosome–bead complexes and relative fluorescence intensity (RFI) values. The percentages of positive exosomes on beads in the CD3‐negative fraction are lower than 5% for all markers.
Fig. S3. (a) Representative flow cytometry for CD3+ exosomes of a patient with a favourable molecular profile (low levels of suppressive proteins and high levels of immunostimulatory proteins in the upper panel) and another patient with an unfavourable molecular profile (high levels of suppressive proteins and low levels of immunostimulatory proteins in a lower panel). Results are in % positive exosomes on beads and in relative fluorescence intensity (RFI) values. (b) Representative data for CD3(–) exosomes illustrate a favourable and unfavourable molecular profiles. The CD3(–) exosomes are enriched in tumour‐derived exosomes (TEX) and generally have an unfavourable (i.e. suppressive) molecular profile.