ABSTRACT
Background: Chemotherapy is currently evaluated in order to enhance the efficacy of immune checkpoint blockade (ICB) therapy in colorectal cancer. However, the mechanisms by which these drugs could synergize with ICB remains unclear. The impact of chemotherapy on the PD-1/PD-L1 pathway and the resulting anticancer immune responses was assessed in two mouse models of colorectal cancer and validated in tumor samples from metastatic colorectal cancer patients that received neoadjuvant treatment. We demonstrated that 5-Fluorouracil plus Oxaliplatin (Folfox) drove complete tumor cure in mice when combined to anti-PD-1 treatment, while each monotherapy failed. This synergistic effect relies on the ability of Folfox to induce tumor infiltration by activated PD-1+ CD8 T cells in a T-bet dependent manner. This effect was concomitantly associated to the expression of PD-L1 on tumor cells driven by IFN-γ secreted by PD-1+ CD8 T cells, indicating that Folfox triggers tumor adaptive immune resistance. Finally, we observed an induction of PD-L1 expression and high CD8 T cell infiltration in the tumor microenvironment of colorectal cancer patients treated by Folfox regimen. Our study delineates a molecular pathway involved in Folfox-induced adaptive immune resistance in colorectal cancer. The results strongly support the use of immune checkpoint blockade therapy in combination with chemotherapies like Folfox.
KEYWORDS: chemotherapy; colorectal cancer, adaptive immune resistance; PD-1/PD-L1 pathway; immunotherapy; CD8 T cells
Introduction
Colorectal cancer (CRC) is one of the most common and aggressive cancer despite decades of research advances. Although not given with a curative intent, combined chemotherapies such as 5-Fluorouracil plus Oxaliplatin (Folfox) are routinely used as first-line treatment for advanced CRC.1,2 However, the appearance of acquired pharmacological resistances to these therapies in most patients limits their antitumor effect, leading to tumor escape.
Evidence supports the importance of the immune cell infiltrate in the prognosis of CRC. During the past two years several studies conducted in many cancers brought to light the tremendous clinical efficacy of immunotherapies targeting immune checkpoints such as the inhibitory molecule PD-1 (programmed cell death-1) or its ligand PD-L1.3,4 However in CRC the majority of patients, especially microsatellite stable (MSS) tumors, do not respond to these treatments.3,5,6 Recent literature highlights a range of factors such as the intratumoral immune contexture that is involved in the heterogeneous responses and failures of immune checkpoint blockade (ICB).7,8 Indeed, patients with high pre-existing CD8 T cell infiltrate in the tumor microenvironment (TME) are more responsive to such immunotherapies.3,9,10 Thus, in a clinical context, a desirable outcome would be to reinstate a suitable immunological environment to sensitize colorectal tumors to immune checkpoint inhibitors. For this, an approach is to combine them with other treatments that stimulate T cell immunity like chemotherapeutic agents.11,12 Studies in preclinical models indeed suggest that some chemotherapies can improve the anticancer efficacy of ICB.13
Some cytotoxic drugs have immunogenic properties that can promote the activation of the immune system.12,14,15 Indeed, 5-Fluorouracil (5-FU) was shown to selectively deplete Myeloid-derived Suppressor Cells (MDSCs) in vivo,16 while Oxaliplatin can trigger an immunogenic form of tumor cell death (ICD) through cell surface exposure of calreticulin (CRT), HMGB1 and ATP release.15,17 These processes can contribute to the induction of CD8 T cell antitumor immunity and therefore act to re-establish the cancer-immunity cycle described by Chen and Mellman.18 It also justifies the current clinical evaluation of Folfox in combination with immune checkpoint inhibitors in colorectal cancer. However, the molecular mechanisms by which chemotherapy could sensitize tumors to immunotherapy are still elusive.
Here, we report in mouse colorectal cancer models that Folfox induces complete tumor cure when combined with anti-PD1 therapy. We demonstrate that Folfox promotes in the TME the expression of both PD-1 on activated CD8 T cells and PD-L1 on tumor cells, thereby driving tumor adaptive immune resistance. Our findings thus indicate that the blockade of the PD-1/PD-L1 pathway prevents the adaptive immune resistance induced by Folfox in colorectal cancers.
Results
Folfox combined with anti-PD-1 therapy induces complete colorectal tumor cure
We tested the ability of chemotherapeutics commonly used to treat human colorectal cancer to potentiate anti-PD-1 therapy. To this end, CT26 colorectal tumor-bearing Balb/c mice were treated with cytotoxic drugs in combination or not with anti-PD1 therapy. These drugs were administrated as monotherapy (5-Fluorouracil, 5-FU; Mitomycin C, MMC; or Oxaliplatin, OX) or in combination 5-FU plus MMC (5-FU/MMC) or 5-FU plus OX (Folfox). Contrary to OX and MMC monotherapies, 5-FU, 5-FU/MMC and Folfox regimens promoted a slight delay of tumor growth before tumor relapse (Fig. 1A). Importantly, in combination with anti-PD-1 therapy, Folfox was the only treatment that led to complete and long-lasting cancer cure (Fig. 1A,B). Data of pooled experiments are represented in Fig. 1C.
Figure 1.
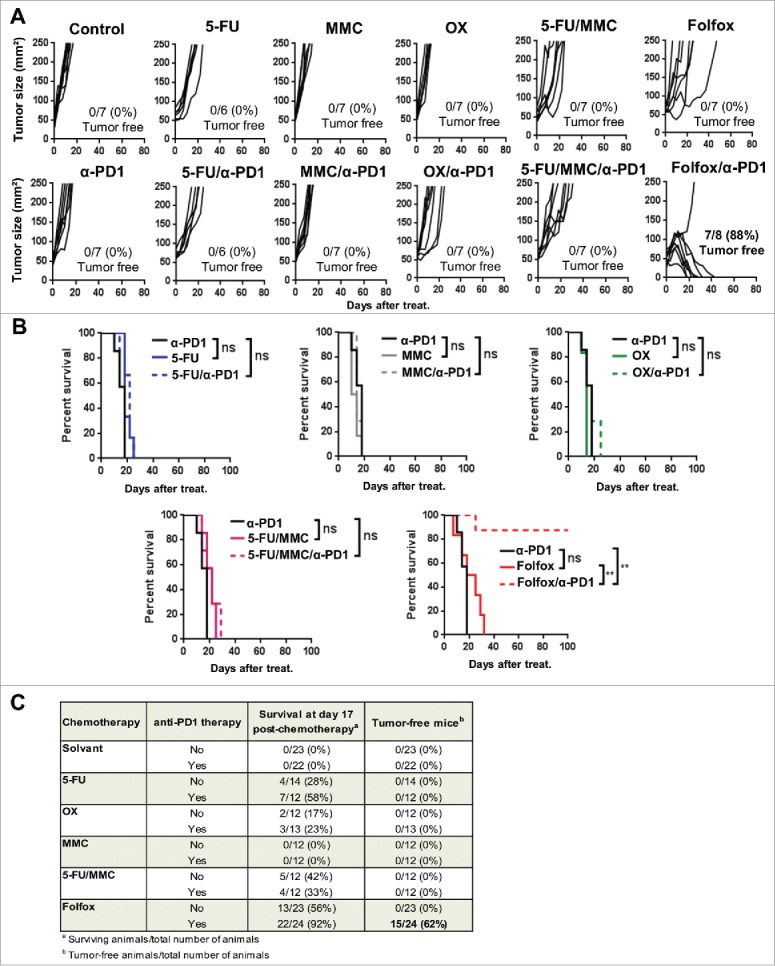
Addition of Folfox to anti-PD-1 therapy promotes complete tumor regressions. CT26 tumor-bearing Balb/c mice (n = 6-8/group) were treated with a single injection of Glucose 5% (control), 5-Fluorouracil (5-FU), Mitomycin C (MMC), Oxaliplatin (OX), 5-FU plus MMC (5-FU/MMC) or 5-FU plus OX (Folfox) combined or not with anti-PD-1 therapy. (A) Tumor growth. Each line represents an individual mouse. (B) Survival (Log-rank test). (C) Results of all experiments performed in the same conditions were analyzed and pooled (three experiments for control, anti-PD-1, Folfox and Folfox/anti-PD1 groups; two for the other groups). Number of survivors 17 day post-chemotherapy and number of tumor-free mice among total are indicated. **p < 0.001; ns, not significant. Data are representative (A,B) or pooled (C) of 2 to 3 independent experiments. See also Supplementary Fig. 1.
Similar results were also observed in C57BL/6 mice bearing MC38 colon tumors (Supplementary Fig. 1A and B). In addition, we did not observe any cancer recurrence in Folfox/anti-PD-1 cured mice and those animals were still protected against a CT26 tumor rechallenge but not against the control 4T1 mammary adenocarcinoma tumor (Supplementary Fig. 1C). These data strongly suggest that Folfox administration creates a suitable TME that renders colorectal tumors sensitive to PD-1 blockade in vivo.
Folfox induces functional PD-1+ CD8 TILs in the tumor microenvironment
Next, we evaluated the effect of Folfox on immune cells within the tumor bed. Because 5-FU selectively eliminates immunosuppressive Myeloid-derived suppressor cells (MDSCs) in vivo,16 we first investigated whether Folfox induced MDSC depletion. We found that, like 5-FU, Folfox induced MDSC depletion in vivo and had no effect on regulatory T cells (Tregs) (Supplementary Fig. 2). Thus the ability of Folfox to deplete MDSCs is not sufficient to explain the robust tumor regression when combined with anti-PD1 therapy (Fig. 1).
Figure 2.
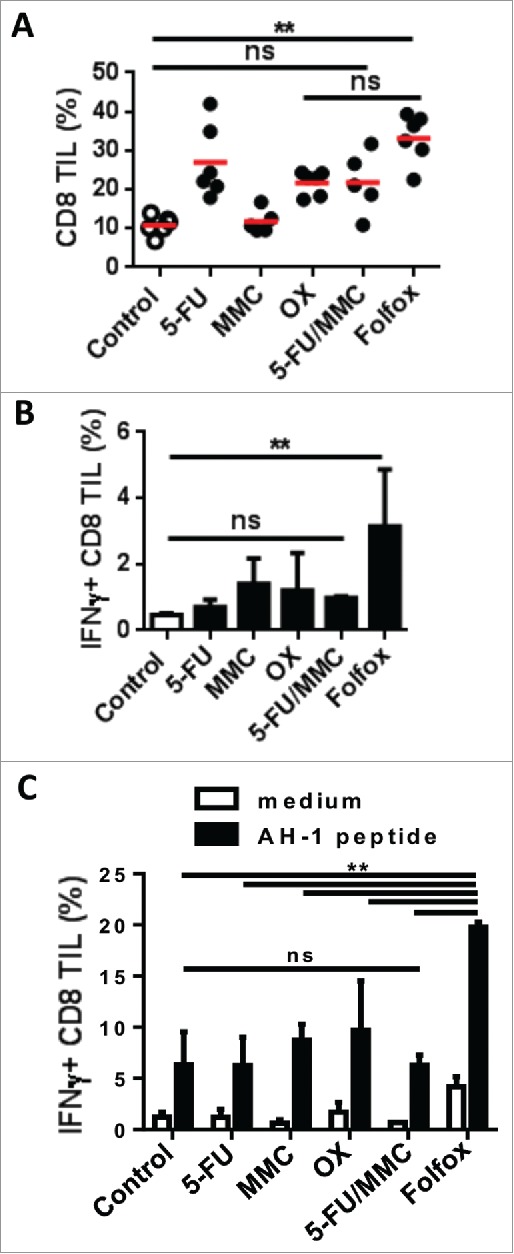
Chemotherapies differently modulate CD8 T cell function in the tumor.
CT26 tumor-bearing mice were treated with different chemotherapies. Tumors were harvested 8 days after treatment (n = 3-4/group). (A) Frequency of CD8 TILs measured by flow cytometry (Kruskal-Wallis test). (B) IFNɣ secreted by CD8 TILs ex vivo (Kruskal-Wallis test). (C) IFNɣ-expressing CD8 TILs in response to AH-1/H-2Ld tumor peptide (Mean±s.d., Sidak test). **p < 0.01; ns, not significant. Data are representative of two independent experiments. See also Supplementary Figs. 2 and 3.
By analyzing tumor-infiltrating lymphocytes (TILs), we found that chemotherapies led to variable levels of CD8 T cell infiltrate in tumors. Except for MMC, Folfox and other chemotherapies led to an increase of CD8 TILs compared to untreated control (Fig. 2A). But unlike other treatments, Folfox induced strong levels of IFNɣ-producing CD8 TILs both ex vivo and in response to AH-1/H2-Ld peptide expressed by CT26 tumor cells (Fig. 2B,C and Supplementary Fig. 3).
Figure 3.
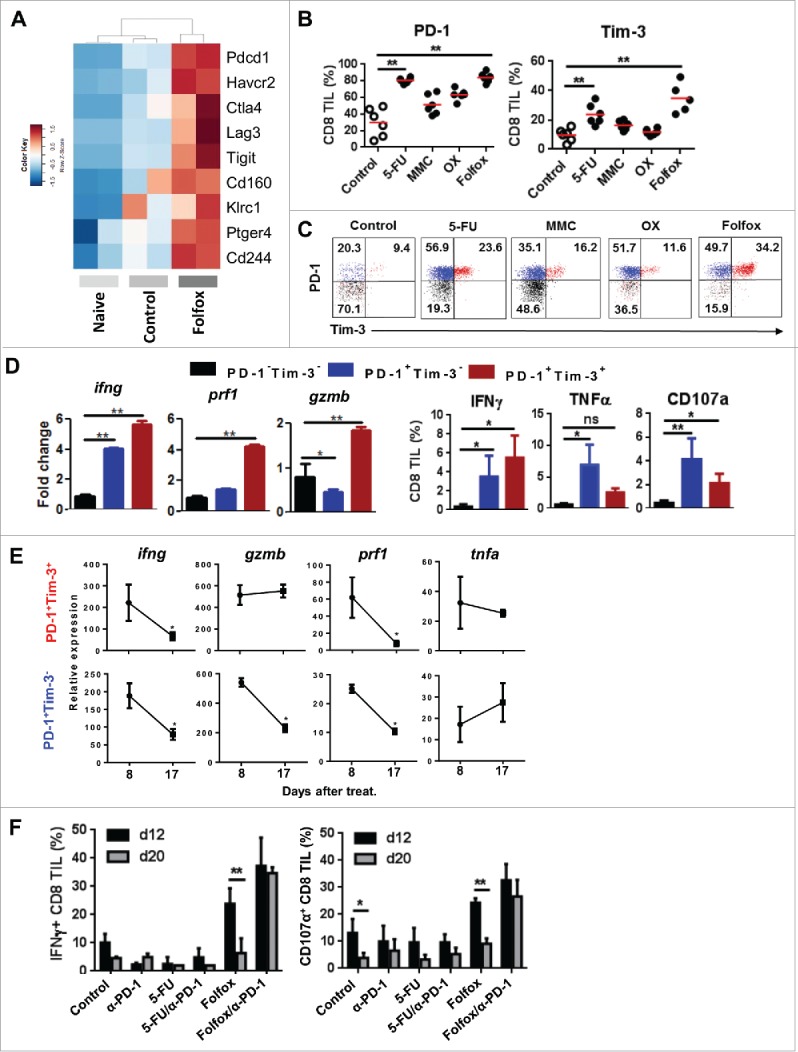
Folfox favors the infiltration of tumors by functional PD-1+ CD8 T cells. (A) CT26 tumor-bearing mice were treated with glucose 5% (control) or Folfox. FACS-sorted CD8 TILs were pooled (n = 10/group) and subjected to RNA-sequencing. Naïve CD8 T cells were used as reference. Heatmap of expression of genes associated with inhibitory receptors is shown (two samples per condition). (B-C) CT26 tumor-bearing Balb/c mice (n = 6/group) were treated with the different chemotherapies. (B) Frequency of PD-1 and Tim-3 was determined by flow cytometry (Kruskal-Wallis test). (C) Representative dot plot of PD-1 and Tim-3 expression on CD8 TILs. (D) Percoll-isolated TILs were harvested from Folfox-treated mice. (Left) CD8 TILs (n = 4) were FACS-sorted according to PD-1 and Tim-3 expression. mRNA IFNγ (ifng), Perforin (prf1) and Granzyme B (gzmB) expression was measured in each subset by RT-PCR. β-Actin was used as reference (Mean ± s.d of experimental replicates, Kruskal-Wallis test). (Right) Frequency of IFNγ, TNF-α, and CD107a produced by CD8 TILs after anti-CD3 stimulation (Mean ± s.d, Kruskal-Wallis test). (E) CD8 TILs were FACS-sorted according to PD-1 and Tim-3 expression. Relative mRNA expression to actin of IFNγ (ifng), Perforin (prf1), Granzyme B (gzmB) and TNF-a (tnfa) by RT-PCR at day 8 and day 17 post-treatment (Mean ± s.d. of experimental replicates, Mann-Whitney test). (F) CT26 tumor-bearing Balb/c mice (n = 3-4/group) were treated with glucose 5% (control) or Folfox combined or not with anti-PD1 therapy. IFNɣ and CD107 a produced by CD8 TIL 12 and 20 days after treatment (Mean ± s.d.,Sidak test). **p < 0.01; ns, not significant. Data are representative of one (A), two (E,F) or at least three (B-D) independent experiments. See also Supplementary Figs. 4 and 5.
Using RNA-sequencing, we found that CD8 TILs from Folfox-treated mice have increased expression by more than 3-fold of genes encoding inhibitory receptors such as PD-1 (Pdcd1), Tim-3 (Havcr2), CTLA-4 (Ctla4), LAG3 (Lag3), TIGIT (Tigit) and NKG2A (Klrc1) (Fig. 3A). The cell surface analysis of PD-1 and Tim-3, the two main inhibitory receptors commonly used to characterize exhausted T cells,19,20 was performed in tumor-bearing mice treated by chemotherapy. As shown in Fig. 3B, we observed that chemotherapies induced variable levels of PD-1 and Tim-3 expression on CD8 TILs compared to control. Interestingly, CD8 TILs co-expressing PD-1 and Tim-3 thought to be dysfunctional cells were particularly present in the groups of mice treated with Folfox (∼34%) or 5-FU (∼24%) as compared to OX (∼12%)(Fig. 3C). Of note, the expression of PD-1 and Tim-3 on CD8 T cells was restricted to the tumor site as no induction of these two receptors was found in the spleen or tumor-draining lymph nodes of the treated mice (data not shown). Similar results were found in C57BL/6 mice bearing MC38 colon tumors (Supplementary Fig. 4).
Figure 4.
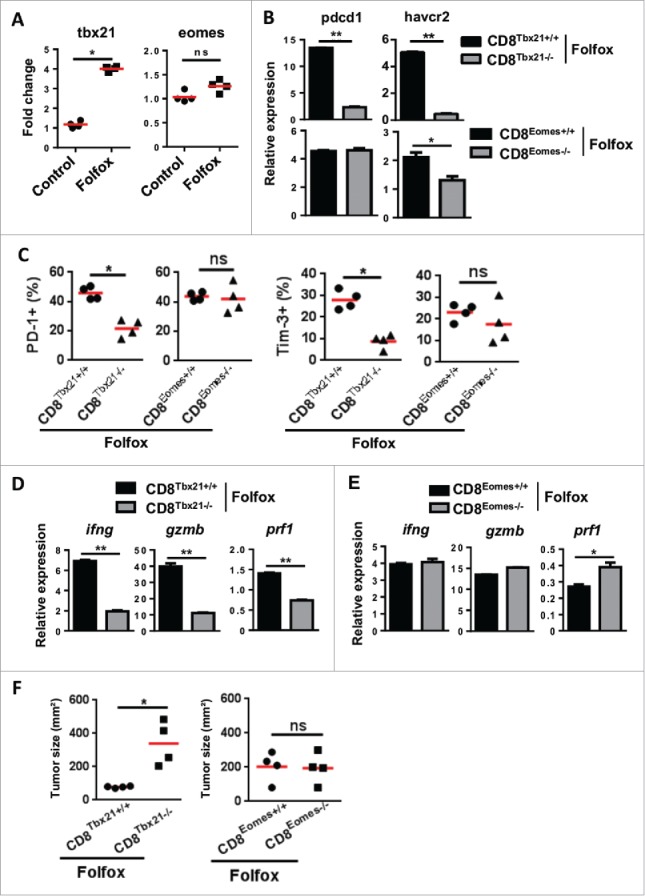
T-bet drives the induction of functional CD8 TILs after Folfox therapy. (A) CT26 tumor-bearing mice were treated with Folfox (n = 4/group) and FACS-sorted CD8 TILs were pooled. T-bet (Tbx21) and Eomes (Eomes) mRNA expression was assessed by RT-PCR. β-Actin was used as reference and data were normalized to control (Mean ± s.d of four experimental replicates, Mann-Whitney test). (B-F) MC38 tumor-bearing C57BL/6 mice deficient in CD8 T cells for Tbx21 (CD8Tbet−/−), Eomes (CD8Eomes−/−) and their respective control mice CD8Tbet+/+ or CD8Eomes+/+ were treated with Folfox (n = 4/group). (B) CD8+ TILs from each group were FACS-sorted then pooled and the relative expressions of PD-1 (Pdcd1) and Tim-3 (Havcr2) mRNA were analyzed by RT-PCR. β-Actin was used as reference (Mean ± s.d. of technical replicates, Mann-Whitney test). (C) Expression of PD-1 (left) and Tim-3 (right) on CD8 TILs by flow cytometry. Each dot represents one individual (Mann-Whitney test). (D-E) Relative mRNA expression of IFNγ (Ifng), Perforin (Prf1) and Granzyme B (Gzmb) in FACS-sorted CD8 TILs from controls and (D) CD8Tbet−/− and (E) CD8Eomes−/− mice. β-Actin was used as reference (Mean ± s.d. of technical replicates, Mann-Whitney test). (F) Tumor growth measured 8 days following treatment. Each dot represents one individual (n = 4/group, Mann-Whitney test). *p < 0.05; **p < 0.01; ns, not significant. Data are representative of two independent experiments. See also Supplementary Fig. 6.
Because Folfox promotes high levels of PD-1+Tim-3+ CD8 TILs, we asked for the functionality of these cells. To this end, we sorted CD8 TILs from Folfox-treated CT26 tumor-bearing mice according to PD-1 and Tim-3 expression and studied their respective functions. Quantitative RT-PCR indicated that PD-1+Tim-3− and PD-1+Tim-3+ cells featured high expression of genes encoding immune effector factors such as IFNγ (Ifng), Granzyme B (GrzmB) or Perforin (Prf1) compared to PD-1− and Tim-3− negative cells (Fig. 3D). In addition, more than 85% of CD8 TILs from Folfox or control mice were CD44hiCD62Llow, which is consistent with an effector memory phenotype (data not shown).21
Additionally, a kinetic analysis revealed that the frequency of PD-1+ CD8 TILs from Folfox-treated mice gradually decreased overtime along with their effector functions, suggesting that inhibitory signals drove their dysfunction (Fig. 3E and Supplementary Fig. 5A,B). Consequently, adding anti-PD1 blocking antibody to Folfox in vivo prevents this CD8 T cell dysfunction and ensured a sustained antitumor response (Fig. 3F). By contrast, anti-PD-1 therapy was not able to unleash or increase the antitumor activity of CD8 TILs from 5-FU-treated mice (Fig. 3F). These results indicate that Folfox favors the early infiltration of tumors by functional PD-1+ CD8 T cells, a parameter which seems to be required to its synergistic effect with anti-PD1 therapy in vivo.
Figure 5.
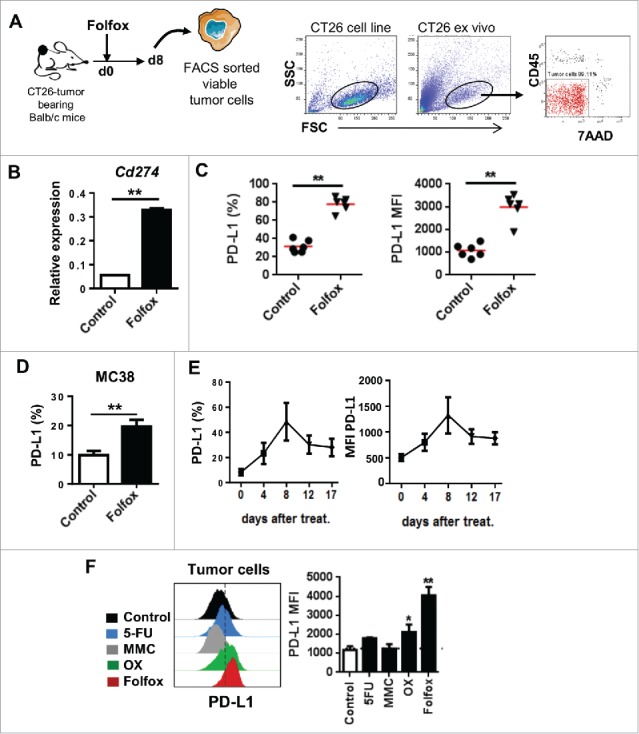
Folfox induces PD-L1 expression on tumor cells in vivo. (A-C) CT26-tumor bearing mice were treated either with glucose 5% (control) or Folfox and tumors were harvested 8 days after treatment. (A) Scheme of the experiment and gating process to isolate viable tumor cells (CD45/7AAD-negative) by FACS (See also Materials and Methods). (B) Relative expression level of PD-L1 (Cd274) mRNA analyzed by RT-PCR. β-Actin was used as reference (n = 3/group, mean ± s.d., Mann-Whitney test). (C) Expression of PD-L1 determined by flow cytometry on viable tumor cells (n = 6/group, each dot represents one individual, Mann-Whitney test). (D) MC38 tumor-bearing C57BL/6 mice were treated with glucose 5% (control) or Folfox (n = 3/group). Expression of PD-L1 on viable tumor cells by flow cytometry 8 days after treatment (Mean ± s.d, Mann-Whitney test). (E) Monitoring of PD-L1 expression on viable tumor cells from Folfox-treated mice over seventeen days post-treatment (n = 4/group, mean ± s.d.). (F) CT26-tumor bearing Balb/c mice were treated as in Fig. 2C (n = 5/group). Expression of PD-L1 on viable tumor cells by flow cytometry 8 days after treatment is shown. Dashed line delineates the FMO control (Mean ± s.d.,Kruskal-Wallis test). Data are representative of 2 experiments (B, D-F) or more than 4 independent experiments (C). *p < 0.05, **p < 0.01. See also Supplementary Fig. 7.
T-bet drives PD-1+ expression on functional tumor-infiltrating CD8 T cells elicited by Folfox
We next searched for the molecular mechanism that controls the Folfox-induced PD-1+ CD8 TILs effector function. We focused our investigation towards two transcription factors, T-bet and Eomes, involved in CD8 T cell effector and memory differentiation.22-24 Compared to untreated or 5-FU-treated mice, higher level of T-bet (Tbx21) mRNA was detected in CD8 TILs from Folfox treated-mice (Fig. 4A and Supplementary Fig. 6A). This induction of T-bet by Folfox was especially found in PD-1+ CD8 T cells (Supplementary Fig. 6B). In contrast, the expression of Eomes (Eomes) on CD8 T cells remained globally unaltered (Fig. 4A and Supplementary Fig. 6A).
Figure 6.
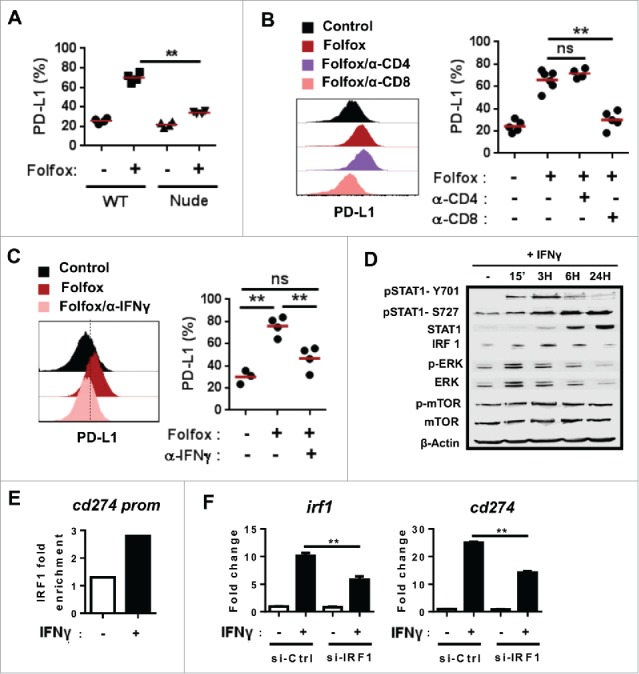
PD-L1 tumor expression upon Folfox chemotherapy is driven by IFNγ produced by CD8 T cells. (A) CT26 tumor-bearing immunocompetent Balb/c or immunodeficient Nude Balb/c mice were treated with glucose 5% (control) or Folfox (n = 4/group). Expression of PD-L1 determined by flow cytometry on viable tumor cells 8 days after treatment (Kruskal-Wallis test). (B-C) CT26 tumor-bearing mice (n = 5-6/group) were treated with Folfox with or without (B) anti-CD4 or anti-CD8 depleting antibodies or (C) anti-IFNγ antibody. PD-L1 expression on tumor cells 8 days after treatment (Kruskal-Wallis test). (D-F) CT26 tumor cells were cultured with or without recombinant mouse IFNγ (10 ng/mL). (D) Kinetic analysis of indicated proteins by Western Blot. β-actin was used as control. (E) ChIP analysis of the binding of IRF1 to the putative binding site −344 of the Cd274 (PD-L1) promoter. (F) CT26 tumor cells were transfected with siRNA IRF1 or siRNA control then cultured with or without IFNγ for 24 H. Relative expression level of Irf1 and Cd274 to untreated siRNA control-transfected cells is shown. β-Actin was used as the internal control and data were normalized to untreated siRNA control (Mean ± s.d. of technical replicates, one-way anova test).**p < 0.01; ns, not significant. Data are representative of two independent experiments.
To explore the role of T-bet, we used T-betfl/fl CD4-Cre mice (Tbx21 floxed mice crossed to CD4 Cre mice) and Eomesfl/fl CD4-Cre mice (Eomes floxed mice crossed to CD4 Cre mice), which respectively conditionally lack T-bet and Eomes expression in CD4 and CD8 T cells. Following treatment with Folfox, we found that the absence of Tbx21 led to a stronger decrease in PD-1 and Tim-3 expression as compared to Eomes-deficient mice (Fig. 4B). Accordingly, the frequency of PD-1+ and Tim-3+ CD8 T cells drastically dropped in mice lacking T-bet, while no obvious changes were detected in the absence of Eomes (Fig. 4C and D). Furthermore, we observed that the lack of Tbx21 but not Eomes in T cells also completely abrogated effector function of CD8 TILs (Fig. 4E). Accordingly, the antitumor effect of Folfox was impaired in absence of Tbx21 (Fig. 4F). This demonstrates that, following Folfox treatment, not only T-bet controls the induction of PD-1+ CD8 T cells in the TME but it also dictates the ability of Folfox to induce anticancer immunity.
PD-L1 expression on tumor cells induced by Folfox in vivo is driven by IFNγ-producing CD8 T cells
Next, we assessed whether Folfox can also modulate PD-L1 on tumor cells. We found that Folfox administration led to a marked increase of the expression of the Cd274 gene encoding PD-L1, and of PD-L1 protein expression (78 ± 8% in Folfox vs 31±7% in untreated control) on tumor cells both in CT26 and MC38 tumor models (Fig. 5A-D). Kinetic analysis revealed that PD-L1 expression on tumor cells peaked 8 days after treatment initiation (Fig. 5E). We examined whether other drugs can modulate PD-L1 induction. As shown in Fig. 5F, OX also promoted PD-L1 expression on tumor cells in vivo but to at lesser extent than Folfox while 5-FU and MMC did not.
Because we did not find any correlation between PD-L1 induced by drugs on tumor cells in vitro and in vivo (Supplementary Fig. 7), we assumed that PD-L1 expression could be driven through an indirect mechanism. To test this, we first assessed the levels of PD-L1 expression on tumor isolated from immunocompetent or T-cell deficient Nude mice treated or not with Folfox. We observed that PD-L1 on tumor cells was drastically reduced in immunodeficient mice, indicating that T cells play a key role in PD-L1 expression upon Folfox treatment (Fig. 6A). Interestingly, depletion of CD8, but not CD4 T cells, suppressed Folfox-induced PD-L1 expression on tumor cells, demonstrating that CD8 T cells are responsible for PD-L1 expression following Folfox (Fig. 6B). As expected, neutralization of IFNγ in vivo significantly decreased PD-L1 expression on tumor cells (Fig. 6C).
Figure 7.
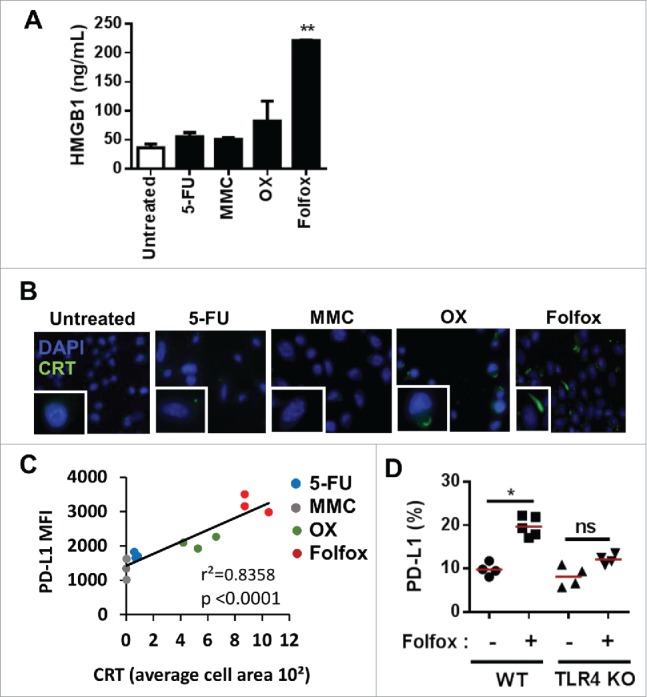
The induction of immunogenic tumor cell death drives PD-L1 expression on tumor cells in vivo. (A-B) CT26 colorectal tumor cells were treated in vitro with or without 5-Fluorouracil (5-FU, 10 µM), Mitomycin (MMC, 20 µM), Oxaliplatin (OX, 50 µM) or Folfox (5-FU, 10 µM + OX, 50 µM). (A) HMGB1 release by ELISA 24 H after treatment (Mean ± s.d of experimental replicates, Kruskal-Wallis test). (B) Immunofluorescence analysis of calreticulin (CRT) exposure at the membrane 6 h after treatment. (C) Correlation between calreticulin (CRT) exposure on CT26 tumor cells treated in vitro with the different chemotherapies and PD-L1 expression on tumor cells in vivo (Pearson correlation) (n = 3/group). (D) MC38 tumor-bearing C57BL/6 and TLR4-deficient mice were treated with glucose 5% (-) or Folfox (+). PD-L1 expression on viable tumor cells 8 days after treatment is depicted (n = 4-5/group, Kruskal-Wallis test). Each dot represents an individual measurement in one individual. *p < 0.05; **p < 0.01; ns, not significant. Data are representative of two independent experiments. See also Supplementary Fig. 8.
Next, we searched for a potential mechanism involved in IFNγ-dependent PD-L1 expression on tumor cells. ERK, mTOR and STAT signaling have been previously reported to modulate PD-L1 expression in cancer cells.25 Upon treatment of CT26 cells in vitro with IFNγ, we found enhanced phosphorylation of STAT1 but not of ERK and mTOR (Fig. 6D). Furthermore, we found an upregulation of IRF1 expression which was reported to be regulated by STAT1 and was proposed to drive PD-L1 expression26 (Fig. 6D). Accordingly, IFNγ treatment induced the binding of IRF1 to the promoter of PD-L1 gene (Cd274) (Fig. 6E). Silencing IRF1 using siRNA confirmed that IRF1 was required for PD-L1 expression in response to IFNγ in CT26 cancer cells (Fig. 6F).
Taken together, these results clearly indicate that in our model IFNγ-secreting CD8 TILs are the main contributor to PD-L1 induction on tumor cells following Folfox administration.
Immunogenic tumor cell death induced by Folfox promotes high levels of PD-L1 on tumor cells
Because ICD induced by chemotherapies can stimulate CD8 T cells,12,14 we hypothesized that Folfox-driven PD-L1 expression may be related to ICD. We first evaluated the ability of Folfox and other chemotherapies to induce ICD in vitro in the CT26 model. By monitoring cell surface calreticulin (CRT) expression and HMGB1 release, we observed that Folfox highly induced these two ICD hallmarks as compared to other drugs (Fig. 7A and B). Interestingly, a strong positive correlation was found between CRT exposure on CT26 tumor cells in vitro and PD-L1 induction on tumor cells in vivo by chemotherapies (p < 0.0001)(Fig. 7C). Comparable results were obtained with MC38 colorectal cancer as well as with LLC1 mouse lung cancer models treated with Doxorubicin (Doxo), an ICD inducer,15 suggesting that this effect could be extended to other tumor types (Supplementary Fig. 8).
Figure 8.
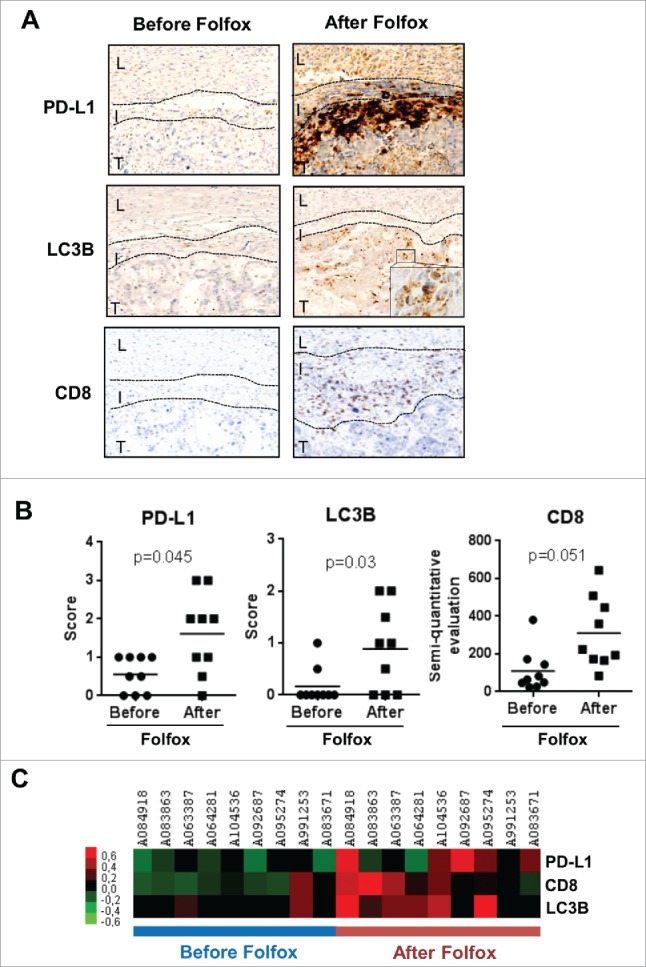
Impact of Folfox neoadjuvant chemotherapy in metastatic colorectal cancer patients. Tumor samples from 9 metastatic colorectal cancer patients were harvested before and after Folfox neoadjuvant chemotherapy. (A) Representative images of patients' tumor biopsies showing PD-L1, LC3B and CD8 labeling by immunohistochemistry. L: liver, I: infiltrate, T: tumor. (B) Individual representation of patients for each parameter. Scores of 2+ and 3+ are classified as high expression. (C) Heatmap of patients before and after Folfox chemotherapy.
To confirm that ICD accounts for PD-L1 induction in vivo, we monitored PD-L1 expression on tumor cells in Toll-like receptor 4 (TLR4) deficient mice that cannot mount an immune response following ICD induction. TLR4 is indeed one of the receptors of HMGB1 and reported to be required to tumor control upon ICD induction.13,27 In the absence of TLR4, the induction of PD-L1 expression on tumor cells by Folfox is abrogated (Fig. 7D), indicating that ICD is required for PD-L1 expression on tumor cells in vivo.
Folfox neoadjuvant chemotherapy stimulates ICD along with increased CD8 infiltrate and PD-L1 expression in the tumors of metastatic colorectal cancer patients
We eventually addressed the effect of Folfox chemotherapy on the TME in humans. To this end, we analyzed 9 tumor tissue samples from patients with stage IV colorectal cancer before and after 6 cycles of neoadjuvant Folfox regimen before surgery. The patients' main disease characteristics are depicted in Table 1. Our results revealed that PD-L1 expression was significantly higher in tissue samples after Folfox and this upregulation was noted in 5 out of 9 (56%) of patients (Fig. 8). Interestingly, Folfox chemotherapy was associated with an increase of CD8 TILs as well as with higher expression of LC3B puncta, a marker of autophagy and also reported as a surrogate marker of ICD induction in humans (Fig. 8). Taken together, these results support the links between Folfox-induced ICD, CD8 T cell infiltration and PD-L1 expression in human colorectal cancers.
Table 1.
Characteristics of patients with colorectal cancer (N = 9).
| Characteristics | No. of patients |
|---|---|
| Age mean, years | 62 ± 15 |
| Gender Male Female |
6 3 |
| Primary tumour Colon Rectum |
8 1 |
| RAS mutation Yes No |
3 6 |
| Braf Mutation Yes No |
0 9 |
| Liver metastasis > 3 < 3 Synchronous Metachronous |
4 5 2 7 |
Discussion
In this study, we investigated the rationale to combine chemotherapy with anti-PD1 therapy in colorectal cancer. By using two mouse colorectal cancer models, we found that Folfox plus anti-PD-1 treatment induced complete and long-lasting tumor cures in mice.
We found that Folfox induced strong expression of immune checkpoints such as PD-1 on activated CD8 TILs. In return, the IFNγ secreted by Folfox-induced CD8 T cells drove PD-L1 expression on tumor cells. Similar effect of Folfox was observed in colorectal cancer patients. Indeed, an increased CD8 cell infiltrate and tumor PD-L1 expression were found in metastatic colorectal cancer patients after Folfox neoadjuvant therapy. These observations are in line with the concept of adaptive immune resistance that has been defined as a dominant mechanism of tumor escape in the tumor microenvironment.28 Thus, the upregulation of PD-L1 by tumor cells in response to IFNγ secreted by CD8 T cells is an adaptive immune resistance mechanism to Folfox. This finding could also represent an escape mechanism to Folfox therapy in colorectal cancer.
In mouse and human melanoma, the success of immune checkpoint blockade relies on the inhibition of adaptive immune resistance.10,28 In our study, we demonstrated that the efficacy of Folfox/anti-PD-1 combination in mice is strongly linked to the disruption of adaptive immune resistance and not to a mere additive effect of these therapies. Indeed, anti-PD-1 alone was not able to control tumor growth as already reported in colorectal cancer patients.5,6 The efficacy of anti-PD-1 immunotherapy is associated to the pre-existence of abundant PD1hi CD8 T cells in TME.7,10,29 We showed that Folfox promoted activated tumor-specific PD-1+ CD8 T cells in the TME, creating a suitable environment for the action of anti-PD-1 therapy. Besides, this could also explain the lack of efficacy of anti-PD-1 when combined to other drugs such as 5-FU or MMC, which do not stimulate functional PD-1+ CD8 TIL in vivo. Of note, we observed in our mouse model that the Folfox-induced PD-1+ CD8 TILs decrease together with their antitumor function after two weeks, suggesting that the administration of immune checkpoint inhibitors should be given concomitantly or early after Folfox therapy.
We further deciphered the mechanism by which Folfox induced adaptive immune resistance. PD-1 induction on CD8 TILs was dependent on T-bet, while PD-L1 on tumor cells required IFNγ/IRF1 signaling. This T-bet-dependent PD-1 expression is in discrepancy with studies conducted in mouse models of chronic viral infection reporting that T-bet repressed PD-1 expression on CD8 T cells.30,31 It has however been described that T-bet was expressed by early activated CD8 T cells.23 In our study, T-bet expression was assessed early after treatment, possibly explaining why we found a co-expression of T-bet and PD-1 in Folfox-induced CD8 TILs.
It has been reported that combining MDSC-targeted therapy with immune checkpoint blockade induced a robust synergistic antitumor effect through an increased infiltration.32 Among the tested cytotoxic drugs, 5-FU was shown to deplete MDSC and we observed that Folfox has similar effect. In contrast to Folfox, the combination of 5-FU to anti-PD-1 does not lead to tumor cure, suggesting that the depletion of MDSC is not sufficient in this context to allow full CD8 T cell activation.
Chemotherapies inducing immunogenic tumor cell death (ICD) were reported to synergize with immunotherapy in a CD8 T cell-dependent manner.13 We further here demonstrate that ICD was involved in the tumor adaptive immune resistance triggered by Folfox in vivo. Indeed, Folfox generated high expression of calreticulin and HMGB1. In addition, PD-L1 induction by Folfox was decreased in TLR4-deficient mice that cannot mount a suitable immune response following ICD.27 Furthermore, in colorectal cancer patients treated by Folfox, LC3B (a surrogate marker of ICD33,34) is induced along with high CD8 infiltration and PD-L1 expression in tumor. Thus combining LC3B, CD8 and PD-L1 in TME could represent a predictive biomarker to anti-PD-1 therapy efficacy in colorectal cancer patients.3,8
In conclusion, we described for the first time PD-1/PD-L1 pathway as part of an adaptive immune resistance cycle induced by Folfox chemotherapy. The blockade of the PD-1/PD-L1 pathway prevents the emergence of such resistance mechanism to the treatment in vivo. Our study thus provides a robust rationale to use therapies like Folfox in combination with immune checkpoint inhibitors in cancer patients.
Materials and methods
Experimental models and subject details
For in vivo animal studies, animals were used between 6 and 8 weeks of age. Female BALB/cAnNRj and C57BL/6NRj mice were purchased from Centre d'élevage Janvier (Le Genest St Isle, France). TLR4-KO mice were kindly provided by Dr. Ryffel. Floxed Tbx21 and Eomes mice as well as CD4-Cre were purchased from JAX. All animal experiments were performed under protocols approved by the local ethical committee and were carried out according to the good laboratory practices defined by the animal experimentation Rules in France. For human studies, tumor samples were collected at the Centre Georges François Leclerc (Dijon, France) and all patients had given their written consent. Tumor tissue samples from biopsies were collected from 9 stage IV metastatic colorectal cancer patients at the baseline and after 6 cycles of Folfox neoadjuvant chemotherapy before surgery. For mouse tumor cell lines, CT26 (which exhibits a microsatellite stable profile35) and MC38 colon carcinoma cells, and LLC1 lung carcinoma cells were cultured in complete medium: RPMI 1640 with glutamax-1 (Lonza) supplemented with 10% Fetal Calf Serum (Lonza), 1% Penicillin, Streptomycin, Amphotericin B (Gibco). All cells were routinely tested for mycoplasma contamination using Mycoalert Mycoplasma Detection Kit (Lonza) and found negative.
Tumor challenge and treatment
1.106 CT26 or MC38 tumor cells were injected s.c. into the right flank of mice. When tumors reached 50–70 mm2; (between day 8–10), groups were formed. Mice whose tumors did not meet this criterion were excluded. All chemotherapies were obtained from the Centre George François Leclerc, except for mitomycin C (MMC) (Sigma). 5-FU, OX, MMC and Irinotecan were administered i.p. once at 50 mg/kg, 6 mg/kg, 2 mg/kg and 20 mg/kg respectively. Doxorubicin (Doxo) was given once i.t. at 120 µg per mouse. Gemcitabine (Gem) was given once i.p. at 75 mg/kg. Mice from control groups were injected with the solvent used to dissolve the drugs. Anti-mouse PD-1 antibody (RMP1-14; BioXcell) injections were initiated concomitantly with the chemotherapy treatment, then given i.p. at 200 µg per mice twice a week until the tumor reached >250 mm2 or, when appropriate, until complete tumor regression. Mice whose tumors exceeded 250 mm2; were euthanized due to ethical reasons and survival curves were plotted. For rechallenge experiments, tumor-free mice were injected with 2.106 CT26 on the left flank and 2.105 4T1 on the right flank. For CD8, CD4 and IFNγ depletion, anti-mouse CD8 (YTS 169.4; BioXcell), CD4 (GK1.5; BioXcell) or IFNγ antibodies (XMG1.2; BioXcell) were used. Anti-CD8 antibody was administrated i.p. once at 500 µg per mice, anti-CD4 twice every two days at 300 µg per mice and anti-IFNγ twice a week at 300 µg per mice.
ELISpot IFNγ assay
Freshly percoll-purified tumor-infiltrating lymphocytes were incubated at 5.104 cells per well in duplicate in Elispot IFNγ plates (Diaclone) and in the presence of medium or AH-1/H2-Ld peptide (10 µg/mL, Proimmune) derived from gp70 antigen expressed by CT26 tumor cells. Plates were incubated for 18 H at 37°C and spots were revealed following the manufacturer's instructions (GenProbe). Spot-forming cells were counted using the “C.T.L. Immunospot” system (Cellular Technology Ltd.).
Flow cytometry
Fluorochrome-conjugated anti-PD-L1 (10 F.9 G2), anti-CD45 (30-F11), anti-CD11b (M1/70), anti-CD8 (53-6.7), anti-CD4 (GK1.5), anti-CD3 (145-2C11), anti-Tim3 (RMT3-23) and anti-TNFα (MP6-XT22) were from Biolegend. Anti-PD1 (J43) was from eBioscience. CD107 a (1D4B) and anti-IFNγ (XMG1.2) was from BD Bioscience. For selection of tumor cells, after Percoll performed to isolate tumor-infiltrating lymphocytes, cells from the upper phase were collected. First, tumor cells were gated based on FSC/SSC parameters using in vitro tumor cell line as reference. Then CD45-7AAD- viable tumor cells were selected. All events were acquired by a BD LSR-II cytometer equipped with BD FACSDiva software (BD Biosciences) and data were analyzed using FlowJo software (Tree Star, Ashland, Oregon).
Western blotting
Cells were plated at a density of 1 × 10⁵ cells onto 24-well plate. After 24 h cells were grown in X-Vivo 15 medium (Lonza) during 4 h and treated with mouse IFNγ (Miltenyi, #130-105-790) at working concentration of 10 ng/ml, diluted in X-Vivo 15 medium. 24 hours after the treatment, whole cell extracts were prepared in boiling buffer (1% SDS, 1 mM sodium orthovanadate and 10 mMTris, pH 7.4) in the presence of complete protease inhibitors (Roche Diagnostics). The viscosity of samples was diminished by sonication. Protein concentrations were measured with a Bio-Rad DC protein assay kit. Protein lysates were incubated in loading buffer (125 mMTris-HCl, pH 6.8, 10% β-mercaptoethanol, 4.6% SDS, 20% glycerol and 0.003% bromophenol blue) and heated at 95°C for 5 min, then were separated by sodium dodecyl sulfate polyacrylamide gel electrophoresis (SDS-PAGE, 12%) and were transferred by electroblot to nitrocellulose membrane before analysis with a chemiluminescence detection kit (ThermoFisher). The primary antibodies used for immunoblotting directed against IRF1 were from Santa Cruz Biotechnologies. p-STAT1, STAT1, p-ERK, ERK, p-mTOR, mTOR were from Cell Signaling. β-actin was from Sigma-Aldrich.
ChIP assay
ChIP assays were performed with a ChIP-IT express kit (Active Motif Europe) according to the manufacturer's instructions. After enzymatic digestion, DNA was immunoprecipitated overnight at 4°C with 3 μg of anti-mouse IRF1 (H-205, Santa Cruz, #sc-13041) or 2 μg of negative control immunoglobulin. After the addition of protein G beads, the mixture of protein G, antibody and chromatin was washed and eluted from the protein G with supplied buffers. Then, cross-linking was reversed and samples were analyzed by quantitative PCR. Oligonucleotide sequences are: promoter PDL1: forward 5′-GGTTCCACTCCCACCCAAA-3′; reverse 5′-AACCGGGCTGCTACTGAGAG-3′.
SiRNA transfection
Cells were plated at a density of 1 × 10⁵ cells onto 24-well plate. After 24 H, the cells were transfected with IRF-1 siRNA (siRNA ID s7501) or control siRNA using Lipofectamine 2000 (Invitrogen) according to the manufacturer's recommendations. One day after the transfection, cells were grown in X-Vivo 15 medium (Lonza) during 4 h and treated with mouse IFNγ (Miltenyi) at working concentration of 10 ng/ml, diluted in X-Vivo 15 medium. 24 hours after the treatment, total RNA was isolated using Trizol reagent (Invitrogen), according to the manufacturer's protocol. cDNA were generated using M-MLV Reverse Transcriptase (Invitrogen), which was amplified by real-time quantitative PCR (RT-qPCR) with the SYBR Green method using the 7500 Fast Real Time PCR system (Applied Biosystems). Expression was normalized to the expression of mouse Actb. Primers designed to assess the expression of IRF1 are, forward 5′-AGGCATCCTTGTTGATGTCC-3′ and reverse 5′-AATTCCAACCAAATCCCAGG-3′; and of PD-L1 are, forward 5′-CTCGCCTGCAGATAGTTCCC-3′ and reverse 5′-GTCCAGCTCCCGTTCTACAG-3′.
Transcriptome analyses
Tumor-infiltrating CD8 T cells from CT26-tumor bearing mice treated with Glucose 5% (control) or Folfox when tumors reached 50–70 mm2 were sorted by flow cytometry 8 days following treatment. CD8 TILs cells coming from 2 independent experiments with 8–10 pooled tumors for each experiment were used. Splenic CD8 T cells from 2 naïve mice were used as reference. Total mRNA was isolated using Trizol (Gibco Life Technologies) according to the manufacturer's instructions. rRNA from total RNA extracted were removed with NEBNextrRNA depletion kit (New England BioLabs). 100 ng of RNA depleted of rRNA was used for the library preparation with a NEBNext Ultra RNA library kit for Illumina according to the manufacturer's instructions (New England BioLabs). RNA sequencing was performed on a NextSeq 500 device (Illumina). The libraries were sequenced with paired-end 75–base pair ‘reads’. FASTQ files were mapped with the BWA software package (mm10 National Center for Biotechnology Information assembly of the Mus musculus genome) for Illumina. Analysis was performed with the splice junction mapper TopHat for Illumina. The files generated were processed with Cufflinks software to obtain annotated expressed genes in each studied subtype. Heatmaps of selected genes were generated using R software (http://www.R-project.org).
Detection of immunogenic tumor cell death induction
For fluorescence detection of cell surface CRT, tumor cells were applied on a microscope slide plated onto 12-well plate. Cells were grown 24 H in complete medium (RPMI 10% Fetal Bovine Serum 1% Penicillin-Amphotericin B), then treated for 6 H with or without 5-FU (10 µM), Oxaliplatin (OX, 50 µM), Mitomycin C (MMC, 20 µM) or 5-FU/OX (Folfox, 10 µM/50 µM). Cells were fixed at room temperature with 0.25% paraformaldehyde (PFA) for 5 min then incubated for 30 min at 4°C in PBS 3% BSA, then incubated 30 min at 4°C with primary rabbit anti-mouse anti-CRT (1:200, Abcam, ab2907) in PBS 3% BSA. The secondary antibody Alexa488-labeled donkey anti-rabbit IgG H&L (1:500, Abcam, ab150073) added in PBS 3% BSA for 30 min at 4°C. Cells were then fixed in PFA 4% for 20 min at 4°C. To measure HMGB1 release, cells were incubated for 24 H in presence of the different chemotherapies as described above. HMGB1 levels were measured by ELISA (Chondrex) according the manufacturer's instructions.
Real-time quantitative reverse transcription PCR (RT-qPCR)
Total RNA from cells was extracted with TriReagent (Ambion), reverse transcribed using M-MLV Reverse Transcriptase (Invitrogen) and was analyzed by real-time quantitative PCR (RT-qPCR) with the Sybr Green method according to the manufacturer's instructions using the ViiA™ 7 Real-Time PCR System (Applied Biosystems). The following primers were used: mouse Actb (forward: ATGGAGGGGAATACAGCCC/ reverse: TTCTTTGCAGCTCCTTCGTT), mouse Pdcd1 (forward: GGCTTCTAGAGGTCCCCAAT/ reverse: GAAGGCGGCCTGTTTTTCAG), mouse Havcr2 (forward: ATCCTTAAATGGTATTCCTG/ reverse: TCTCCACTTCATATACGTTC), mouse Ifng (forward: TGAGCTCATTGAATGCTTGG/ reverse: ACAGCAAGGCGAAAAAGGAT), mouse Tnfa (forward: AGGGTCTGGGCCATAGAACT/ reverse: CCACCACGCTCTTCTGTCTAC), mouse Tbx21 (forward: TCAACCAGCACCAGACAGAG/ reverse: ATCCTGTAATGGCTTGTGGG), mouse Eomes (forward: CTCCCACGGATTCCCCTAGA/ reverse: GGGCTTGAGGCAAAGTGTTG), mouse Cd274 (forward: CTCGCCTGCAGATAGTTCCC/ reverse: GTCCAGCTCCCGTTCTACAG).
Immunohistochemistry on patients’ tumor samples
Formalin fixed, paraffin-embedded colorectal cancer biopsy tissue collected from 9 stage IV metastatic colorectal cancer patients treated or not with neoadjuvant Folfox chemotherapy were cut into 4-μm sections, mounted on slides, deparaffinized with xylene and dehydrated using a graded ethanol series. The slides were incubated overnight at 4 °C using antibodies against PD-L1 (SP142; Ventana), LC3B (5F10, Nanotools) or CD8 (C8/144B, Dako). A qualitative approach was used for evaluating the expression of PD-L1, LC3B and CD8 (graded: 0 = negative, 1 = very weak, 2 = moderate, 3 = strong). A PD-L1 or LC3B score of 1–3 was evaluated as “positive”.
Statistical analysis
Statistical analysis was performed using Prism software (Graph Pad software, La Jolla, CA, USA). For two-group comparisons, the Student t-test and the Mann-Whitney test were used. For multiple group comparison, the one-way or two-way ANOVA test or the Kruskal-Wallis test was used. All differences were considered statistically significant at the level of p < 0.05 (*p < 0.05, **p < 0.01). Mouse survival was estimated from the tumor size of 250 mm2; by Kaplan-Meyer method and the log-rank test was corrected for multiple comparisons using the Bonferroni method, P values less than 0.01 were considered significant (*p < 0.01, **p < 0.001).
Supplementary Material
Funding Statement
This work was supported by grants from the Fondation de France to LA and TRV, the Association pour la recherche sur le cancer to LA, FC and FG, the FEDER and Conseil Régional de Bourgogne, the French National Research Agency (grant number ANR-13-JSV3-0001 to LA, the ARSEP to LA and MD, the Ligue Régionale contre le cancer Comité Grand-Est to LA, the cancéropôle grand-est to LA, ERC starting grant [grant number: 677251 to LA] and Centre National de la Recherche Scientifique (CNRS) and the European Regional Development Fund (ERDF) to BR.
Competing interests
Lionel Apetoh is a consultant for Roche. Other authors have no disclosures.
References
- 1.Colucci G, Gebbia V, Paoletti G, Giuliani F, Caruso M, Gebbia N, Cartenì G, Agostara B, Pezzella G, Manzione L, et al.. Phase III randomized trial of FOLFIRI versus FOLFOX4 in the treatment of advanced colorectal cancer: a multicenter study of the Gruppo Oncologico Dell'Italia Meridionale. J Clin Oncol Off J Am Soc Clin Oncol. 2005;23:4866–75. doi: 10.1200/JCO.2005.07.113 [DOI] [PubMed] [Google Scholar]
- 2.Aparicio J, Fernandez-Martos C, Vincent JM, Maestu I, Llorca C, Busquier I, Campos JM, Perez-Enguix D, Balcells M. FOLFOX alternated with FOLFIRI as first-line chemotherapy for metastatic colorectal cancer. Clin Colorectal Cancer. 2005;5:263–7. doi: 10.3816/CCC.2005.n.037. PMID:16356303 [DOI] [PubMed] [Google Scholar]
- 3.Topalian SL, Taube JM, Anders RA, Pardoll DM. Mechanism-driven biomarkers to guide immune checkpoint blockade in cancer therapy. Nat Rev Cancer. 2016;16:275–87. doi: 10.1038/nrc.2016.36. PMID:27079802 [DOI] [PMC free article] [PubMed] [Google Scholar]
- 4.Sharma P, Allison JP. Immune checkpoint targeting in cancer therapy: toward combination strategies with curative potential. Cell. 2015;161:205–14. doi: 10.1016/j.cell.2015.03.030. PMID:25860605 [DOI] [PMC free article] [PubMed] [Google Scholar]
- 5.Topalian SL, Hodi FS, Brahmer JR, Gettinger SN, Smith DC, McDermott DF, Powderly JD, Carvajal RD, Sosman JA, Atkins MB, et al.. Safety, activity, and immune correlates of anti-PD-1 antibody in cancer. N Engl J Med. 2012;366:2443–54. doi: 10.1056/NEJMoa1200690. PMID:22658127 [DOI] [PMC free article] [PubMed] [Google Scholar]
- 6.Le DT, Uram JN, Wang H, Bartlett BR, Kemberling H, Eyring AD, Skora AD, Luber BS, Azad NS, Laheru D, et al.. PD-1 blockade in tumors with mismatch-repair deficiency. N Engl J Med. 2015;372:2509–20. doi: 10.1056/NEJMoa1500596. PMID:26028255 [DOI] [PMC free article] [PubMed] [Google Scholar]
- 7.Chen DS, Mellman I. Elements of cancer immunity and the cancer-immune set point. Nature. 2017;541:321–30. doi: 10.1038/nature21349. PMID:28102259 [DOI] [PubMed] [Google Scholar]
- 8.Pitt JM, Vétizou M, Daillère R, Roberti MP, Yamazaki T, Routy B, Lepage P, Boneca IG, Chamaillard M, Kroemer G, et al.. Resistance mechanisms to immune-checkpoint blockade in cancer: tumor-intrinsic and -extrinsic factors. Immunity. 2016;44:1255–69. doi: 10.1016/j.immuni.2016.06.001. PMID:27332730 [DOI] [PubMed] [Google Scholar]
- 9.Pardoll DM. The blockade of immune checkpoints in cancer immunotherapy. Nat Rev Cancer. 2012;12:252–64. doi: 10.1038/nrc3239. PMID:22437870 [DOI] [PMC free article] [PubMed] [Google Scholar]
- 10.Tumeh PC, Harview CL, Yearley JH, Shintaku IP, Taylor EJM, Robert L, Chmielowski B, Spasic M, Henry G, Ciobanu V, et al.. PD-1 blockade induces responses by inhibiting adaptive immune resistance. Nature. 2014;515:568–71. doi: 10.1038/nature13954. PMID:25428505 [DOI] [PMC free article] [PubMed] [Google Scholar]
- 11.Lake RA, Robinson BWS. Immunotherapy and chemotherapy–a practical partnership. Nat Rev Cancer. 2005;5:397–405. doi: 10.1038/nrc1613. PMID:15864281 [DOI] [PubMed] [Google Scholar]
- 12.Galluzzi L, Buqué A, Kepp O, Zitvogel L, Kroemer G. Immunological effects of conventional chemotherapy and targeted anticancer agents. Cancer Cell. 2015;28:690–714. doi: 10.1016/j.ccell.2015.10.012. PMID:26678337 [DOI] [PubMed] [Google Scholar]
- 13.Pfirschke C, Engblom C, Rickelt S, Cortez-Retamozo V, Garris C, Pucci F, Yamazaki T, Poirier-Colame V, Newton A, Redouane Y, et al.. Immunogenic chemotherapy sensitizes tumors to checkpoint blockade therapy. Immunity. 2016;44:343–54. doi: 10.1016/j.immuni.2015.11.024. PMID:26872698 [DOI] [PMC free article] [PubMed] [Google Scholar]
- 14.Zitvogel L, Apetoh L, Ghiringhelli F, Kroemer G. Immunological aspects of cancer chemotherapy. Nat Rev Immunol. 2008;8:59–73. doi: 10.1038/nri2216. PMID:18097448 [DOI] [PubMed] [Google Scholar]
- 15.Bezu L, Gomes-de-Silva LC, Dewitte H, Breckpot K, Fucikova J, Spisek R, Galluzzi L, Kepp O, Kroemer G. Combinatorial strategies for the induction of immunogenic cell death. Front Immunol. 2015;6:187. PMID:25964783 [DOI] [PMC free article] [PubMed] [Google Scholar]
- 16.Vincent J, Mignot G, Chalmin F, Ladoire S, Bruchard M, Chevriaux A, Martin F, Apetoh L, Rébé C, Ghiringhelli F. 5-Fluorouracil selectively kills tumor-associated myeloid-derived suppressor cells resulting in enhanced T cell-dependent antitumor immunity. Cancer Res. 2010;70:3052–61. doi: 10.1158/0008-5472.CAN-09-3690. PMID:20388795 [DOI] [PubMed] [Google Scholar]
- 17.Tesniere A, Schlemmer F, Boige V, Kepp O, Martins I, Ghiringhelli F, Aymeric L, Michaud M, Apetoh L, Barault L, et al.. Immunogenic death of colon cancer cells treated with oxaliplatin. Oncogene. 2010;29:482–91. doi: 10.1038/onc.2009.356. PMID:19881547 [DOI] [PubMed] [Google Scholar]
- 18.Chen DS, Mellman I. Oncology meets immunology: the cancer-immunity cycle. Immunity. 2013;39:1–10. doi: 10.1016/j.immuni.2013.07.012. PMID:23890059 [DOI] [PubMed] [Google Scholar]
- 19.Apetoh L, Smyth MJ, Drake CG, Abastado J-P, Apte RN, Ayyoub M, Blay J-Y, Bonneville M, Butterfield LH, Caignard A, et al.. Consensus nomenclature for CD8(+) T cell phenotypes in cancer. Oncoimmunology. 2015;4:e998538. doi: 10.1080/2162402X.2014.998538. PMID:26137416 [DOI] [PMC free article] [PubMed] [Google Scholar]
- 20.Anderson AC, Joller N, Kuchroo VK. Lag-3, Tim-3, and TIGIT: co-inhibitory receptors with specialized functions in immune regulation. Immunity. 2016;44:989–1004. doi: 10.1016/j.immuni.2016.05.001. PMID:27192565 [DOI] [PMC free article] [PubMed] [Google Scholar]
- 21.Nolz JC, Starbeck-Miller GR, Harty JT. Naive, effector and memory CD8 T-cell trafficking: parallels and distinctions. Immunotherapy. 2011;3:1223–33. doi: 10.2217/imt.11.100. PMID:21995573 [DOI] [PMC free article] [PubMed] [Google Scholar]
- 22.Takemoto N, Intlekofer AM, Northrup JT, Wherry EJ, Reiner SL. Cutting Edge: IL-12 inversely regulates T-bet and eomesodermin expression during pathogen-induced CD8+ T cell differentiation. J Immunol Baltim Md 1950. 2006;177:7515–9 [DOI] [PubMed] [Google Scholar]
- 23.Intlekofer AM, Takemoto N, Wherry EJ, Longworth SA, Northrup JT, Palanivel VR, Mullen AC, Gasink CR, Kaech SM, Miller JD, et al.. Effector and memory CD8+ T cell fate coupled by T-bet and eomesodermin. Nat Immunol. 2005;6:1236–44. doi: 10.1038/ni1268. PMID:16273099 [DOI] [PubMed] [Google Scholar]
- 24.Joshi NS, Cui W, Dominguez CX, Chen JH, Hand TW, Kaech SM. Increased numbers of preexisting memory CD8 T cells and decreased T-bet expression can restrain terminal differentiation of secondary effector and memory CD8 T cells. J Immunol Baltim Md 1950. 2011;187:4068–76 [DOI] [PMC free article] [PubMed] [Google Scholar]
- 25.Chen J, Jiang CC, Jin L, Zhang XD. Regulation of PD-L1: a novel role of pro-survival signalling in cancer. Ann Oncol Off J Eur Soc Med Oncol. 2016;27:409–16. doi: 10.1093/annonc/mdv615 [DOI] [PubMed] [Google Scholar]
- 26.Lee S-J, Jang B-C, Lee S-W, Yang Y-I, Suh S-I, Park Y-M, Oh S, Shin J-G, Yao S, Chen L, et al.. Interferon regulatory factor-1 is prerequisite to the constitutive expression and IFN-gamma-induced upregulation of B7-H1 (CD274). FEBS Lett. 2006;580:755–62. doi: 10.1016/j.febslet.2005.12.093. PMID:16413538 [DOI] [PubMed] [Google Scholar]
- 27.Apetoh L, Ghiringhelli F, Tesniere A, Obeid M, Ortiz C, Criollo A, Mignot G, Maiuri MC, Ullrich E, Saulnier P, et al.. Toll-like receptor 4-dependent contribution of the immune system to anticancer chemotherapy and radiotherapy. Nat Med. 2007;13:1050–9. doi: 10.1038/nm1622. PMID:17704786 [DOI] [PubMed] [Google Scholar]
- 28.Ribas A. Adaptive immune resistance: how cancer protects from immune attack. Cancer Discov. 2015;5:915–9. doi: 10.1158/2159-8290.CD-15-0563. PMID:26272491 [DOI] [PMC free article] [PubMed] [Google Scholar]
- 29.Daud AI, Loo K, Pauli ML, Sanchez-Rodriguez R, Sandoval PM, Taravati K, Tsai K, Nosrati A, Nardo L, Alvarado MD, et al.. Tumor immune profiling predicts response to anti-PD-1 therapy in human melanoma. J Clin Invest. 2016;126:3447–52. doi: 10.1172/JCI87324. PMID:27525433 [DOI] [PMC free article] [PubMed] [Google Scholar]
- 30.Kao C, Oestreich KJ, Paley MA, Crawford A, Angelosanto JM, Ali M-AA, Intlekofer AM, Boss JM, Reiner SL, Weinmann AS, et al.. Transcription factor T-bet represses expression of the inhibitory receptor PD-1 and sustains virus-specific CD8+ T cell responses during chronic infection. Nat Immunol. 2011;12:663–71. doi: 10.1038/ni.2046. PMID:21623380 [DOI] [PMC free article] [PubMed] [Google Scholar]
- 31.Paley MA, Kroy DC, Odorizzi PM, Johnnidis JB, Dolfi DV, Barnett BE, Bikoff EK, Robertson EJ, Lauer GM, Reiner SL, et al.. Progenitor and terminal subsets of CD8+ T cells cooperate to contain chronic viral infection. Science. 2012;338:1220–5. doi: 10.1126/science.1229620. PMID:23197535 [DOI] [PMC free article] [PubMed] [Google Scholar]
- 32.Lu X, Horner JW, Paul E, Shang X, Troncoso P, Deng P, Jiang S, Chang Q, Spring DJ, Sharma P, et al.. Effective combinatorial immunotherapy for castration-resistant prostate cancer. Nature. 2017;543:728–32. doi: 10.1038/nature21676. PMID:28321130 [DOI] [PMC free article] [PubMed] [Google Scholar]
- 33.Michaud M, Martins I, Sukkurwala AQ, Adjemian S, Ma Y, Pellegatti P, Shen S, Kepp O, Scoazec M, Mignot G, et al.. Autophagy-dependent anticancer immune responses induced by chemotherapeutic agents in mice. Science. 2011;334:1573–7. doi: 10.1126/science.1208347. PMID:22174255 [DOI] [PubMed] [Google Scholar]
- 34.Ladoire S, Penault-Llorca F, Senovilla L, Dalban C, Enot D, Locher C, Prada N, Poirier-Colame V, Chaba K, Arnould L, et al.. Combined evaluation of LC3B puncta and HMGB1 expression predicts residual risk of relapse after adjuvant chemotherapy in breast cancer. Autophagy. 2015;11:1878–90. doi: 10.1080/15548627.2015.1082022. PMID:26506894 [DOI] [PMC free article] [PubMed] [Google Scholar]
- 35.Castle JC, Loewer M, Boegel S, de Graaf J, Bender C, Tadmor AD, Boisguerin V, Bukur T, Sorn P, Paret C, et al.. Immunomic, genomic and transcriptomic characterization of CT26 colorectal carcinoma. BMC Genomics. 2014;15:190. doi: 10.1186/1471-2164-15-190. PMID:24621249 [DOI] [PMC free article] [PubMed] [Google Scholar]
Associated Data
This section collects any data citations, data availability statements, or supplementary materials included in this article.


