

Abstract
Aims
Tofacitinib is an oral, small molecule JAK inhibitor being investigated for ulcerative colitis (UC). In a phase 2 dose‐ranging study, tofacitinib demonstrated efficacy vs. placebo as UC induction therapy. In this posthoc analysis, we aimed to compare tofacitinib dose and plasma concentration as predictors of efficacy and identify covariates that determined efficacy in patients with UC.
Methods
One‐ and two‐compartment pharmacokinetic models, with first‐order absorption and elimination, were evaluated to describe plasma tofacitinib concentration‐time data at baseline and week 8. Relationships between tofacitinib exposure (dose, average plasma drug concentration during a dosing interval at steady state [Cav,ss] and trough plasma concentration at steady state [Ctrough,ss]) and week 8 efficacy endpoints were characterized using logistic regression analysis. Baseline disease, demographics, prior and concurrent UC treatment were evaluated as covariates.
Results
Plasma tofacitinib concentrations increased proportionately with dose and estimated oral clearance, and Cav,ss values were not significantly different between baseline and week 8. Dose, Cav,ss and Ctrough,ss performed similarly as predictors of efficacy based on statistical criteria for model fit and comparison of model predictions for each endpoint. Individual Cav,ss values were similar between clinical remitters and nonremitters at predicted efficacious doses (10 and 15 mg twice daily). Baseline Mayo score was a significant determinant of efficacy. Predicted differences from placebo in clinical remission at 10 mg twice daily for patients with baseline Mayo score >8 and ≤8 were 39% (95% CI: 7–70) and 21% (–2–50), respectively.
Conclusions
Exposure–response characterization demonstrated the potential of tofacitinib 10 and 15 mg twice daily as induction therapy for UC without monitoring of plasma drug concentrations for dose optimization.
Keywords: inflammatory bowel disease, Janus kinase, pharmacokinetics
What is Already Known about this Subject
Dose optimization of biologic therapies for ulcerative colitis is required as patients may fail to respond, or lose response due to low systemic drug concentration at the indicated dose.
As an orally administered small molecule, tofacitinib is not expected to be susceptible to clearance mechanisms leading to low systemic drug concentration.
What this Study Adds
Exposure–response analyses from this phase 2 dose‐ranging study of tofacitinib definitively characterized tofacitinib dose and plasma concentration metrics as predictors of efficacy.
Baseline disease activity was identified as the most important predictor of efficacy during induction therapy. Patients with lower baseline disease activity were more likely to achieve remission at the end of induction treatment.
Tofacitinib dose and plasma concentration performed similarly as predictors of induction efficacy for patients with ulcerative colitis, and there was no effect of baseline disease or time on oral clearance of tofacitinib.
Introduction
Ulcerative colitis (UC) is a chronic inflammatory disease of the colon, characterized by intermittent episodes of disease flare interspersed with periods of remission 1, 2, 3. Patients with moderate to severe disease not controlled by treatment with oral anti‐inflammatory (5‐aminosalicylic acid, corticosteroids) or immunosuppressive (azathioprine, 6‐mercaptopurine) drugs are currently treated with biologic drugs administered intravenously or subcutaneously. Approved biologics for moderate to severe UC include antibodies targeted against the proinflammatory cytokine tumour necrosis factor‐α (http://www.guidetopharmacology.org/GRAC/LigandDisplayForward?ligandId=5074; http://www.guidetopharmacology.org/GRAC/LigandDisplayForward?ligandId=5004, http://www.guidetopharmacology.org/GRAC/LigandDisplayForward?ligandId=4860 and http://www.guidetopharmacology.org/GRAC/LigandDisplayForward?ligandId=6776) and the http://www.guidetopharmacology.org/GRAC/ObjectDisplayForward?objectId=2770&familyId=760&familyType=CATALYTICRECEPTOR integrin subunit on lymphocytes (http://www.guidetopharmacology.org/GRAC/LigandDisplayForward?ligandId=7437). However, not all patients with moderate to severe UC derive a clinical benefit from currently available therapies 4. Patients with moderate to severe inflammatory bowel disease (UC and Crohn's disease) may initially respond to therapy with biologic agents [i.e. TNF inhibitors (TNFi)], but up to 60% experience secondary loss of response requiring dose escalation or a switch to another TNFi to recapture response 5, 6. This loss of clinical benefit is often due to the formation of neutralizing anti‐drug antibodies, or disease‐related clearance mechanisms, that increase clearance of the drug resulting in lower systemic drug exposure than is required for efficacy.
http://www.guidetopharmacology.org/GRAC/LigandDisplayForward?ligandId=5677 is an oral, small molecule Janus kinase (http://www.guidetopharmacology.org/GRAC/FamilyDisplayForward?familyId=581) inhibitor that is being investigated for UC. It is a selective oral inhibitor of the JAK family of kinases, including http://www.guidetopharmacology.org/GRAC/ObjectDisplayForward?objectId=2047&familyId=581&familyType=ENZYME and http://www.guidetopharmacology.org/GRAC/ObjectDisplayForward?objectId=2049, which mediate signal transduction activity through the common γ chain of the surface receptors for multiple cytokines, including http://www.guidetopharmacology.org/GRAC/LigandDisplayForward?ligandId=4985, http://www.guidetopharmacology.org/GRAC/LigandDisplayForward?ligandId=4996, http://www.guidetopharmacology.org/GRAC/LigandDisplayForward?ligandId=4999, http://www.guidetopharmacology.org/GRAC/LigandDisplayForward?ligandId=5000, http://www.guidetopharmacology.org/GRAC/LigandDisplayForward?ligandId=4981 and http://www.guidetopharmacology.org/GRAC/LigandDisplayForward?ligandId=4987 7, 8.
Tofacitinib is not a biologic and is therefore not susceptible to changes in drug clearance due to the formation of neutralizing anti‐drug antibodies 9. Clearance of tofacitinib following oral dosing is mediated primarily by hepatic metabolism (70%) and, to a lesser extent, by renal elimination (30%) 9. Cytochrome P450 3A4 (http://www.guidetopharmacology.org/GRAC/ObjectDisplayForward?objectId=1337) is the primary hepatic enzyme responsible for metabolism of tofacitinib, and CYP2C19 is an additional minor metabolic pathway. Clinically significant differences in tofacitinib exposure due to genetic polymorphisms in hepatic drug metabolizing enzymes is not expected, and the current prescribing information for rheumatoid arthritis 10 does not recommend dose changes related to genetic polymorphisms.
In an 8‐week, placebo‐controlled, dose‐ranging phase 2 trial, patients with moderately to severely active UC treated with tofacitinib were more likely to have clinical response and remission than those receiving placebo 11. The objectives of this analysis were to: (1) compare tofacitinib dose and plasma concentration as predictors of key efficacy endpoints in the phase 2 induction study, and (2) evaluate the effect of potential covariates, such as demographics, prior and concurrent UC treatments, and baseline disease activity, on tofacitinib efficacy in patients with moderately to severely active UC.
Methods
Study design and patients
The 8‐week, multicentre, randomized, double‐blind, placebo‐controlled, dose‐ranging, phase 2 trial included patients who were aged at least 18 years and had a confirmed diagnosis of UC for at least 3 months. Patients had a total Mayo score of 6–12 points (total Mayo score range: 0–12 points; higher scores indicate more severe disease) and moderately to severely active disease on sigmoidoscopy (endoscopic subscore of 2 and 3, respectively [subscore scale: 0–3, higher scores indicate more severe disease]). Patients could receive stable doses of oral mesalamine and/or oral corticosteroids at a dose of ≤30 mg day–1 of prednisone equivalence. Doses of oral corticosteroids could not be increased but tapering was permitted 11.
Patients were randomly assigned in a 2:2:2:3:3 ratio to receive oral tofacitinib at doses of 0.5 mg, 3 mg, 10 mg or 15 mg, or placebo, administered twice daily (b.d.). Patients were treated for 8 weeks and followed through week 12. No data on clinical outcomes or adverse events were collected beyond week 12 11.
The trial is registered with ClinicalTrials.gov (NCT00787202). The protocol was reviewed and approved by the institutional review boards and independent ethics committees of the investigational centres. All patients provided written informed consent. All authors had access to the study data, and reviewed and approved the final manuscript.
Pharmacokinetics
The study protocol specified collection of plasma samples for measurement of tofacitinib concentrations from all patients prior to and following administration of a tofacitinib dose at baseline and week 8 study visits. Samples were collected 0.25, 0.5, 1 and 2–3 h following the dose at these visits. In addition, two samples were collected 1 h apart during the week 2 and week 4 visits. Plasma samples were analysed for tofacitinib concentrations using a validated, sensitive and specific high‐performance liquid chromatography–tandem mass spectrometric assay method. Plasma specimens were stored at approximately –20°C ± 10°C until analysis. The lower limit of quantification for tofacitinib was 0.100 ng ml–1.
Efficacy assessments
Total Mayo score was determined at baseline and week 8 study visits. Colonoscopy or flexible sigmoidoscopy was performed at baseline and again at week 8. Clinical response was the primary study endpoint and was defined as a decrease from baseline in the total Mayo score by at least 3 points and at least 30% with an accompanying decrease in rectal bleeding subscore of at least 1 point or absolute rectal bleeding subscore of 0 or 1. Clinical remission was a secondary endpoint and defined as a total Mayo score of ≤2 points, with no individual subscore exceeding 1 point. Mucosal healing was defined as an endoscopy subscore of 0 or 1, and was derived posthoc since it was not a prespecified endpoint in the study 12, 13. Exposure–response characterisation was performed using clinical response, clinical remission and mucosal healing as efficacy endpoints.
Data analysis and modelling
Plasma tofacitinib concentration–time profiles were described using nonlinear mixed‐effects compartmental models implemented in NONMEM version 7.3 (ICON Development Solutions). One‐ and two‐compartment pharmacokinetic models, with first order absorption and elimination, were evaluated to describe plasma tofacitinib concentration‐time data at baseline and week 8 and the best‐fit model was selected. Maximum likelihood estimates of fixed‐ and random‐effect parameters were obtained using the first‐order conditional estimation method. Parameter estimates were used to derive predicted individual tofacitinib concentration metrics, e.g. average plasma drug concentration during a dosing interval at steady state (Cav,ss) over the nominal 12‐h dosing interval and minimum trough plasma concentration at steady state (Ctrough,ss) at the end of the 12‐h dosing interval.
Since the primary objective of the pharmacokinetic analysis was to obtain individual Cav,ss and Ctrough,ss values for exposure–response analysis, a limited covariate evaluation was performed in the pharmacokinetic model. The effect of baseline disease severity on Cav,ss was evaluated using baseline measurements of faecal calprotectin, C‐reactive protein (CRP), albumin concentration, and total Mayo score, which were each added individually as covariates on oral clearance. Tofacitinib dose and visit week were evaluated as covariates on oral clearance to assess dose‐proportionality and durability of Cav,ss (derived from oral clearance) between study visits. Predicted individual concentration metrics were used as input for graphical and model‐based characterization of exposure–response relationships for efficacy endpoints.
Efficacy endpoints at week 8 (clinical remission, clinical response, mucosal healing and Mayo score) were summarized and plotted by tofacitinib dose and quartiles (four bins) of concentration metrics (Cav,ss and Ctrough,ss). The binary data for clinical remission, clinical response and mucosal healing were each described using logistic regression models. Linear and nonlinear Emax relationships of these endpoints with dose, Cav,ss and Ctrough,ss were evaluated, and the model providing a statistically better fit, based on the Akaike Information Criterion (AIC), was selected. Effects of covariates were evaluated in each model. The logistic regression model, expressed linearly on the logit (log odds) scale, was specified as: , where p[Y = 1] was the probability of response, β0 (intercept) corresponded to the placebo effect, βD was the drug effect and X m was the vector of covariates with corresponding linear coefficient vector βm. In linear models, the drug effect was described as: βD = βd* C, where βd was the slope coefficient of the effect of the exposure metric C (dose, Cav,ss or Ctrough,ss), and in Emax models, β D = E max × C/(E 50 + C), where the parameters Emax and E50 represented maximal effect and the dose or concentration for half‐maximal effect, respectively.
Covariates evaluated in each exposure–response model included potentially important prior and concurrent UC treatments: prior TNFi failure (yes or no) and concomitant corticosteroid use during the treatment period (yes or no). Baseline disease markers (faecal calprotectin, CRP, albumin concentration and total Mayo score) were evaluated as continuous covariates. The effect of patient demographics (sex, age, body weight and body mass index) and smoking status (current smoker or current nonsmoker) were also assessed. The covariates were evaluated individually using a linear coefficient, as described above, and significant covariates were included additively in the full model. Following identification of the full dose–response model for each efficacy endpoint, individual Cav,ss and Ctrough,ss values were each tested as a covariate in the model to evaluate whether concentration metrics provided statistically significant improvement in model fit, based on minimum objective function values.
Exposure–response modelling was performed using maximum likelihood methods implemented in NONMEM version 7.3 14, and data handling and plotting was performed using R version 3.02 15. Model comparisons for nested models (e.g. covariate evaluation) were performed using the log likelihood ratio test, based on difference in the log likelihood minimum objective function value between models. The AIC, which adjusts the log likelihood for the number of model parameters, was used for comparison of non‐nested models such as exposure–response models with dose, Cav,ss and Ctrough,ss as predictors. Evaluation of the predictive properties of each full model was performed by simulating 5000 trials, identical to the index trial, using 5000 parameter sets sampled from the variance–covariance matrix of each full model. The proportion of responders at each dose or bin of Cav,ss or Ctrough,ss in each trial was summarized across simulated trials to obtain median (or mean) and confidence intervals (CI). These were plotted as a function of dose or exposure (using the midpoint of each bin of Cav,ss and Ctrough,ss) for comparison to observations in predictive check plots.
Nomenclature of targets and ligands
Key protein targets and ligands in this article are hyperlinked to corresponding entries in http://www.guidetopharmacology.org/, the common portal for data from the IUPHAR/BPS Guide to PHARMACOLOGY 16 and are permanently archived in the Concise Guide to PHARMACOLOGY 2017/18 17, 18.
Results
Data
Demographic and baseline disease characteristics of patients included in the analysis are shown in Table 1. Of the 194 randomized patients receiving study treatment, 188 were included in the analysis. Tofacitinib plasma concentrations data were available from 141 patients receiving active drug in the study. Plasma concentrations were missing for five patients, and one randomized patient did not receive study treatment. These six patients were excluded from the analysis data set used for this analysis. Baseline faecal calprotectin was not available for seven patients, and baseline CRP, albumin concentration and Mayo score were each missing for one patient. Patients with missing baseline disease covariates were excluded when these covariates were included in the model, and no imputation was performed. Data from patients randomized to placebo were incorporated into the exposure–response analysis with dose, Cav,ss and Ctrough,ss set to 0.
Table 1.
Baseline characteristics of key covariates included in exposure–response analysis
| Placebo (n = 47) | Tofacitinib 0.5 mg b.d. (n = 31) | Tofacitinib 3 mg b.d. (n = 32) | Tofacitinib 10 mg b.d. (n = 30) | Tofacitinib 15 mg b.d. (n = 48) | All treatment groups (n = 188) a | |
|---|---|---|---|---|---|---|
| Male, n (%) | 23 (48.9) | 17 (54.8) | 18 (56.2) | 19 (63.3) | 26 (54.2) | 103 (54.8) |
| Mean (SD) [range] age, years | 42 (14.4) [21–77] | 43.8 (13.4) [20–73] | 42.1 (14.3) [21–72] | 42.8 (13.1) [21–65] | 40.7 (13.3) [19–66] | 42.1 (13.6) [19–77] |
| Mean (SD) [range] weight, kg | 74.8 (15.8) [46.3–112.3] | 75.6 (13.3) [50.8–105] | 73.1 (16.2) [46.8–119.7] | 76 (13.4) [56–97.7] | 74.5 (17.7) [41.4–126] | 74.8 (15.5) [41.4–126] |
| Mean (SD) [range] body mass index, kg m –2 | 25.4 (4) [17.3–38.2] | 26.3 (3.7) [20.1–34.7] | 24.6 (3.9) [17.2–36.1] | 25.5 (4.1) [18.5–36.6] | 25.6 (5.3) [16.8–37.4] | 25.5 (4.3) [16.8–38.2] |
| Smoking status, n (%) | ||||||
| Never smoked | 33 (70.2) | 16 (51.6) | 19 (59.4) | 21 (70) | 34 (70.8) | 123 (65.4) |
| Smoker | 2 (4.3) | 3 (9.7) | 4 (12.5) | 1 (3.3) | 4 (8.3) | 14 (7.4) |
| Ex‐smoker | 12 (25.5) | 12 (38.7) | 9 (28.1) | 7 (23.3) | 10 (20.8) | 50 (26.6) |
| Mean (SD) [range] disease duration, years | 8.7 (5.8) [0.9–26.2] | 9.2 (8.6) [0.8–33.9] | 8.7 (8.5) [0.3–33.3] | 10.3 (6.6) [1.4–22.8] | 8 (6.1) [0.9–24.8] | 8.9 (7) [0.3–33.9] |
| Mean (SD) [range] CRP, mg l−1 | 9.8 (13) [0.2–61.2] | 18.8 (29.4) [0.4–118] | 12.9 (13.3) [0.2–55.5] | 10.7 (15.5) [0.2–72.4] | 17.4 (26.7) [0.2–124] | 13.9 (21) [0.2–124] |
| Mean (SD) [range] faecal calprotectin, mg kg−1 | 1578.1 (2400.6) [28–10 617] | 1440.1 (1623.4) [28–5919] | 1376.2 (2149.8) [28–9134] | 1245.2 (2077.7) [28–10 485] | 1530.6 (2601.3) [28–13 590] | 1456.6 (2239.4) [28–13 590] |
| Mean (SD) [range] albumin, mg dl−1 | 4.2 (0.3) [3.1–5.1] | 4.1 (0.4) [2.9–4.7] | 4.2 (0.4) [3.4–4.9] | 4.3 (0.4) [3.1–4.8] | 4.3 (0.4) [2.9–5.0] | 4.2 (0.4) [2.9–5.1] |
| Mean (SD) [range] Mayo score | 8.2 (1.6) [4–11] | 8.6 (1.6) [6–12] | 8.4 (1.5) [6–12] | 8.1 (1.7) [3–11] | 8.0 (1.5) [5–11] | 8.2 (1.6) [3–12] |
| Corticosteroid use at baseline, n (%) | 21 (44.7) | 15 (48.4) | 10 (31.2) | 20 (66.7) | 15 (31.2) | 81 (43.1) |
| Prior TNFi failure within the previous 12 months, n (%) | 12 (25.5) | 2 (6.5) | 6 (18.8) | 6 (20) | 9 (18.8) | 35 (18.6) |
b.d., twice daily; CRP, C‐reactive protein; SD, standard deviation; TNFi, tumour necrosis factor inhibitor
One randomized patient did not receive study treatment
Pharmacokinetics
The pharmacokinetic data at the baseline and week 8 visits were included in the analysis. Plasma concentrations collected at weeks 2 and 4 were not included due to missing dosing information. A one‐compartment pharmacokinetic model (mono‐exponential disposition), with parameters oral clearance (CL/F), oral volume of distribution (V/F), first‐order absorption and an absorption lag time, was used to describe the data. Mean (standard error) of the fixed‐effect parameters, CL/F, V/F and first‐order absorption rate constant (Ka), were 22.4 (0.95) l h–1, 94.2 (2.35) l and 2.83 (0.46) h–1, respectively. Absorption lag time was estimated to be 0.16 h, but resulted in lack of model convergence and was fixed to this value to allow successful convergence. Estimated between‐patient variability (% coefficient of variation) was 31.4% for CL/F and 87.5% for Ka. Residual variability was 47.5%. Based on mean CL/F and V/F estimates from the model, predicted half‐life of tofacitinib in this population of patients with UC was 2.9 h. Cav,ss and Ctrough,ss values for individual patients were obtained from individual estimates of pharmacokinetic model parameters using Equation (1) and Equation (2), respectively.
| (1) |
| (2) |
The distribution of individual observed plasma concentrations at each dose was consistent with the respective prediction intervals obtained from simulations from the model (Figure S1). The estimate of CL/F was not influenced by dose or sampling occasion, indicating dose‐proportional increase in Cav,ss and no significant change in exposure between the baseline and week 8 visits within each dose group. CL/F did not correlate significantly with baseline values of albumin concentration, total Mayo score, faecal calprotectin or CRP concentration, indicating that baseline disease activity did not influence tofacitinib Cav,ss. Predicted Cav,ss and Ctrough,ss values increased approximately in proportion with dose, consistent with linear and dose‐proportional pharmacokinetics of tofacitinib (Figure 1).
Figure 1.
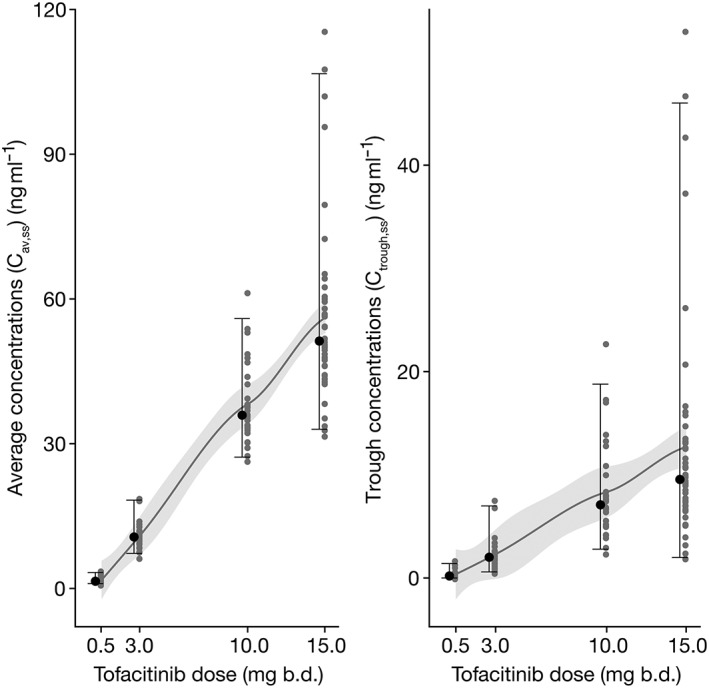
Distribution of Cav,ss and Ctrough,ss by tofacitinib dose. At each dose, individual estimated values are shown by grey symbols and the median value is shown by a black symbol. Error bars represent the range from 2.5th to 97.5th percentiles of estimated values. The solid line and shaded area represent a smooth through the data. b.d., twice daily; Cav,ss, average plasma drug concentration during a dosing interval at steady state; Ctrough,ss, trough plasma concentration at steady state
Observed efficacy
The observed proportion of patients achieving clinical remission at week 8, as a function of tofacitinib dose and bins (by quartiles) of Cav,ss and Ctrough,ss, is displayed in Figure 2. Similar plots for clinical response (Figure S2), mucosal healing (Figure S3) and change from baseline in Mayo score (Figure S4) at week 8 are included in the Supporting Information. These data demonstrated the similarity of observed exposure–response, when efficacy data are grouped by dose, Cav,ss or Ctrough,ss. Additionally, the distribution of Cav,ss and Ctrough,ss values within dose groups (dose‐normalized for comparison across dose groups) were similar for patients in clinical remission and those not in clinical remission, particularly in the efficacious dose groups (10 and 15 mg b.d.), indicating that Cav,ss or Ctrough,ss were not determinants of efficacy at an efficacious dose (Figure 3). Further modelling for statistical comparison of exposure–response, using dose, Cav,ss and Ctrough,ss as exposure metrics, was performed with all three efficacy endpoints.
Figure 2.
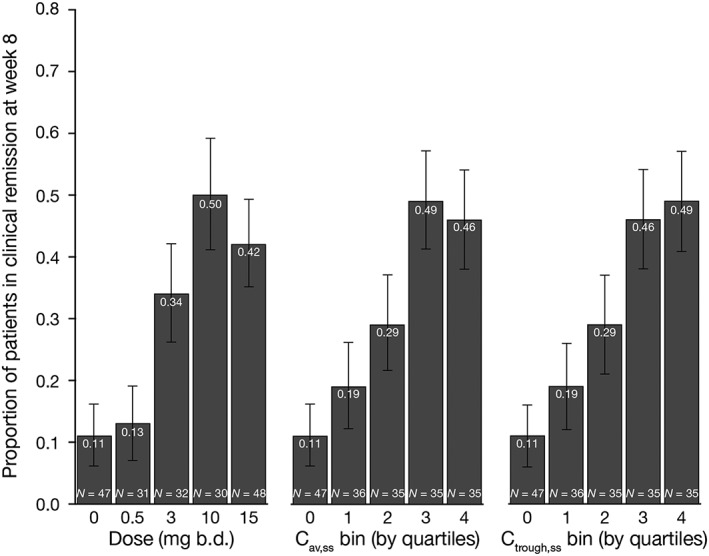
Proportion of patients achieving clinical remission, grouped by tofacitinib dose (and placebo) and quartiles of Cav,ss and Ctrough,ss, following 8 weeks of tofacitinib induction treatment in patients with moderate to severe ulcerative colitis. Error bars represent 95% confidence intervals. b.d., twice daily; Cav,ss, average plasma drug concentration during a dosing interval at steady state; Ctrough,ss, trough plasma concentration at steady state; N, number of patients
Figure 3.
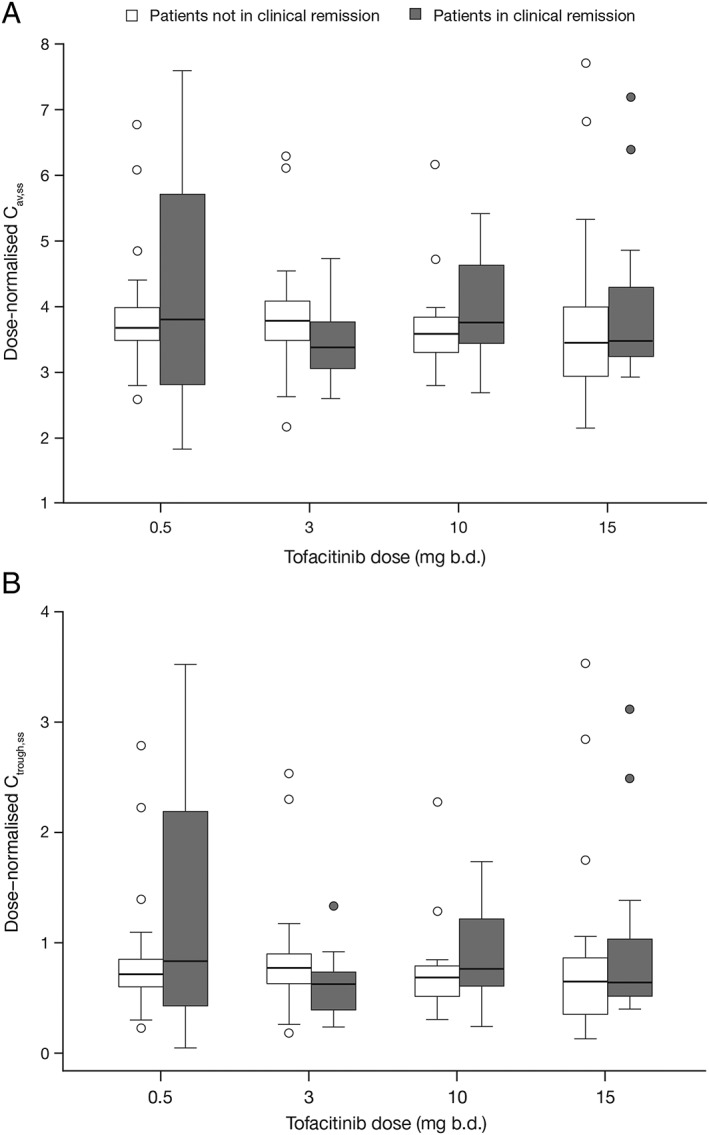
Distribution of individual dose‐normalised Cav,ss values (A), and Ctrough,ss values (B) in patients in clinical remission, and those not in clinical remission, at week 8, represented by box plots. Boxes represent interquartile range and the bold line in each box represents the median. Whiskers represent 95% confidence intervals and outliers are shown as symbols. b.d., twice daily; Cav,ss, average plasma drug concentration during a dosing interval at steady state
Model‐predicted efficacy
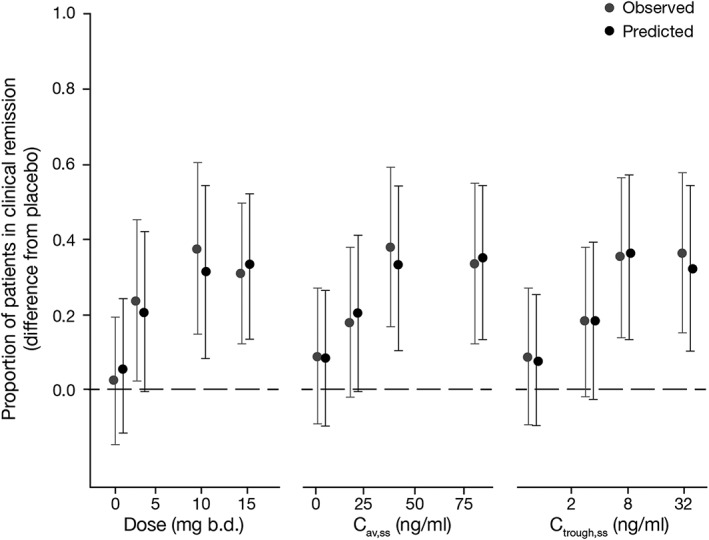
Model‐predicted clinical remission as a function of dose, Cav,ss and Ctrough,ss indicated very similar exposure–response predictions for the three exposure metrics (Figure 4). Parameter estimates and AIC values from linear or Emax models characterizing exposure–response relationships for clinical remission, clinical response and mucosal healing are listed in Table 2. AIC values for Cav,ss models were similar to, or lower than, those for Ctrough,ss models, indicating that Cav,ss was generally a better exposure metric for predicting efficacy than Ctrough,ss. Therefore, Cav,ss was used as the primary metric for comparison of dose and plasma concentration as predictors of efficacy. AIC values for clinical remission models were similar between dose and Cav,ss, indicating statistically similar model fits. Cav,ss was a slightly better predictor than dose for clinical response, and a slightly worse predictor for mucosal healing. A comparison of parameter estimates and model predictions indicates that the small differences in AIC values are unlikely to result in clinically meaningful differences in predicted efficacy. Predicted placebo‐adjusted clinical remission by tofacitinib dose, Cav,ss or Ctrough,ss demonstrated similarity of model predictions between dose and plasma concentration metrics (Figure 5). Furthermore, there was no statistically significant improvement in dose–response model fits for clinical remission, clinical response or mucosal healing with the addition of Cav,ss or Ctrough,ss as covariates in the model, indicating that patient‐specific Cav,ss or Ctrough,ss does not explain differences in efficacy between patients beyond that accounted for by dose.
Figure 4.
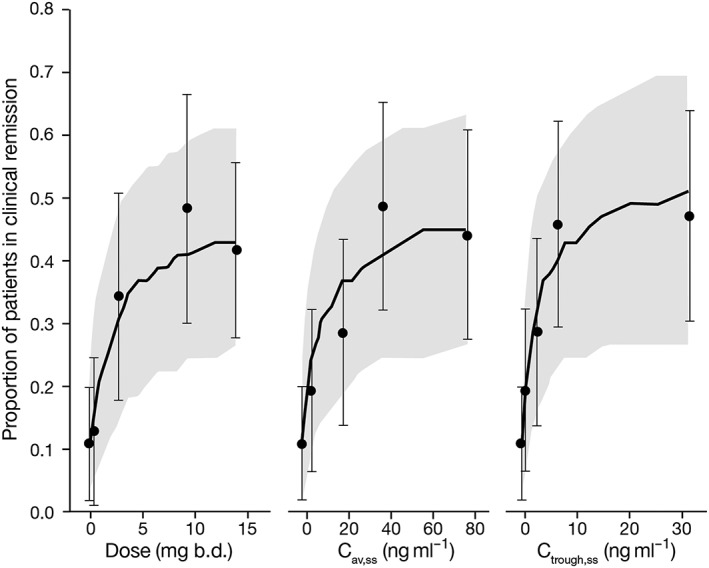
Observed and model‐predicted clinical remission at week 8 using tofacitinib dose, Cav,ss and Ctrough,ss as predictors. Predictions shown are from a base model, prior to inclusion of covariates. Solid lines represent median prediction, shaded regions represent the 95% prediction intervals, and symbols represent observed proportions with 95% confidence intervals shown by error bars. b.d., twice daily; Cav,ss, average plasma drug concentration during a dosing interval at steady state; Ctrough,ss, trough plasma concentration at steady state
Table 2.
Mean and 95% confidence interval of parameter estimates and AIC values from dose and exposure–response models for clinical remission, clinical response and mucosal healing
| Dose | C av,ss | C trough,ss | |
|---|---|---|---|
| Clinical remission | |||
| AIC | 190 | 190 | 190 |
| E 50 (mg or ng ml –1 ) | 1.06 (0.17–6.49) | 3.86 (0.63–23.55) | 0.84 (0.14–4.86) |
| E max | 2.35 (1.25–3.45) | 2.35 (1.25–3.45) | 2.35 (1.26–3.44) |
| Placebo | 1.81 (–0.35–3.97) | 1.83 (–0.33–3.99) | 1.91 (–0.23–4.05) |
| Coefficient for baseline CRP | –0.104 (–0.26–0.05) | –0.105 (–0.26–0.05) | –0.105 (–0.26–0.05) |
| Coefficient for baseline total Mayo score | –5.97 (–9.2 to –2.74) | –6 (–9.25 to –2.75) | –6.04 (–9.31 to –2.77) |
| Clinical response | |||
| AIC | 237 | 236 | 239 |
| Slope | 0.11 (0.07–0.18) | 0.03 (0.02–0.05) | 0.12 (0.07–0.22) |
| Placebo | 0.951 (–0.84–2.74) | 0.93 (–0.87–2.73) | 1.08 (–0.69–2.85) |
| Coefficient for baseline CRP | –0.103 (–0.21–0) | –0.104 (–0.21–0) | –0.0981 (–0.2–0.01) |
| Coefficient for baseline total Mayo score | –1.85 (–4.44–0.74) | –1.81 (–4.4–0.78) | –1.84 (–4.41–0.73) |
| Mucosal healing | |||
| AIC | 235 | 236 | 236 |
| Slope | 0.08 (0.04–0.15) | 0.02 (0.01–0.04) | N/A |
| ED 50 | N/A | N/A | 1.71 (0.13–21.85) |
| E max | N/A | N/A | 1.41 (0.41–2.41) |
| Placebo | 3.21 (1.37–5.05) | 3.25 (1.41–5.09) | 3.12 (1.27–4.97) |
| Baseline total Mayo score | –5.18 (–7.79 to –2.57) | –5.15 (–7.74 to –2.56) | –5.35 (–7.98 to –2.72) |
| Prior TNFi failure | –0.798 (–1.63–0.03) | –0.805 (–1.63–0.02) | –0.789 (–1.62–0.04) |
AIC, Akaike Information Criterion (–2 × log likelihood +2 × number of model parameters); Cav,ss, average plasma drug concentration during a dosing interval at steady state; CRP, C‐reactive protein; Ctrough,ss, trough plasma concentration at steady state; E50, dose, Cav,ss or Ctrough,ss value at which effect is half‐maximal in Emax model (log scale); Emax, maximum effect in Emax model; N/A, not applicable; TNFi, tumour necrosis factor inhibitor
Figure 5.
Observed and predicted placebo‐adjusted clinical remission as a function of tofacitinib dose, Cav,ss and Ctrough,ss. Error bars represent 95% confidence intervals for observed data and 95% prediction intervals for predicted data. Two‐sided 95% confidence interval for observed data obtained from a chi‐squared test for difference in independent proportions; two‐sided 95% prediction interval obtained from 5000 simulated parameter vectors from the final models. b.d., twice daily; Cav,ss, average plasma drug concentration during a dosing interval at steady state; Ctrough,ss, trough plasma concentration at steady state
Predictive checks using simulations from each model indicated consistency between distributions of observed and predicted data. Predictive checks of dose, Cav,ss and Ctrough,ss models for clinical remission are shown in terms of difference from placebo in Figure 5, and additional predictive check plots are included in the Supporting Information (Figure S5). Efficacy of tofacitinib was significantly better than placebo at 10 mg and 15 mg b.d. doses, based on the lower 95% prediction intervals (two‐sided) for placebo‐adjusted clinical remission that exceeded 0 for all three exposure models (Figure 5).
Covariate effects in dose and exposure–response models
Baseline Mayo score was a significant (P < 0.05) covariate in dose and exposure models for all three endpoints when evaluated individually. Baseline CRP was also significant in the clinical remission and clinical response models, and prior TNFi failure was a significant covariate when evaluated individually on mucosal healing. Baseline albumin concentration was a significant covariate on clinical remission, but not on mucosal healing or clinical response, when evaluated individually. Baseline Mayo score and CRP provided the largest decrease in objective function value relative to a base model without covariates. Baseline faecal calprotectin was not a significant predictor of any of the three efficacy endpoints. The full model for clinical remission included baseline Mayo score, CRP and albumin concentration as covariates, but albumin concentration was removed in the final model to avoid model ill‐conditioning due to inclusion of multiple correlated covariates. The final model for clinical response included baseline Mayo score and baseline CRP as covariates, and the final model for mucosal healing included baseline Mayo score and prior TNFi failure as covariates. In the final models for clinical remission and mucosal healing, only baseline Mayo score was significant, based on the two‐sided 95% CI of parameter estimate excluding 0, whereas no covariate reached significance for clinical response based on the above criterion.
Predictions of covariate effects were obtained using simulations from each final model. The difference from placebo in predicted percentage of patients in clinical remission at the 10 mg b.d. dose, among those with baseline total Mayo scores lower than or equal to the median of 8, was 39% (95% CI: 7–70) compared to 21% (95% CI: –2–50) for those above the median. Similarly, the predictions for the third quartile of Cav,ss, from the model with Cav,ss as a predictor, were 39% (95% CI: 7–67) and 21% (95% CI: –3–50), respectively, for patients below and above a baseline total Mayo score of 8. Therefore, patients with baseline Mayo score >8 had approximately two‐fold lower clinical remission rate compared to those with a lower baseline Mayo score. Within each of the above two subgroups of baseline Mayo score, predicted placebo‐adjusted clinical remission rates were similar between each dose and the corresponding Cav,ss quartile, indicating similar dose and concentration response relationships within each subgroup.
Discussion
Exposure–response analyses from this 8‐week, phase 2 induction study using a 30‐fold dose range of tofacitinib provided the first definitive characterization of the relationship between tofacitinib dose and plasma concentration metrics and induction efficacy, and also provided a basis for selection of the 10 mg b.d. dose as the induction dose for phase 3 studies. The analysis provided further understanding of the predictors of week 8 induction efficacy, such as baseline disease severity. No significant change in tofacitinib exposure was observed over the course of the study in individual patients. Disease activity at baseline was not a determinant of tofacitinib clearance, unlike biologic drugs that are susceptible to higher clearance (potentially resulting in sub‐therapeutic exposure) in patients with high disease activity. In addition, in longer‐term studies in other indications such as rheumatoid arthritis, tofacitinib exposures have been stable over time 19. Exposure–response relationships were characterized in these analyses for three key efficacy endpoints: clinical remission (currently accepted registration endpoint), clinical response (primary endpoint in this phase 2 study) and mucosal healing (a commonly used and important endpoint in UC clinical trials). Predictions from dose–response models for all three endpoints indicated that tofacitinib was efficacious at 10 and 15 mg b.d. doses.
The 10 mg b.d. dose was selected for evaluation in phase 3 induction studies, given that the predicted increment in efficacy between 10 mg b.d. and 15 mg b.d. was small (based on the clinical remission endpoint). Dose, Cav,ss and Ctrough,ss performed similarly as predictors for each clinical endpoint, based on several measures, including model fit criteria, predictive checks, parameter estimates and comparison of predictions from the models. These analyses provide strong evidence that tofacitinib dose and plasma concentration are similarly predictive of efficacy during the 8‐week induction period of the study. Covariate analysis indicated that baseline Mayo score was the most important disease severity measure impacting efficacy, for all three efficacy endpoints. While this effect was significant for clinical remission and mucosal healing, it did not reach statistical significance for clinical response. This is consistent with the nature of the remission and mucosal healing endpoints that are based on patient status at the end of the study, whereas clinical response is calculated as a change from baseline and therefore not influenced to the same extent by baseline values. The effect of baseline disease activity on efficacy was not due to differences in exposure, since baseline disease severity did not influence the pharmacokinetics of tofacitinib.
Characterization of exposure–response of tofacitinib on primary and key secondary efficacy endpoints in this 8‐week induction study indicated that plasma concentrations and dose were similarly predictive of efficacy, and pharmacokinetic data indicated similar plasma concentrations in individual patients at the start and end of therapy. Therefore, plasma concentrations in individual patients did not provide additional predictive value for efficacy beyond that provided by tofacitinib dose. Baseline Mayo score was an important determinant of efficacy at week 8 in these patients with UC.
Competing Interests
D.R.M. is president of Projections Research Inc., a consulting company for the pharmaceutical industry, and was a paid contractor to Pfizer for pharmacokinetic analysis included in this manuscript. A.M., M.K.S., S.W.M., C.S. and W.N. are employees of, and hold stocks and shares with, Pfizer Inc. A.H. was an employee of Pfizer Inc at the time the study was conducted. Medical writing support under the guidance of the authors was provided by Daniel Binks PhD at CMC Connect, a division of Complete Medical Communications, Macclesfield, UK and was funded by Pfizer Inc, New York, NY, USA in accordance with Good Publication Practice (GPP3) guidelines (Ann Intern Med 2015; 163:461–4).
All aspects of this study were funded by Pfizer Inc. Authors employed by Pfizer were involved in the study design and in the collection, analysis and interpretation of data.
A.M. is the guarantor for this article and takes responsibility for the integrity of the work as a whole.
Contributors
A.M.: data analysis, writing and critical review of the manuscript. A.H.: data analysis and critical review of the manuscript. M.K.S.: interpretation and critical review of the manuscript. S.W.M.: interpretation and critical review of the manuscript. D.R.M.: data analysis and interpretation, critical review of the manuscript. C.S.: interpretation and critical review of the manuscript. W.N.: interpretation and critical review of the manuscript. All authors had access to the study data, and reviewed and approved the final manuscript.
Supporting information
Figure S1 Observed and predicted plasma tofacitinib concentrations vs. time by dose group following the first study dose (+) and the last study dose at the week 8 visit (o). The y‐axis is shown on a log scale. The solid line represents the median of 500 simulated trials and the shaded region represents 95% prediction intervals. b.d., twice daily
Figure S2 Proportion of patients achieving clinical response at week 8 by tofacitinib dose, Cav,ss and Ctrough,ss. Error bars represent 95% confidence intervals. b.d., twice daily; Cav,ss, average plasma drug concentration during a dosing interval at steady state; Ctrough,ss, trough plasma concentration at steady state; N, number of patients
Figure S3 Proportion of patients with mucosal healing at week 8 by tofacitinib dose, Cav,ss and Ctrough,ss. Error bars represent 95% confidence intervals. b.d., twice daily; Cav,ss, average plasma drug concentration during a dosing interval at steady state; Ctrough,ss, trough plasma concentration at steady state; N, number of patients
Figure S4 Change from baseline in Mayo score at week 8 by dose and quartiles of Cav,ss b.d., twice daily; Cav,ss, average plasma drug concentration during a dosing interval at steady state
Figure S5 Model‐predicted and observed proportions of patients with clinical response (A) and mucosal healing (B) as a function of tofacitinib dose or Cav,ss. Symbols and error bars represent observed proportion and corresponding 95% confidence interval, and solid line and shaded region represent the median prediction and 95% prediction intervals. b.d., twice daily; Cav,ss, average plasma drug concentration during a dosing interval at steady state
Supporting info item
Mukherjee, A. , Hazra, A. , Smith, M. K. , Martin, S. W. , Mould, D. R. , Su, C. , and Niezychowski, W. (2018) Exposure–response characterization of tofacitinib efficacy in moderate to severe ulcerative colitis: Results from a dose‐ranging phase 2 trial. Br J Clin Pharmacol, 84: 1136–1145. doi: 10.1111/bcp.13523.
ClinicalTrials.gov number: NCT00787202
References
- 1. Baumgart DC, Carding SR. Inflammatory bowel disease: cause and immunobiology. Lancet 2007; 369: 1627–1640. [DOI] [PubMed] [Google Scholar]
- 2. Baumgart DC, Sandborn WJ. Inflammatory bowel disease: clinical aspects and established and evolving therapies. Lancet 2007; 369: 1641–1657. [DOI] [PubMed] [Google Scholar]
- 3. Langholz E, Munkholm P, Davidsen M, Binder V. Course of ulcerative colitis: analysis of changes in disease activity over years. Gastroenterology 1994; 107: 3–11. [DOI] [PubMed] [Google Scholar]
- 4. Peyrin‐Biroulet L, Lemann M. Review article: remission rates achievable by current therapies for inflammatory bowel disease. Aliment Pharmacol Ther 2011; 33: 870–879. [DOI] [PubMed] [Google Scholar]
- 5. Gisbert JP, Panes J. Loss of response and requirement of infliximab dose intensification in Crohn's disease: a review. Am J Gastroenterol 2009; 104: 760–767. [DOI] [PubMed] [Google Scholar]
- 6. Arias MT, Vande Casteele N, Vermeire S, de Buck van Overstraeten A, Billiet T, Baert F, et al A panel to predict long‐term outcome of infliximab therapy for patients with ulcerative colitis. Clin Gastroenterol Hepatol 2015; 13: 531–538. [DOI] [PubMed] [Google Scholar]
- 7. Changelian PS, Moshinsky D, Kuhn CF, Flanagan ME, Munchhof MJ, Harris TM, et al The specificity of JAK3 kinase inhibitors. Blood 2008; 111: 2155–2157. [DOI] [PubMed] [Google Scholar]
- 8. Flanagan ME, Blumenkopf TA, Brissette WH, Brown MF, Casavant JM, Shang‐Poa C, et al Discovery of CP‐690,550: a potent and selective Janus kinase (JAK) inhibitor for the treatment of autoimmune diseases and organ transplant rejection. J Med Chem 2010; 53: 8468–8484. [DOI] [PubMed] [Google Scholar]
- 9. Dowty ME, Lin J, Ryder TF, Wang W, Walker GS, Vaz A, et al The pharmacokinetics, metabolism, and clearance mechanisms of tofacitinib, a Janus kinase inhibitor, in humans. Drug Metab Dispos 2014; 42: 759–773. [DOI] [PubMed] [Google Scholar]
- 10. Pfizer Inc . XELJANZ prescribing information. Available at http://labeling.pfizer.com/ShowLabeling.aspx?id=959. Updated 2017 (last accessed 30 October 2017).
- 11. Sandborn WJ, Ghosh S, Panes J, Vranic I, Su C, Rousell S, et al Tofacitinib, an oral Janus kinase inhibitor, in active ulcerative colitis. N Engl J Med 2012; 367: 616–624. [DOI] [PubMed] [Google Scholar]
- 12. D'Haens G, Sandborn WJ, Feagan BG, Geboes K, Hanauer SB, Irvine EJ, et al A review of activity indices and efficacy end points for clinical trials of medical therapy in adults with ulcerative colitis. Gastroenterology 2007; 132: 763–786. [DOI] [PubMed] [Google Scholar]
- 13. Rutgeerts P, Sandborn WJ, Feagan BG, Reinisch W, Olson A, Johanns J, et al Infliximab for induction and maintenance therapy for ulcerative colitis. N Engl J Med 2005; 353: 2462–2476. [DOI] [PubMed] [Google Scholar]
- 14. Beal S, Sheiner LB, Boeckmann AJ, Bauer RJ. NONMEM user's guides (1989–2009). Ellicot City, MD: Icon Development Solutions, 2009. [Google Scholar]
- 15. R Development Core Team . R: A language and environment for statistical computing. Vienna, Austria: The R Foundation for Statistical Computing, 2011. [Google Scholar]
- 16. Harding SD, Sharman JL, Faccenda E, Southan C, Pawson AJ, Ireland S, et al The IUPHAR/BPS Guide to PHARMACOLOGY in 2018: updates and expansion to encompass the new guide to IMMUNOPHARMACOLOGY. Nucl Acids Res 2018; 46: D1091–D1106. [DOI] [PMC free article] [PubMed] [Google Scholar]
- 17. Alexander SP, Fabbro D, Kelly E, Marrion N, Peters JA, Benson HE, et al The Concise Guide to PHARMACOLOGY 2015/16: Enzymes. Br J Pharmacol 2015; 172: 6024–6109. [DOI] [PMC free article] [PubMed] [Google Scholar]
- 18. Alexander SPH, Fabbro D, Kelly E, Marrion NV, Peters JA, Faccenda E, et al The Concise Guide to PHARMACOLOGY 2017/18: Catalytic receptors. Br J Pharmacol 2017; 174: S225–S271. [DOI] [PMC free article] [PubMed] [Google Scholar]
- 19. Wollenhaupt J, Silverfield J, Lee EB, Curtis JR, Wood SP, Soma K, et al Safety and efficacy of tofacitinib, an oral Janus kinase inhibitor, for the treatment of rheumatoid arthritis in open‐label, longterm extension studies. J Rheumatol 2014; 41: 837–852. [DOI] [PubMed] [Google Scholar]
Associated Data
This section collects any data citations, data availability statements, or supplementary materials included in this article.
Supplementary Materials
Figure S1 Observed and predicted plasma tofacitinib concentrations vs. time by dose group following the first study dose (+) and the last study dose at the week 8 visit (o). The y‐axis is shown on a log scale. The solid line represents the median of 500 simulated trials and the shaded region represents 95% prediction intervals. b.d., twice daily
Figure S2 Proportion of patients achieving clinical response at week 8 by tofacitinib dose, Cav,ss and Ctrough,ss. Error bars represent 95% confidence intervals. b.d., twice daily; Cav,ss, average plasma drug concentration during a dosing interval at steady state; Ctrough,ss, trough plasma concentration at steady state; N, number of patients
Figure S3 Proportion of patients with mucosal healing at week 8 by tofacitinib dose, Cav,ss and Ctrough,ss. Error bars represent 95% confidence intervals. b.d., twice daily; Cav,ss, average plasma drug concentration during a dosing interval at steady state; Ctrough,ss, trough plasma concentration at steady state; N, number of patients
Figure S4 Change from baseline in Mayo score at week 8 by dose and quartiles of Cav,ss b.d., twice daily; Cav,ss, average plasma drug concentration during a dosing interval at steady state
Figure S5 Model‐predicted and observed proportions of patients with clinical response (A) and mucosal healing (B) as a function of tofacitinib dose or Cav,ss. Symbols and error bars represent observed proportion and corresponding 95% confidence interval, and solid line and shaded region represent the median prediction and 95% prediction intervals. b.d., twice daily; Cav,ss, average plasma drug concentration during a dosing interval at steady state
Supporting info item