

Abstract
Aims
To identify patterns of opioid analgesic use and determine predictors of persistent opioid use among people without cancer.
Methods
A population‐based cohort study of Australians initiating prescription opioids from July 2013 to December 2015 was conducted using data from a random 10% sample of people who accessed medicines through Australia's Pharmaceutical Benefits Scheme. A 12‐month retrospective period was used to define opioid initiation, exclude people with cancer and determine comorbidities. Persistent use over 12 months since initiation was identified through group‐based trajectory modelling. Odds ratios (OR) and 95% confidence intervals (CIs) for predictors of opioid persistence were estimated using logistic regression.
Results
The cohort consisted of 431 963 people without cancer who initiated opioids. A total of 11 323 (2.6%) persistent opioid users were identified. Predictors of persistence included initiation with transdermal formulations (OR 4.2, 95% CI 3.9–4.5), or initiation with total oral morphine equivalents (OME) ≥ 750 mg (3.7, 3.3–4.1), having depression (1.6, 1.5–1.7) or psychotic illness (2.0, 1.9–2.2). Previous dispensing of paracetamol (2.0, 1.9–2.1), pregabalin (2.0, 1.8–2.1) and benzodiazepines (1.53, 1.4–1.6) predicted persistence. Compared to people aged 18–44 years, those ≥75 years were 2.5 (2.3–2.6) times more likely to be persistent users.
Conclusions
Patient‐specific characteristics (older age, prior history of mental health comorbidities and use of non‐opioid analgesics) and prescriber choice of initial opioid (transdermal formulation and higher total OMEs) were found to strongly predict persistent use. This information may help prescribers target monitoring and early intervention efforts in order to prevent harms associated with the long‐term use of opioids.
Keywords: non‐cancer pain, opioid analgesics, persistent use, pharmacoepidemiology, predictors
What is Already Known about this Subject
Long‐term opioid analgesic use for chronic non‐cancer pain is associated with uncertain clinical benefits but clear harms.
In the United States, characteristics of the initial opioid prescription, such as number of days supplied and cumulative dose ≥700 mg oral morphine equivalents (OMEs), predicted continued opioid use.
What this Study Adds
Of people without cancer who initiate opioids in Australia, 2.6% go on to become persistent users over a 12‐month period.
Patient‐specific characteristics (older age, prior history of mental health comorbidities and use of non‐opioid analgesics) and initial prescriber choice of opioid (transdermal formulation and higher OMEs) were found to strongly predict persistent opioid use.
Introduction
Chronic non‐cancer pain (CNCP) is highly prevalent worldwide 1 and has been shown to have a marked negative effect on functional capacity and quality of life 2, 3. Treatment of CNCP requires individualization of both non‐pharmacological and pharmacological interventions; however, prescribing opioids for CNCP remains controversial and multiple best‐practice guidelines have been published to minimize inappropriate use and harms 4, 5. It is estimated that the worldwide use of opioid analgesics has doubled over the past decade to 7.35 billion defined daily doses per annum 6. Opioid utilization in the United States (US), Canada, Western Europe, Australia and New Zealand is particularly high. These countries collectively account for 17% of the world's population but 92% of overall opioid utilization 7. Although the increase in utilization alone is not necessarily problematic, long‐term opioid analgesic use has been associated with excess morbidity and mortality worldwide, including harm resulting from misuse 8, 9, 10, 11.
Despite uncertainty about the benefits of long‐term opioid analgesic use in the treatment of CNCP, there is clear evidence of significant harms 12. In order to reduce harm from long‐term opioid analgesic use, it is firstly necessary to understand who is at greatest risk of long‐term or persistent use. A recent US study found that characteristics of the initial opioid prescription such as number of days supplied and cumulative dose ≥700 mg oral morphine equivalents (OMEs) predicted continued opioid use for up to 3 years following treatment of acute pain 13. Furthermore, Quinn et al. 14 found people with depressive disorders had double the risk of transitioning to long‐term opioid use, as did people who were dispensed benzodiazepines prior to opioid initiation. Moreover, Thielke et al. 15 found that the likelihood of long‐term opioid use was increased among those with higher problem opioid risk scores. This score, found to predict problem opioid use, is a composite measure of a range of individual characteristics including age ≤65 years, being a current smoker and having a history of a mental health disorder, hepatitis C, and abuse/dependence with opioids, alcohol or other substances 16. Rogers et al. 17 found that poorer self‐reported physical functional level was the strongest predictor of long‐term opioid use in people with concessional beneficiaries and aged ≥45 years in New South Wales, Australia.
The predictors of long‐term opioid analgesic use have not previously been studied in all of Australia. This knowledge is necessary to enable clinicians to consider and reduce the future risk of harms at the time of treatment initiation. Currently, clinical treatment guidelines recommend that specific tools and instruments (e.g. the Opioid Risk Tool and Screener and Opioid Assessment of Patients with Pain) be used to predict the risk of future aberrant drug‐related behaviours 5. However, these tools do not necessarily identify people who are at greatest risk of long‐term use or harm not associated with aberrant drug‐related behaviours. Therefore, we sought to identify trajectories of prescription opioid analgesic use and determine predictors of persistent opioid analgesic use among people without cancer in Australia.
Methods
Study design and setting
We undertook a retrospective population‐based cohort study of people who initiated prescription opioid analgesics between July 2013 and December 2015 in Australia using data from a random 10% sample of people who accessed medicines through Australia's Pharmaceutical Benefits Scheme (PBS). The PBS is a national government‐funded system that subsidizes prescription medicines for citizens, permanent residents and foreign visitors from countries with reciprocal health care agreements 18. For research purposes, the Australian Government Department of Human Services provides access to a 10% random sample of people accessing medicines through the PBS 18. This sample is considered representative of PBS dispensing for all Australian residents. At the end of 2016, Australia had an estimated total population of 24 million 19.
Since July 2012, all dispensings for PBS‐listed medicines in approved community pharmacies, private hospitals and some public hospitals (excluding dispensings during admission as an inpatient in hospital) have been captured in PBS records. Concessional beneficiaries (e.g. pensioners and low‐income earners) are entitled to subsidized rates on all PBS‐listed medicines and pay a reduced co‐payment amount, while general beneficiaries are entitled to subsidized rates on higher‐cost medicines priced above a set co‐payment amount. As of 1 January 2018, the maximum co‐payment for concessional beneficiaries is AUD6.40 (USD5.02) and AUD39.50 (USD30.97) for general beneficiaries 20. The study period was chosen to reflect the period during which data on dispensings of under co‐payment medicines were first recorded in the PBS dataset. As of 2013, PBS dispensing records are estimated to account for more than 80% of prescription opioid use in Australia 21. The dataset captures medicine information including name, strength, quantity, item code, date dispensed, date prescribed and number of repeats authorized. The dose prescribed, duration of treatment and indication for medicine use are not available.
Study population
Adults aged ≥18 years who were new opioid users between July 2013 and December 2015 were included to allow for a follow‐up period of 12 months (Figure 1). As the dataset does not provide actual age for people ≥100 years, we excluded those who were ≥100 years. New users were defined as those with no preceding opioid dispensings in the 12 months prior to the initial opioid dispensing. As the focus of this study was on people without cancer (i.e. non‐cancer pain), we excluded those with evidence of a dispensing for a cancer medicine (Appendix S1) at baseline or in the 12 months prior to initiating prescription opioid analgesics. We also excluded people who died (n = 9103, 1.6%) during the follow‐up period.
Figure 1.
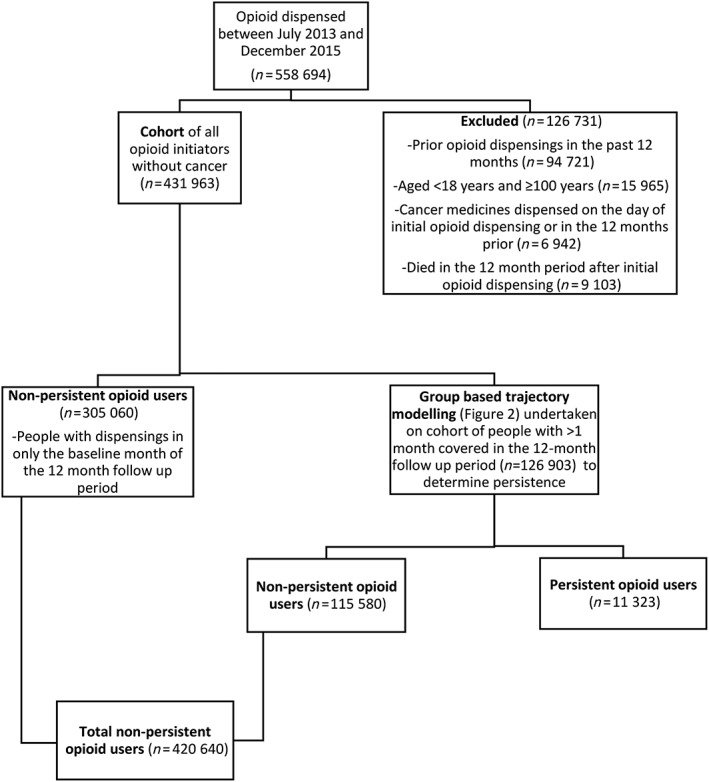
Flow diagram of study cohort
Definition of persistent opioid use
We defined persistent/non‐persistent opioid use using two steps. Firstly, people who were dispensed opioids only at baseline were all categorized as non‐persistent users (Figure 1). For the remainder of the cohort (i.e. those dispensed opioids in at least two months), persistent use was identified through a group‐based trajectory model (GBTM) 22, 23. Although, there are several methods for studying medication persistence, we opted to use GBTM to define persistence as prior research has found that the number of people identified as continuing long‐term use of opioids varies depending on the explicit criteria used to define persistence 24. Additionally, when using explicit criteria, there is no single appropriate definition of long‐term opioid use and the definition applied should depend on the specific research question 24. Consequently, we opted to use a GBTM which avoids the need for explicit criteria defining persistence to be specified. Instead, persistence was defined by the patterns of opioid dispensings for the cohort over a 12‐month period following initiation 25, 26. For each month, we created a binary variable that indicates whether an opioid dispensing occurred during that month or not. Using patterns of dispensings, people were assigned to various trajectories based on the highest estimated probability that they belong in that group. A third‐order trajectory model with four groups was determined to have the best overall model fit based on the highest Bayesian information criterion (BIC) value, convergence and an estimated probability of group membership of ≥5% 23. Those assigned to Trajectory 4 (shown in Figure 2) were defined as persistent users, while those assigned to Trajectories 1–3 were collectively defined as non‐persistent users. The total number of non‐persistent users in the cohort included individuals who were only dispensed opioids at baseline as well as those assigned to Trajectories 1–3.
Figure 2.
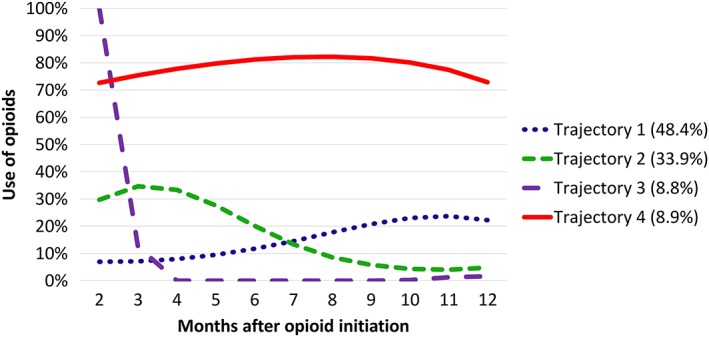
Trajectories of opioid use in people dispensed opioids in >1 month. Persons in Trajectory 4 (8.9% of those included in the group‐based trajectory model) persistently used opioids in the 12 months following initiation. Persons in Trajectories 1 (48.4%), 2 (33.9%) and 3 (8.8%) were collectively considered as non‐persistent users, as the patterns of the trajectories suggest minimal opioid dispensings over the 12‐month follow‐up
Baseline opioid use
The opioid at the initial dispensing was categorized as either strong or weak. Strong opioids included 27: morphine (Anatomical Therapeutic Chemical [ATC] code N02AA01), oxycodone (N02AA05, N02AA55), buprenorphine (N02AE01), fentanyl (N02AB03), hydromorphone (N02AA03) and methadone (N02AC52). Weak opioids included 27: single‐ingredient codeine (R05DA04) and combination codeine preparations (N02AA59, N02AJ06), tramadol (N02AX02) and tapentadol (N02AX06). Individuals dispensed both a weak and strong opioid at baseline were categorized as having initiated a strong opioid. The route of administration was categorized as oral, transdermal or other (intravenous, subcutaneous or intramuscular injections, buccal, rectal). For the initial opioid dispensing, the total oral morphine equivalent (OME) amount dispensed was calculated using the following formula:
The OME conversion factors (Appendix S2) were adapted from published values by Nielsen et al. 28. The total baseline OME dispensed was categorized into four groups: total OME < 250, 250–499, 500–749 and ≥750. The subsidy level of the initial opioid dispensing was categorized as concessional (marker of lower socioeconomic status) or non‐concessional.
Medical conditions and comorbidities
RxRisk‐V was used to provide a measure of comorbidity for each person 29. The RxRisk‐V tool uses records of dispensed medicines to identify existing medical conditions from 45 ATC code groups. An adaptation of the RxRisk‐V tool was used incorporating ATC codes for newly registered medicines to ensure potential comorbidities were not missed (Appendix S1). Australian findings have previously indicated that the RxRisk‐V tool identified fewer people with cancer compared to the Charlson comorbidity index which is widely used to assess disease burden (43.2% vs. 67.2%) 30 and hence, we developed a more comprehensive indicator of cancer to capture other antineoplastic therapies such as hormonal cancer therapies. Comorbidities of particular interest were depression, psychotic illness, alcohol and nicotine dependence, as these have previously been shown to predict persistent use of opioids 13, 14, 15. The total number of other comorbidities identified using RxRisk‐V (excluding comorbidities of particular interest) were classified into four groups: 0, 1–2, 3–4 and ≥5.
Previous medicine use
To assess previous pain treatment, we also examined use of non‐opioid analgesics at baseline and in the 12 months prior to initiating an opioid analgesic. These included: paracetamol (N02BE01), pregabalin (N03AX16) and non‐steroidal anti‐inflammatory drugs (NSAIDs) (M01AB01–M01AH06). Use of psychotropic medicines that are commonly implicated in opioid overdose 31, 32, were also examined at baseline and in the 12 months prior to opioid initiation and included benzodiazepines (N05BA, N05CD) and stimulants (N06BA, N06BC).
Statistical analyses
Baseline characteristics of the cohort are presented as frequencies and percentages or means and standard deviations (SD). Multivariable logistic regression was used to identify predictors for persistent opioid use compared to non‐persistent use and to calculate adjusted odds ratios (ORs) and 95% confidence intervals (95% CI). Predictors included age, sex, concessional status, characteristics of the initial opioid dispensing (strong opioid, total OME dispensed and route of administration), depression, psychotic illness, alcohol dependence, nicotine dependence, migraine, total number of other comorbidities, and prior use of benzodiazepines, paracetamol, NSAIDs, pregabalin and stimulants. Multicollinearity between variables was assessed using variance inflation factors, tolerance and eigenvalues. There was no evidence of multicollinearity between predictors in the final model. The c statistic of the logistic regression model was used to evaluate the explanatory power of the model. All analyses were conducted using SAS Version 9.4 (SAS Institute Inc., Cary, NC, USA).
Sensitivity analyses
We repeated the main analysis by stratifying across three age groups (18–64, 65–84 and ≥85 years) to assess whether the strength of the predictors vary across age. To explore the effect of our definition of persistence, we conducted a sensitivity analysis by using an alternative definition of persistence which identifies non‐persistence based on gaps between months with opioid dispensings. All opioid initiators without cancer who had ≥3 consecutive months without an opioid dispensing were defined as non‐persistent users. Those who had a gap of ≤2 consecutive months without an opioid dispensing in the 12‐month period were defined as persistent users.
Ethical review
The study was approved by the Monash University Human Research Ethics Committee.
Results
Cohort
The cohort consisted of 431 963 people without cancer who were initiated on opioids (Figure 1). Baseline characteristics are described in Table 1. The mean (SD) age for the final cohort was 48.4 (18.4) years and 53.0% were female. The mean (SD) total number of comorbidities (excluding those of particular interest) for the cohort was 2.3 (2.1). Paracetamol/codeine was the most common opioid initiated (57.8%), followed by oxycodone (26.1%). The 9103 people that were excluded from the study due to death were older (79 (13.7) years) and had higher mean total OME dispensed at baseline (270 mg (380.55)) compared to the main study cohort. Additionally, the oral route of administration was most common in those who died during the follow‐up period, but not as common as it was in the main cohort (67.5% vs. 98.3%). Other routes of administration (intravenous, subcutaneous or intramuscular injections, buccal, rectal) were more common than in the main cohort (16.4% vs. 0.1%), as was the transdermal route (16.2% vs. 1.6%).
Table 1.
Baseline characteristics of cohort at baseline and in the 365 days prior to opioid initiation
|
All
(n = 431 963) |
Non‐persistent opioid users (n = 420 640) | Persistent opioid users (n = 11 323) | |
|---|---|---|---|
| n (%) or mean ± standard deviation | |||
| Demographic characteristics | |||
| Age, years | 48.4 ± 18.4 | 48.0 ± 18.2 | 64.4 ± 18.3 |
| 18–44 | 195 859 (45.3) | 193 970 (46.1) | 1889 (16.7) |
| 45–54 | 74 058 (17.1) | 72 572 (17.3) | 1486 (13.1) |
| 55–64 | 67 139 (15.5) | 65 283 (15.5) | 1856 (16.4) |
| 65–74 | 53 379 (12.4) | 51 279 (12.2) | 2100 (18.6) |
| 75+ | 41 528 (9.6) | 37 536 (8.9) | 3992 (35.3) |
| Sex (female) | 228 830 (53.0) | 222 251 (52.8) | 6579 (58.1) |
| Concessional | 163 035 (37.7) | 154 720 (36.8) | 8315 (73.4) |
| Characteristics of opioid initiated | |||
| Strong opioid | 120 704 (27.9) | 115 308 (27.4) | 5396 (47.7) |
| Route | |||
| Oral | 424 444 (98.3) | 414 979 (98.7) | 9465 (83.6) |
| Transdermal | 6964 (1.6) | 5136 (1.2) | 1828 (16.1) |
| Other a | 555 (0.1) | 525 (0.1) | 30 (0.3) |
| Opioid dispensed | |||
| Paracetamol/codeine | 249 711 (57.8) | 246 466 (58.6) | 3245 (28.7) |
| Tramadol | 52 656 (12.2) | 50 025 (11.9) | 2631 (23.2) |
| Buprenorphine | 5872 (1.4) | 4253 (1.0) | 1619 (14.3) |
| Morphine | 1380 (0.3) | 1211 (0.3) | 169 (1.5) |
| Oxycodone | 112 554 (26.1) | 109 081 (25.9) | 3473 (30.7) |
| Total oral morphine equivalents (OME) in mg | |||
| Total OME | 130.8 ± 182.8 | 127.3 ± 172.7 | 262.4 ± 385.6 |
| Total OME < 250 | 395 578 (91.6) | 387 098 (92.0) | 8480 (74.9) |
| Total OME 250–499 | 24 496 (5.7) | 22 752 (5.4) | 1744 (15.4) |
| Total OME 500–749 | 6840 (1.6) | 6345 (1.5) | 495 (4.4) |
| Total OME ≥ 750 | 5049 (1.2) | 4445 (1.1) | 604 (5.3) |
| Comorbidities b | |||
| Total number | 2.3 ± 2.1 | 2.3 ± 2.0 | 5.1 ± 2.8 |
| Depression | 80 429 (18.6) | 76 152 (18.1) | 4277 (37.8) |
| Psychotic illness | 10 506 (2.4) | 9446 (2.3) | 1060 (9.4) |
| Alcohol dependence | 803 (0.2) | 763 (0.2) | 40 (0.4) |
| Migraine | 7019 (1.6) | 6776 (1.6) | 243 (2.2) |
| Nicotine dependence | 10 206 (2.4) | 9778 (2.3) | 428 (3.8) |
| Prior medication use | |||
| Benzodiazepines | 54 896 (12.7) | 51 701 (12.3) | 3195 (28.2) |
| Paracetamol | 57 768 (13.4) | 52 496 (12.5) | 5272 (46.6) |
| NSAIDs | 118 346 (27.4) | 114 268 (27.2) | 4078 (36.0) |
| Pregabalin | 11 733 (2.7) | 10 510 (2.5) | 1223 (10.8) |
| Stimulants | 1503 (0.4) | 1473 (0.4) | 30 (0.3) |
NSAIDs, non‐steroidal anti‐inflammatory drugs
Other route includes buccal, rectal and parental routes
Determined by RxRisk‐V and total number of comorbidities excludes the specific comorbidities listed in table
Description of persistent opioid users and non‐persistent opioid users
A total of 11 323 (2.6%) persistent opioid users were identified (Trajectory 4 in Figure 2). All individuals who were identified as persistent users had dispensings in 7 or more months and 53.3% had dispensings in 10 or more months during the 12‐month period. In total, 80.1% of persistent users did not have longer than one 3‐month period without an opioid dispensing. The mean age of persistent users was 64.4 (18.3) years and 58.1% were female (Table 1). Non‐persistent opioid users (n = 420 640) had a mean (SD) age of 48.0 (18.2) and 52.8% were female. Paracetamol was used by 46.6% of persistent opioid users, compared to 12.5% of non‐persistent opioid users. The mean total number of comorbidities for persistent users was 5.1 (2.8) compared to 2.3 (2.0) for non‐persistent users. History of depression and psychotic illness was more common among persistent opioid users than non‐persistent opioid users (37.8% vs. 18.1%, 9.4% vs. 2.3%). A strong opioid was prescribed to 47.7% of persistent users at baseline and 27.4% of non‐persistent users. The oral route of administration was most common (83.6% for persistent users vs. 98.7% for non‐persistent users), followed by transdermal formulations (16.1% vs. 1.2%). Of the 16.1% of persistent users prescribed transdermal products at initiation, 89% of these were initiated on buprenorphine patches, while 11% were initiated on fentanyl patches. The mean (SD) total OME dispensed at baseline for persistent users was 262.4 mg (385.6) compared to 127.3 mg (172.7) in the non‐persistent group. Oxycodone was the most commonly dispensed opioid (30.7%) at baseline in the persistent group, whilst paracetamol/codeine was the most commonly dispensed opioid (58.6%) in the non‐persistent group.
Predictors of persistent opioid use
Predictors of persistent opioid use are shown in Table 2. The c statistic of the logistic regression model was 0.83. Compared to people aged 18–44 years, those ≥75 years were 2.5 times more likely (95% CI 2.27–2.64) to be persistent opioid users. A baseline total OME ≥ 750 mg was the strongest predictor of persistent opioid use compared to a baseline total OME >250 (OR = 3.68, 95% CI 3.34–4.06). Other predictors of persistence include being dispensed transdermal opioids (OR = 4.21, 95% CI 3.93–4.51), having depression (OR = 1.59, 95% CI 1.52–1.66), psychotic illness (OR = 2.01, 95% CI 1.87–2.17) and nicotine dependence (OR = 1.65, 95% CI 1.48–1.83). Previous use of non‐opioid analgesics including NSAIDs (OR = 1.22, 95% CI 1.17–1.27), paracetamol (OR = 1.96, 95% CI 1.86–2.05) and pregabalin (OR = 1.96, 95% CI 1.83–2.10), predicted opioid persistence. Similarly, previous use of benzodiazepines (OR = 1.48, 95% CI 1.41–1.55) also predicted opioid persistence. Concessional beneficiaries were 1.9 times more likely (95% CI 1.80–2.00) to be persistent opioid users.
Table 2.
Predictors of persistent opioid use (n = 11 323) compared to non‐persistent users (n = 420 640)
| Adjusted odds ratio a | 95% Confidence interval | |
|---|---|---|
| Demographics | ||
| Age (years) | ||
| 18–44 | Reference | |
| 45–54 | 1.65 | 1.54–1.77 |
| 55–64 | 1.75 | 1.63–1.88 |
| 65–74 | 1.47 | 1.36–1.58 |
| ≥75 | 2.45 | 2.27–2.64 |
| Sex | ||
| Male vs female | 1.04 | 0.99–1.08 |
| Concessional vs general status | 1.90 | 1.80–2.00 |
| Baseline opioid characteristics | ||
| Strong vs weak opioid | 1.11 | 1.06–1.16 |
| Route | ||
| Oral | Reference | |
| Transdermal | 4.21 | 3.93–4.51 |
| Other b | 0.67 | 0.46–0.97 |
| Total OME in mg | ||
| <250 | Reference | |
| 250–499 | 2.02 | 1.90–2.14 |
| 500–749 | 2.27 | 2.05–2.51 |
| ≥750 | 3.68 | 3.34–4.06 |
| Comorbidities c | ||
| Total | ||
| 0 | Reference | |
| 1–2 | 0.84 | 0.76–0.92 |
| 3–4 | 1.15 | 1.04–1.27 |
| ≥5 | 1.32 | 1.18–1.46 |
| Depression | 1.59 | 1.52–1.66 |
| Psychotic illness | 2.01 | 1.87–2.17 |
| Alcohol dependence | 1.18 | 0.84–1.64 |
| Migraine | 1.14 | 0.99–1.30 |
| Nicotine dependence | 1.65 | 1.48–1.83 |
| Prior medication use | ||
| Benzodiazapines | 1.48 | 1.41–1.55 |
| Paracetamol | 1.96 | 1.86–2.05 |
| NSAIDs | 1.22 | 1.17–1.27 |
| Pregabalin | 1.96 | 1.83–2.10 |
| Stimulants | 0.83 | 0.57–1.20 |
Bold values indicate statistical significance at P < 0.05
NSAIDs, non‐steroidal anti‐inflammatory drugs; OME, oral morphine equivalents.
Adjusted for all the other variables listed in this table
Other route includes buccal, rectal and parental routes
Determined by RxRisk‐V and total number of comorbidities excludes the specific comorbidities listed in table
Sensitivity analyses
In a sensitivity analysis using an alternative definition of persistent opioid use, the predictors remained the same when compared to the main analysis (Appendix S3).
In sensitivity analyses where we stratified by age (Appendix S4), we found that the majority of the predictors of persistence were the same as the main analysis, with key differences in the strength of the prediction described below for each age sub‐group.
<65 years
In the sub‐group aged <65 years, baseline total OME ≥ 750 mg was the strongest predictor of persistence (OR = 5.97, 95% CI 5.29–6.73) and prior use of benzodiazepines (OR = 1.73, 95% CI 1.62–1.86) and pregabalin (OR 2.81, 95% CI 2.55–3.10) were stronger predictors than in the main analysis. Being male predicted persistence in the <65‐year sub‐group analysis (OR = 1.28, 95% CI 1.20–1.35), whilst sex did not predict persistence in the main analysis.
65–84 years
In the sub‐group aged 65–84 years, being initiated on a transdermal formulation was the strongest predictor of persistence (OR = 4.24, 95% CI 3.85–4.68). Being initiated with a baseline total OME ≥ 750 mg was found to be a weaker predictor of persistence compared to the main analysis (OR = 2.20, 95% CI 1.84–2.63). Prior benzodiazepine use was also a weaker predictor of persistence compared to the main analysis (OR = 1.27, 95% CI 1.18–1.37). Being female predicted persistence (OR = 0.90, 95% CI 0.85–0.97), whilst sex did not predict persistence in the main analysis.
≥85 years
In the sub‐group aged ≥85 years, being initiated on a transdermal formulation was the strongest predictor of persistence (OR = 3.47, 95% CI 3.02–3.98). Additionally, being initiated on a strong opioid was found to be a stronger predictor in this sub‐analysis (OR = 1.51, 95% CI 1.32–1.73), whilst a baseline total OME ≥ 750 mg was not found to predict persistence (OR = 0.94, 95% CI 0.62–1.40). Prior benzodiazepine use was a weaker predictor of persistence compared to the main analysis (OR = 1.20, 95% CI 1.06–1.36). Being female predicted persistence (OR = 0.71, 95% CI 0.63–0.81) in this sub‐analysis, whilst sex did not predict persistence in the main analysis.
Discussion
In this nationally representative cohort study of people initiating opioids in Australia, 2.6% of people without cancer were identified as persistent users during a 12‐month period. Opioid initiation with a transdermal formulation and higher total OMEs strongly predicted persistent use. Patient characteristics including older age, prior history of mental health comorbidities and use of non‐opioid analgesics were also found to predict persistent use of opioids. Given that long‐term opioid use is associated with several harms including addiction, motor vehicle accidents, overdose and death 12, the findings from our study may be useful in guiding clinicians to better mitigate harms by identifying individuals at risk of long‐term opioid use at the time of treatment initiation.
Our estimate of the percentage of people who are persistent opioid users is lower than a Canadian study where 10% of all individuals initiated on opioids for non‐cancer pain in British Columbia between 2005 and 2012 were identified as long‐term users (received at least 6 months of opioid therapy) 33. Although the percentage of persistent opioid users was lower in our study, we defined persistence over a longer time period of 12 months. A Norwegian study using claims data found that 9.8% of people without cancer who were initiated on opioids were persistent opioid users using a wide definition of persistence (received a yearly total amount of opioids exceeding either 180 defined daily dose (DDD) or 4500 mg OME or both, in at least three out of four quarters of the year) 34. Using a strict definition of persistence (received 10 or more dispensings of opioids, distributed in all quarters of the year, and receiving a total amount of opioids exceeding 730 DDDs or 18 000 mg OME per year), identified only 1.3% of opioid initiators as persistent users 34. Our definition of persistence using GBTM avoids the need for explicit criteria to define persistence. Instead, persistence is defined by the patterns of opioid dispensings for the cohort. This was important as Svendsen et al. 24 found that there is no single appropriate definition for long‐term opioid use when using explicit criteria.
The complex bi‐directional relationship between pain and depression is well documented in the literature 33, 34, 35. Schaakxs et al. 36 found that pain, based on a combination of pain intensity and pain disability experienced, was a strong risk factor for depression. Additionally, depression is associated with developing chronic pain 34. People with chronic pain and depression report worse pain severity and functioning compared to those with either condition alone 35. Goesling et al. 37 found that people with depression were equally likely to be using opioids regardless of pain severity and were more likely to take them at higher levels of functioning compared to people without depression. Our finding that people with mental health comorbidities are at greater risk of long‐term opioid use are consistent with US studies 14, 15. Hence, our study demonstrates that mental health comorbidities increase the risk of long‐term opioid use and further supports current guidelines 5 recommending that clinicians should exercise additional caution and increased monitoring when prescribing opioids for people with mental health conditions. Our findings are particularly important as major depression and the use of psychotropic medication have been found to be associated with an increased risk of opioid misuse 38. Additionally, Scherrer et al. 39 found that people who were in a period of depression remission and initiated opioids had double the risk of depression recurrence compared to those not taking opioids. Furthermore, studies in Australia have found that a history of mental health disorders is common among people who died due to prescription opioid overdose 40, 41. Therefore, prescribers need to establish a comprehensive multimodal management plan for people with mental health comorbidities and if a trial with opioids is necessary, consider ongoing review of opioid effectiveness, dose and duration.
Use of transdermal formulations and higher total OME dispensed at baseline were both found to be strong predictors for persistent opioid use in our study. Similarly, Shah et al. identified that people who were initiated on higher doses of opioids were more likely to continue taking opioids for ≥1 year 13. Although there is no ceiling dose for opioids, recommendations from recent guidelines are to start at low doses and titrate up as required to a maximum daily OME dose of 90 mg, reviewing benefit and monitoring for adverse effects at each stage 4, 42, 43. The prescribed dose and indication for the initial opioid dispensed were not available and, therefore, it was not possible to evaluate concordance with dosing recommendations. It is possible that higher total OME may be prescribed at initiation selectively to those that have chronic pain and may therefore invoke selection bias. However, this prescribing practice is not consistent with current treatment guidelines 4, 42, 43 that suggest that if an opioid is trialled, it should be trialled at the lowest dose and for the shortest expected duration, and therefore may highlight a discrepancy between guideline recommendations and current practice. Notably, a previous study by Gadzhanova et al. evaluating the proportion of residents in care homes for the elderly who were opioid‐naive in the 4 weeks prior to patch initiation, found that of those who were initiated on a fentanyl or buprenorphine patch, 34% and 49% were opioid naive, respectively 44. Interestingly, in our study, opioid initiation with a transdermal formulation was found to be the strongest predictor of long‐term opioid use, particularly in the 65–84‐year age group. As the characteristics of the opioid initiated are selected by prescribers, our study highlights the important role of the initial opioid prescriber in contributing to the continuation of opioid use in the long term.
We found that people aged between 45 and 54 years of age were 1.7 times more likely to be persistent opioid users than those aged 18–44 years. In previous studies, younger age has been associated with opioid persistence following surgical procedures 45, 46. Younger age has also been associated with the greatest risk of harm, particularly dependence and overdose 47, 48. In Australia, the largest proportion of opioid overdose deaths (in those without an injecting history), occur among people aged 40–49 years 40, 41. Although younger age has been associated with an increased risk of harm, we identified that individuals ≥75 years of age were most likely to be persistent opioid users. Similarly, a study in Germany found that those aged <40 years with CNCP had an increased risk of opioid discontinuation compared to those aged >70 years 49. One reason for the higher rates of persistent use among older people is the higher prevalence of severe and chronic pain among people in this age group 50, 51. Guidelines recommend more cautious prescribing of opioids in older individuals 5, as they are more susceptible to adverse events from opioids such as confusion and falls 11. This is due to increased comorbidities and pharmacokinetic changes (e.g. reduced renal clearance) and, hence, use of lower opioid doses is recommended 5, 42. Encouragingly, in our sub‐group analyses, a baseline OME ≥ 750 mg (e.g. oxycodone 20 mg, 28 tablets) was not found to be a predictor of persistent use among those aged ≥85 years.
Concessional status (a marker of lower socioeconomic status) was also found to be a predictor of long‐term opioid use. Lower socioeconomic status has previously been associated with higher opioid utilization when measured as OME per day 48. It is possible that chronic pain is limiting working ability for people living with CNCP 52, 53. Hence, understanding the patterns of dose escalations in those using long‐term opioids may assist in identifying opioid tolerance and potential markers of problem use. Future research should also investigate the time to dose increases and progression from a weak to a strong opioid among persistent opioid users.
Strengths and limitations
A key strength of our study is that we used data from a 10% random sample of people accessing medicines through the PBS over a time period where under co‐payment data was captured, therefore including the majority of opioid users in the sample. However, our study may not necessarily reflect the characteristics of all persistent prescription opioid users in Australia as non‐subsidized (or private) prescriptions were not captured in this dataset. In 2011, it was estimated that private prescriptions for all medicines represented only 7.2% of community prescriptions 19, therefore it is likely that the majority of medicine dispensings were captured in our dataset. Temporary residents from 11 countries with which Australia has reciprocal health care arrangements are eligible for subsidized prescription which may lead to misclassification of these people as new opioid users or non‐persistent users if they visit for a short period. However, dispensing of opioids to visitors from the 11 countries with reciprocal healthcare arrangements represents a very small percentage of PBS dispensing in Australia. Inclusion of people who died during the follow‐up period would have increased misclassification of persistent users as non‐persistent users. Our results indicate that those who died may have been initiated on opioids for palliative purposes, given that use of oral formulations was less common. As we used dispensing data, it is not possible to determine the cause of death for those excluded.
The c statistic (0.83) indicates that the explanatory power of our model was high. However, as this was a database study, we were unable to include predictors such as patient expectations of opioid use which has previously been found to be a strong predictor of persistence at one year 15. We also did not have information on pain intensity, number of days with pain or the dose and indication for opioid treatment. Interestingly, Thielke et al. 15 found that a chronic pain prognostic risk score (calculated from baseline measures of pain intensity, pain‐related interference with activities, number of days with pain in the prior 6 months and widespread pain) did not predict continuing opioid use one year after initiation. Indication for pain was also not available and, therefore, whether certain pain types including back pain or osteoarthritis predict persistent use is unclear.
As we used dispensing data to estimate comorbidities, it is possible that some people may not be receiving pharmacological treatment for a condition or may be taking medicines for conditions not captured by the RxRisk‐V tool and, therefore, we may not have identified all comorbidities. However, we used a validated tool, the RxRisk‐V tool, which has been shown to predict mortality in both Australian and international studies 30, 54, 55. Additionally, Sloan et al. 29 demonstrated that the RxRisk‐V tool categories are stable over time and valid against international classification of diseases (ICD‐9) criterion diagnoses. RxRisk‐V tool has been mapped to ICD‐9/10 codes and the terms used are consistent with the terminology used in these classification systems. Antipsychotic use is considered indicative of psychotic illness in the RxRisk‐V tool; however, in older people this may reflect use for behavioural and psychological symptoms of dementia rather than psychotic illness. Additionally, although we used a comprehensive indicator to exclude people who have cancer, there is a possibility that some people who have cancer may not have had medicines dispensed for cancer and were therefore not captured.
Conclusion
Our study identified that 2.6% of people without cancer who initiate opioids in Australia become persistent users over a 12‐month period. Mental health comorbidities, older age, prior analgesic use, initiation with transdermal formulations, strong opioids and higher total OMEs, all strongly predicted persistent opioid use. Overall, understanding the range of characteristics predicting long‐term opioid use will enable prescribers to target monitoring and early intervention efforts in order to prevent future opioid‐related problems developing. Future studies should explore the time to dose increases and progression from a weak to a strong opioid among persistent opioid users.
Competing Interests
There are no competing interests to declare.
S.L. is supported through an Australian Government Research Training Program Scholarship. J.I. and N.G. are supported by the NHMRC Early Career Fellowship Scheme (grant numbers #1072137 and #1091878). J.S.B. is supported by a NHMRC Dementia Leadership Fellowship (grant number #1140298). The authors would like to acknowledge the Australian Government, Department of Human Services for the provision of the data.
Supporting information
Appendix S1 RxRisk‐V categories
Appendix S2 Oral morphine equivalent (OME) conversion factors
Appendix S3 Predictors of persistent opioid use (n = 9973) compared to non‐persistent users (n = 421 990) defined using an alternative definition of persistence. People who had ≤2 consecutive months without an opioid in the 12‐month period were defined as persistent users
Appendix S4 Predictors of persistent opioid use stratified by age group
Lalic, S. , Gisev, N. , Bell, J. S. , Korhonen, M. J. , and Ilomäki, J. (2018) Predictors of persistent prescription opioid analgesic use among people without cancer in Australia. Br J Clin Pharmacol, 84: 1267–1278. doi: 10.1111/bcp.13556.
References
- 1. Goldberg DS, McGee SJ. Pain as a global public health priority. BMC Public Health 2011; 11: 770. [DOI] [PMC free article] [PubMed] [Google Scholar]
- 2. Andrew R, Derry S, Taylor RS, Straube S, Phillips CJ. The costs and consequences of adequately managed chronic non‐cancer pain and chronic neuropathic pain. Pain Pract 2014; 14: 79–94. [DOI] [PubMed] [Google Scholar]
- 3. Currow DC, Agar M, Plummer JL, Blyth FM, Abernethy AP. Chronic pain in South Australia – population levels that interfere extremely with activities of daily living. Aust N Z J Public Health 2010; 34: 232–239. [DOI] [PubMed] [Google Scholar]
- 4. Busse JW, Craigie S, Juurlink DN, Buckley DN, Wang L, Couban RJ, et al Guideline for opioid therapy and chronic noncancer pain. Can Med Assoc J 2017; 189: E659–e66. [DOI] [PMC free article] [PubMed] [Google Scholar]
- 5. Chou R, Fanciullo GJ, Fine PG, Adler JA, Ballantyne JC, Davies P, et al Clinical guidelines for the use of chronic opioid therapy in chronic noncancer pain. J Pain 2009; 10: 113–130. [DOI] [PMC free article] [PubMed] [Google Scholar]
- 6. Berterame S, Erthal J, Thomas J, Fellner S, Vosse B, Clare P, et al Use of and barriers to access to opioid analgesics: a worldwide, regional, and national study. Lancet 2016; 387: 1644–1656. [DOI] [PubMed] [Google Scholar]
- 7. Availability of internationally controlled drugs: ensuring adequate access for medical and scientific purposes. New York: United Nations, 2015 [online]. Available at: http://www.incb.org/documents/Publications/AnnualReports/AR2015/English/Supplement-AR15_availability_English.pdf (last accessed 7 January 2018).
- 8. Garg RK, Fulton‐Kehoe D, Franklin GM. Patterns of opioid use and risk of opioid overdose death among medicaid patients. Med Care 2017; 55: 661–668. [DOI] [PubMed] [Google Scholar]
- 9. Dhalla IA, Mamdani MM, Sivilotti ML, Kopp A, Qureshi O, Juurlink DN. Prescribing of opioid analgesics and related mortality before and after the introduction of long‐acting oxycodone. Can Med Assoc J 2009; 181: 891–896. [DOI] [PMC free article] [PubMed] [Google Scholar]
- 10. Elzey MJ, Barden SM, Edwards ES. Patient characteristics and outcomes in unintentional, non‐fatal prescription opioid overdoses: a systematic review. Pain Physician 2016; 19: 215–228. [PubMed] [Google Scholar]
- 11. Baldini A, Von Korff M, Lin EH. A review of potential adverse effects of long‐term opioid therapy: a practitioner's guide. Prim Care Companion CNS Disord 2012; 14 https://doi.org/10.4088/PCC.11m01326 [DOI] [PMC free article] [PubMed] [Google Scholar]
- 12. Chou R, Turner JA, Devine EB, Hansen RN, Sullivan SD, Blazina I, et al The effectiveness and risks of long‐term opioid therapy for chronic pain: a systematic review for a National Institutes of Health Pathways to Prevention Workshop. Ann Intern Med 2015; 162: 276–286. [DOI] [PubMed] [Google Scholar]
- 13. Shah A, Hayes CJ, Martin BC. Characteristics of initial prescription episodes and likelihood of long‐term opioid use – United States, 2006–2015. MMWR Morb Mortal Wkly Rep 2017; 66: 265–269. [DOI] [PMC free article] [PubMed] [Google Scholar]
- 14. Quinn PD, Hur K, Chang Z, Krebs EE, Bair MJ, Scott EL, et al Incident and long‐term opioid therapy among patients with psychiatric conditions and medications: a national study of commercial health care claims. Pain 2017; 158: 140–148. [DOI] [PMC free article] [PubMed] [Google Scholar]
- 15. Thielke SM, Shortreed SM, Saunders K, Turner JA, LeResche L, Von Korff M. A prospective study of predictors of long‐term opioid use among patients with chronic noncancer pain. Clin J Pain 2017; 33: 198–204. [DOI] [PubMed] [Google Scholar]
- 16. Hylan TR, Von Korff M, Saunders K, Masters E, Palmer RE, Carrell D, et al Automated prediction of risk for problem opioid use in a primary care setting. J Pain 2015; 16: 380–387. [DOI] [PubMed] [Google Scholar]
- 17. Rogers KD, Kemp A, McLachlan AJ, Blyth F. Adverse selection? A multi‐dimensional profile of people dispensed opioid analgesics for persistent non‐cancer pain. PLoS One 2013; 8: e80095. [DOI] [PMC free article] [PubMed] [Google Scholar]
- 18. Mellish L, Karanges EA, Litchfield MJ, Schaffer AL, Blanch B, Daniels BJ, et al The Australian Pharmaceutical Benefits Scheme data collection: a practical guide for researchers. BMC Res Notes 2015; 8: 634. [DOI] [PMC free article] [PubMed] [Google Scholar]
- 19. Australian Statistics on Medicines 2011. Canberra: Australian Government, Department of Health, 2013. [online]. Available at http://www.pbs.gov.au/info/statistics/asm/asm-2011 (last accessed 10 January 2018).
- 20. About the PBS. Canberra: Australian Government, Department of Health, 2017. [online]. Available at http://www.pbs.gov.au/info/about-the-pbs (last accessed 11 January 2018).
- 21. Gisev N, Pearson S, Karanges E, Larance B, Buckley N, Larney S, et al To what extent do data from pharmaceutical claims under‐estimate opioid analgesic utilisation in Australia? Pharmacoepidemiol Drug Saf 2017; doi: 10.1002/pds.4329 [DOI] [PubMed] [Google Scholar]
- 22. Nagin DS. Analyzing developmental trajectories: a semiparametric, group‐based approach. Psychol Methods 1999; 4: 139–157. [DOI] [PubMed] [Google Scholar]
- 23. Nagin DS, Odgers CL. Group‐based trajectory modeling in clinical research. Annu Rev Clin Psychol 2010; 6: 109–138. [DOI] [PubMed] [Google Scholar]
- 24. Svendsen K, Skurtveit S, Romundstad P, Borchgrevink PC, Fredheim OM. Differential patterns of opioid use: defining persistent opioid use in a prescription database. Eur J Pain 2012; 16: 359–369. [DOI] [PubMed] [Google Scholar]
- 25. Bateman BT, Franklin JM, Bykov K, Avorn J, Shrank WH, Brennan TA, et al Persistent opioid use following cesarean delivery: patterns and predictors among opioid‐naive women. Am J Obstet Gynecol 2016; 215: 353.e1 53.e18. [DOI] [PMC free article] [PubMed] [Google Scholar]
- 26. Kim SC, Choudhry N, Franklin JM, Bykov K, Eikermann M, Lii J, et al Patterns and predictors of persistent opioid use following hip or knee arthroplasty. Osteoarthritis Cartilage 2017; 25: 1399–1406. [DOI] [PMC free article] [PubMed] [Google Scholar]
- 27. Zech DF, Grond S, Lynch J, Hertel D, Lehmann KA. Validation of World Health Organization guidelines for cancer pain relief: a 10‐year prospective study. Pain 1995; 63: 65–76. [DOI] [PubMed] [Google Scholar]
- 28. Nielsen S, Degenhardt L, Hoban B, Gisev N. A synthesis of oral morphine equivalents (OME) for opioid utilisation studies. Pharmacoepidemiol Drug Saf 2016; 25: 733–737. [DOI] [PubMed] [Google Scholar]
- 29. Sloan KL, Sales AE, Liu CF, Fishman P, Nichol P, Suzuki NT, et al Construction and characteristics of the RxRisk‐V: a VA‐adapted pharmacy‐based case‐mix instrument. Med Care 2003; 41: 761–774. [DOI] [PubMed] [Google Scholar]
- 30. Lu CY, Barratt J, Vitry A, Roughead E. Charlson and Rx‐Risk comorbidity indices were predictive of mortality in the Australian health care setting. J Clin Epidemiol 2011; 64: 223–228. [DOI] [PubMed] [Google Scholar]
- 31. Sun EC, Dixit A, Humphreys K, Darnall BD, Baker LC, Mackey S. Association between concurrent use of prescription opioids and benzodiazepines and overdose: retrospective analysis. Br Med J 2017; 356: j760. [DOI] [PMC free article] [PubMed] [Google Scholar]
- 32. Warner M, Trinidad JP, Bastian BA, Minino AM, Hedegaard H. Drugs most frequently involved in drug overdose deaths: United States, 2010–2014. Natl Vital Stat Rep 2016; 65: 1–15. [PubMed] [Google Scholar]
- 33. Gureje O, Von Korff M, Kola L, Demyttenaere K, He Y, Posada‐Villa J, et al The relation between multiple pains and mental disorders: results from the World Mental Health Surveys. Pain 2008; 135: 82–91. [DOI] [PubMed] [Google Scholar]
- 34. Von Korff M, Simon G. The relationship between pain and depression. Br J Psychiatry 1996; 30: 101–108. [PubMed] [Google Scholar]
- 35. Bair MJ, Robinson RL, Katon W, Kroenke K. Depression and pain comorbidity: a literature review. Arch Intern Med 2003; 163: 2433–2445. [DOI] [PubMed] [Google Scholar]
- 36. Schaakxs R, Comijs HC, van der Mast RC, Schoevers RA, Beekman ATF, Penninx B. Risk factors for depression: differential across age? Am J Geriatr Psychiatry 2017; 25: 966–977. [DOI] [PubMed] [Google Scholar]
- 37. Goesling J, Henry MJ, Moser SE, Rastogi M, Hassett AL, Clauw DJ, et al Symptoms of depression are associated with opioid use regardless of pain severity and physical functioning among treatment‐seeking patients with chronic pain. J Pain 2015; 16: 844–851. [DOI] [PubMed] [Google Scholar]
- 38. Boscarino JA, Rukstalis M, Hoffman SN, Han JJ, Erlich PM, Gerhard GS, et al Risk factors for drug dependence among out‐patients on opioid therapy in a large US health‐care system. Addiction 2010; 105: 1776–1782. [DOI] [PubMed] [Google Scholar]
- 39. Scherrer JF, Salas J, Copeland LA, Stock EM, Schneider FD, Sullivan M, et al Increased risk of depression recurrence after initiation of prescription opioids in noncancer pain patients. J Pain 2016; 17: 473–482. [DOI] [PMC free article] [PubMed] [Google Scholar]
- 40. Pilgrim JL, Yafistham SP, Gaya S, Saar E, Drummer OH. An update on oxycodone: lessons for death investigators in Australia. Forensic Sci Med Pathol 2015; 11: 3–12. [DOI] [PubMed] [Google Scholar]
- 41. Roxburgh A, Burns L, Drummer OH, Pilgrim J, Farrell M, Degenhardt L. Trends in fentanyl prescriptions and fentanyl‐related mortality in Australia. Drug Alcohol Rev 2013; 32: 269–275. [DOI] [PubMed] [Google Scholar]
- 42. Dowell D, Haegerich TM, Chou R. CDC guideline for prescribing opioids for chronic pain – United States, 2016. JAMA 2016; 315: 1624–1645. [DOI] [PMC free article] [PubMed] [Google Scholar]
- 43. Analgesic Expert Group . Chronic pain: pharmacological management. Therapeutic guidelines: analgesics. Melbourne, 2012. [online]. Available at https://www.tg.org.au/ (last accessed 11 January 2018).
- 44. Gadzhanova S, Roughead EE, Pont LG. Safety of opioid patch initiation in Australian residential aged care. Med J Aust 2015; 203: 298. [DOI] [PubMed] [Google Scholar]
- 45. Clarke H, Soneji N, Ko DT, Yun L, Wijeysundera DN. Rates and risk factors for prolonged opioid use after major surgery: population based cohort study. Br Med J 2014; 348: g1251. [DOI] [PMC free article] [PubMed] [Google Scholar]
- 46. Inacio MC, Hansen C, Pratt NL, Graves SE, Roughead EE. Risk factors for persistent and new chronic opioid use in patients undergoing total hip arthroplasty: a retrospective cohort study. BMJ Open 2016; 6: e010664. [DOI] [PMC free article] [PubMed] [Google Scholar]
- 47. Edlund MJ, Martin BC, Russo JE, DeVries A, Braden JB, Sullivan MD. The role of opioid prescription in incident opioid abuse and dependence among individuals with chronic noncancer pain: the role of opioid prescription. Clin J Pain 2014; 30: 557–564. [DOI] [PMC free article] [PubMed] [Google Scholar]
- 48. Campbell G, Nielsen S, Larance B, Bruno R, Mattick R, Hall W, et al Pharmaceutical opioid use and dependence among people living with chronic pain: associations observed within the Pain and Opioids in Treatment (POINT) Cohort. Pain Med 2015; 16: 1745–1758. [DOI] [PubMed] [Google Scholar]
- 49. Kostev K, Wartenberg F, Richter H, Reinwald M, Heilmaier C. Persistence with opioid treatment in Germany in patients suffering from chronic non‐malignant or cancer pain. Curr Med Res Opin 2015; 31: 1157–1163. [DOI] [PubMed] [Google Scholar]
- 50. Australian Bureau of Statistics . Facts at your fingertips: Health 2011. Characteristics of bodily pain in Australia. Canberra: Australian Bureau of Statistics, 2012 [online]. Available at http://www.abs.gov.au/ausstats/abs@.nsf/Lookup/4841.0Chapter12011 (last accessed 11 January 2018).
- 51. Helme RD, Gibson SJ. The epidemiology of pain in elderly people. Clin Geriatr Med 2001; 17: 417–431 v. [DOI] [PubMed] [Google Scholar]
- 52. Blyth FM, March LM, Brnabic AJ, Jorm LR, Williamson M, Cousins MJ. Chronic pain in Australia: a prevalence study. Pain 2001; 89: 127–134. [DOI] [PubMed] [Google Scholar]
- 53. Campbell G, Nielsen S, Bruno R, Lintzeris N, Cohen M, Hall W, et al The Pain and Opioids IN Treatment study: characteristics of a cohort using opioids to manage chronic non‐cancer pain. Pain 2015; 156: 231–242. [DOI] [PubMed] [Google Scholar]
- 54. Johnson ML, El‐Serag HB, Tran TT, Hartman C, Richardson P, Abraham NS. Adapting the Rx‐Risk‐V for mortality prediction in outpatient populations. Med Care 2006; 44: 793–797. [DOI] [PubMed] [Google Scholar]
- 55. Vitry A, Wong SA, Roughead EE, Ramsay E, Barratt J. Validity of medication‐based co‐morbidity indices in the Australian elderly population. Aust N Z J Public Health 2009; 33: 126–130. [DOI] [PubMed] [Google Scholar]
Associated Data
This section collects any data citations, data availability statements, or supplementary materials included in this article.
Supplementary Materials
Appendix S1 RxRisk‐V categories
Appendix S2 Oral morphine equivalent (OME) conversion factors
Appendix S3 Predictors of persistent opioid use (n = 9973) compared to non‐persistent users (n = 421 990) defined using an alternative definition of persistence. People who had ≤2 consecutive months without an opioid in the 12‐month period were defined as persistent users
Appendix S4 Predictors of persistent opioid use stratified by age group