

Abstract
Background and Purpose
Liver ischaemia and reperfusion (IR) injury is a sterile inflammatory response involving production of ROS. Mitochondrial homeostasis is maintained by mitochondrial quality control (QC). Thioredoxin (TRX) 2 is a key mitochondrial redox‐sensitive protein. Resolvin D1 (RvD1), a specialized pro‐resolving lipid mediator, exerts anti‐inflammatory and antioxidant activities. We investigated mechanisms of RvD1 protection against IR‐induced oxidative damage to the liver, focusing on TRX2‐mediated mitochondrial QC.
Experimental Approach
Mice underwent partial warm IR. RvD1 was administered 1 h before ischaemia and immediately prior to reperfusion. Human liver carcinoma HepG2 cells were exposed to hypoxia/reoxygenation and transfected with TRX2 siRNA. Immunohistochemistry, Western blotting and enzyme assays were used to follow changes in mitochondrial structure and function.
Key Results
RvD1 attenuated hepatocellular damage following IR, assessed by serum aminotransferase activities and histology. RvD1 reduced mitochondrial swelling, lipid peroxidation and glutamate dehydrogenase release. Impaired activities of mitochondrial complexes I and III were restored by RvD1. RvD1 enhanced expression of the mitophagy‐related protein, Parkin and inhibited accumulation of PTEN‐induced putative kinase 1. RvD1 restored levels of mitochondrial biogenesis proteins including PPARγ coactivator 1α, nuclear respiratory factor 1 and mitochondrial transcription factor A and mtDNA level. RvD1 attenuated the increase in levels of the mitochondrial fission‐related protein, dynamin‐related protein 1. IR reduced TRX2 levels while increasing TRX2 association with TRX‐interacting protein. RvD1 attenuated these changes. The regulatory effects of RvD1 on mitochondrial QC were abolished by TRX2 knockdown.
Conclusions and Implications
We suggest that RvD1 ameliorated IR‐induced hepatocellular damage by regulating TRX2‐mediated mitochondrial QC.
Abbreviations
- ALT
alanine aminotransferase
- AST
aspartate aminotransferase
- Ct
cycle threshold
- DRP1
dynamin‐related protein 1
- GDH
glutamate dehydrogenase
- GSSG
oxidized GSH
- H/R
hypoxia/reoxygenation
- IR
ischaemia and reperfusion
- MDA
malondialdehyde
- MFN
mitofusin
- MnSOD
manganese SOD
- MPT
mitochondrial permeability transition
- mtDNA
mitochondrial DNA
- NRF
nuclear respiratory factor
- PGC1α
PPARγ coactivator 1α
- PINK1
PTEN‐induced putative kinase 1
- QC
quality control
- qRT‐PCR
quantitative real‐time PCR
- RIPA
radioimmunoprecipitation assay
- RvD1
resolvin D1
- SPM
specialized pro‐resolving lipid mediator
- TFAM
mitochondrial transcription factor A
- TRX
thioredoxin
- TXNIP
thioredoxin‐interacting protein
Introduction
Liver ischaemia and reperfusion (IR) are the fatal sequelae of liver failure after traumatic shock, liver transplantation and liver resection to remove tumours. Excessive production of ROS during IR causes a cascade of deleterious cellular responses leading to inflammation, cell death and organ dysfunction (Kalogeris et al., 2012).
Mitochondria are hubs of cell signalling and biosynthetic reactions and contribute to regulation of cell death. During IR, mitochondrial dysfunction leads to redox imbalance and bioenergetic failure, amplifying ROS release. Mitochondrial quality control (QC) is essential for regulating mitochondrial homeostasis by a range of processes including selective mitochondrial autophagy (mitophagy), mitochondrial biogenesis and mitochondrial dynamics including fission and fusion. Accumulating evidence suggests that mitochondrial ROS is linked to the regulation of mitochondrial QC (Chang et al., 2015; Willems et al., 2015). Overexpression of http://www.guidetopharmacology.org/GRAC/ObjectDisplayForward?objectId=595&familyId=86&familyType=NHR coactivator 1α (PGC1α), a mitochondrial biogenesis related protein, reduced mitochondrial ROS and prevented apoptosis in high glucose‐treated endothelial cells (Valle et al., 2005). Insufficient mitophagy following liver IR resulted in accumulation of damaged mitochondria, surplus ROS and energetic failure (Go et al., 2015). Impairment of mitochondrial dynamics in neurodegenerative disease is associated with ROS production, mitochondrial dysfunction and apoptosis (Wang et al., 2008).
Thioredoxin (TRX) 2, a mitochondrial protein, regulating cellular redox homeostasis and is highly expressed in metabolically active tissues such as the liver, heart and brain (Huang et al., 2015). TRX2 interacts with components of the mitochondrial respiratory chain and regulates mitochondrial membrane potential (He et al., 2008). In a femoral artery ligation model, overexpression of TRX2 promoted angiogenesis by scavenging ROS and enhancing endothelial cell survival (Dai et al., 2009). Recently, greater mitochondrial TRX activity in the hippocampus decreased vulnerability to IR because of the decrease in the oxidizing environment (Yin et al., 2017). Interestingly, PGC1α regulated myocardial TRX2 expression and oxidative stress after chronic systolic overload (Lu et al., 2010).
http://www.guidetopharmacology.org/GRAC/LigandDisplayForward?ligandId=3934) belongs to a class of specialized pro‐resolving lipid mediator (SPM) that regulates resolution of inflammation (Bannenberg et al., 2005; Serhan and Petasis, 2011). RvD1 protected against oxidative stress‐initiated inflammation in mice injected with http://www.guidetopharmacology.org/GRAC/LigandDisplayForward?ligandId=6737‐lipid conjugates (Spite et al., 2009). RvD1 prevented liver IR injury through inhibition of inflammatory cascades and enhancement of http://www.guidetopharmacology.org/GRAC/FamilyDisplayForward?familyId=285 activation (Zhang et al., 2015). Aspirin‐triggered RvD1 attenuated liver IR injury partly through modulation of miR‐146b that inhibits TNF‐α receptor associated factor 6 (Zhang et al., 2017). Most recently, RvD1 protected mitochondrial structure and function and increased levels of ATP following lung IR injury, suggesting a link between RvD1 and mitochondrial homeostasis (Zhao et al., 2016). However, there is no information on the protective mechanisms of RvD1 for mitochondrial failure associated with oxidative stress‐mediated inflammation.
Therefore, in this study, we investigated the protective mechanisms of RvD1 against liver IR injury, focusing on TRX2‐mediated mitochondrial QC.
Methods
Animals
All animal care and experimental procedures complied with the guidelines of the Principles of Laboratory Animal Care by the National Institutes of Health (NIH Publication No. 86‐23, revised 1985) and the guidelines of the Sungkyunkwan University Animal Care Committee and were approved by the Animal Care Committee of Sungkyunkwan University School of Pharmacy, with adherence to the 3Rs (Replacement, Refinement and Reduction). Animal studies were performed in adherence to the ARRIVE guidelines (Kilkenny et al., 2010; McGrath and Lilley, 2015).
Male C57BL/6 mice (19–21 g) were obtained from Daehan Biolink Inc. (Eumseong, Korea) and were acclimatized to laboratory conditions for at least 1 week prior to experiments (five mice per cage). Mice were fasted for 18 h prior to experiments and were provided tap water ad libitum. Randomization was conducted by an individual other than the operator. The animals were selected randomly from the pool of all cages eligible for inclusion in the study and randomly divided into the experimental groups.
Partial warm liver IR
The surgical procedure was performed on animals anaesthetized using ketamine (100 mg·kg−1) and xylazine (10 mg·kg−1), with body temperatures maintained at 37°C. After a midline laparotomy, partial ischaemia was induced by occluding the blood supply to the left and median lobes of the liver with a clamp. After 60 min of ischaemia, the clamp was removed to allow reperfusion. The warm liver IR model has been widely in use for investigating liver ischaemic and traumatic disorders (Mendes‐Braz et al., 2012). RvD1 (0.1 μg·μL−1 stock solution) was diluted in PBS and injected i.p. (15 μg·kg−1) 1 h prior to ischaemia and again directly before reperfusion. The doses and timing of RvD1 treatment were selected based on earlier studies (Liao et al., 2012; Kang and Lee, 2016). In vehicle‐treated sham or IR mice, 1% ethanol‐PBS was administered using the same volume and route. No effects of this vehicle on liver function were detected. The animals were assigned to four groups (n = 8 per group): (i) vehicle‐treated sham (Sham), (ii) RvD1‐treated sham (RvD1), (iii) vehicle‐treated IR (IR) and (iv) RvD1‐treated IR (RvD1 + IR). At 6 h after reperfusion, mice were killed by overdose of ketamine and xylazine. Liver tissues and blood from the inferior vena cava were collected and stored at −75°C for later analyses; part of the left lobe was used for histological analysis.
Serum aminotransferase activities
Serum alanine aminotransferase (ALT) and aspartate aminotransferase (AST) activities were measured by standard spectrophotometry using ChemiLab ALT and AST assay kits, respectively (IVD Lab, Uiwang, Korea).
Histological observation
Liver specimens for histopathological analysis were obtained 6 h after reperfusion. Samples were fixed in 10% neutral‐buffered formalin, embedded in paraffin, sliced into 5 μm sections and stained with haematoxylin and eosin, followed by histological assessment using a light microscope (Olympus CKX41, Olympus Optical Co., Tokyo, Japan). Histological changes were evaluated in randomly chosen fields at ×200. We utilized the criteria reported by Suzuki et al. (1993). In this classification, three liver injury indices – sinusoidal congestion (score: 0–4), hepatocyte necrosis (score: 0–4) and ballooning degeneration (score: 0–4) – are graded, for a total score of 0–12. Scores were allocated without knowledge of the treatments.
Isolation of liver mitochondria
Liver tissue was homogenized in medium containing 250 mM sucrose, 10 mM Tris‐hydrochloride and 1 mM EDTA at pH 7.2 at 4°C. The homogenate was centrifuged at 600 g for 10 min, and the supernatant was subsequently centrifuged for 5 min at 15 000 g to obtain a mitochondrial pellet. The mitochondrial pellet was washed with the same medium without EDTA and centrifuged for 5 min at 15 000 g, producing a final pellet.
Mitochondrial swelling
Mitochondrial swelling, an indicator of mitochondrial permeability transition (MPT), was determined based on the change in absorbance at 520 nm of a mitochondrial suspension as described by Elimadi et al. (2001). Briefly, liver mitochondria were added to 4 mL of phosphate buffer containing 250 mM sucrose, 5 mM KH2PO4 and 1 μM rotenone at pH 7.2 at 25°C. This suspension (1.8 mL) was added to sample and reference cuvettes. Succinate (6 μM) was added to the sample cuvette only. The cuvettes were scanned at 520 nm.
Serum glutamate dehydrogenase activity
Serum was used for assay of glutamate dehydrogenase (GDH) activity, as described by Ellis and Goldberg (1972). The reaction mixture contained 50 mM triethanolamine buffer, 0.19 mM NADH, 0.95 mM ADP and 50 mM ammonium sulfate. Serum was added to the reaction mixture and incubated at 37°C for 15 min. After incubation, 10 mM 2‐oxoglutarate was added, and each sample was incubated at 37°C for 6 min. The final volume of 1 mL was analysed for absorbance at 340 nm by UV spectroscopy.
Mitochondrial respiratory complex I and III activities
Mitochondria isolated as described above were centrifuged at 15 000 g, and the pellet was subjected to three rounds of freeze–thaw cycles in 0.5 M potassium phosphate buffer before measuring respiratory complex activity to maximize enzymic rates. Complex I activity was measured by monitoring the dynamic change in transmittance at 340 nm from oxidation of NADH to NAD+ in a pH 7.5 buffer containing potassium phosphate buffer, 50 mg·mL−1 fatty acid‐free BSA, 10 mM potassium cyanide, 10 mM NADH and 10 mM ubiquinone in a total volume of 1 mL. After 2 min baseline measurement, 1 mM rotenone was added, and transmittance was recorded continuously for 2 min. Complex III activity was measured as the increase in absorbance at 550 nm resulting from reduction of cytochrome c. The assay mixture contained distilled water, 0.5 M potassium phosphate buffer, 1 mM oxidized cytochrome c, 10 mM potassium cyanide, 5 mM EDTA, 2.5% Tween‐20, 1 mg·mL−1 antimycin A and the sample. After addition of 10 mM decylubiquinol, the mixture was rapidly inverted using parafilm, and absorbance at 550 nm was monitored for 2 min (Spinazzi et al., 2012).
ATP levels
Hepatic levels of ATP were measured using an ATP colorimetric/fluorometric assay kit (BioVision, San Francisco, CA, USA) according to the manufacturer's instructions.
Mitochondrial lipid peroxidation
Malondialdehyde (MDA), the end product of lipid peroxidation, was measured based on the level of thiobarbituric acid‐reactive substance in isolated hepatic mitochondria samples analysed spectrophotometrically at 535 nm using 1,1,3,3‐tetraethoxypropane.
Mitochondrial GSH/GSSG ratio
Total GSH in liver homogenates after precipitation with 1% picric acid was determined using yeast‐GSH reductase, 5,5′‐dithiobis (2‐nitrobenzoic acid) and NADPH at 412 nm. Oxidized GSH (GSSG) level was determined using the same method in the presence of 2‐vinylpyridine. Reduced GSH was calculated as the difference between total GSH and GSSG (Tietze, 1969).
Mitochondrial DNA level
Mitochondrial DNA (mtDNA) was extracted from liver tissue using a DNeasy Blood & Tissue kit (Qiagen, Valencia, CA, USA). To amplify mtDNA, quantitative real‐time RT‐PCR (qRT‐PCR) was used with a thermocycler (Lightcycler® 96‐wells, Roche Applied Science, Mannheim, Germany) and the SYBR Green detection system (Roche Applied Science). The primers used were as follows: 5′‐ACGCTTCCGTTACGATCAAC‐3′ (sense) and 5′‐ACTCCCGCTGTAAAAATTGG‐3′ (antisense) for mitochondrial NADH dehydrogenase 1 and 5′‐AGCCATGTACGTAGCCATCC‐3′ (sense) and 5′‐GCTGTGGTGGTGAAGCTGTA‐3′ (antisense) for β‐actin. qRT‐PCR was performed with initial denaturation at 94°C for 5 min and final extension at 72°C for 7 min. The cycling conditions for mitochondrial NADH dehydrogenase 1 were 45 cycles of 30 s at 94°C, 30 s at 52°C and 30 s at 72°C. The cycling conditions for β‐actin were 45 cycles of 30 s at 94°C, 30 s at 55°C and 30 s at 72°C. The mtDNA copy number was quantified relative to both β‐actin and the average of all delta cycle threshold (Ct) values in each sample using the Ct method. All analyses were conducted in duplicate to ensure amplification integrity.
Western blotting
For Western blot analysis, liver tissue was homogenized in PRO‐PREP™ Protein Extraction Solution (iNtRON Biotechnology, Seongnam, Korea) to extract total cell protein. Protein concentrations were determined using the bicinchoninic acid Protein Assay kit (Thermo Fisher Scientific Inc., Waltham, MA, USA). Protein samples (20–40 μg) were loaded on 7.5–15% polyacrylamide gels, separated by SDS‐PAGE and transferred to polyvinylidene difluoride membranes. After transfer, membranes were blocked for 1 h with 5% skim milk powder in Tris‐buffered saline with 0.1% Tween‐20 at room temperature. Blots were incubated with primary antibodies overnight at 4°C and subsequently with secondary antibodies for 1 h at room temperature. Primary antibodies used were http://www.guidetopharmacology.org/GRAC/LigandDisplayForward?ligandId=4998, manganese SOD (MnSOD), mitofusin (MFN) 2, nuclear respiratory factor (NRF) 1, mitochondrial transcription factor A (TFAM), http://www.guidetopharmacology.org/GRAC/LigandDisplayForward?ligandId=5074 (1:2500, Abcam, Cambridge, UK), dynamin‐related protein 1 (DRP1), TRX2 (1:2500, Cell Signaling Technology, Danvers, MA, USA), Parkin, http://www.guidetopharmacology.org/GRAC/ObjectDisplayForward?objectId=2161), PGC1α, TRX1 and thioredoxin‐interacting protein (TXNIP) (1:2500, Santa Cruz Biotechnology, Dallas, TX, USA). Monoclonal antibody against mouse β‐actin (1:5000, Sigma‐Aldrich, St. Louis, MO, USA) was used as a loading control. The binding of all antibodies was detected using an enhanced chemiluminescence detection system (GenDEPOT, Katy, TX, USA). Total‐Lab TL120 software (Nonlinear Dynamics, Newcastle, UK) was used for densitometric evaluation of immunoreactive bands.
Immunoprecipitation
Liver tissue was homogenized in ice‐cold radioimmunoprecipitation assay (RIPA) buffer (150 mM NaCl, 50 mM Tris, 1% Triton X‐100, 1% deoxycholic acid, 0.1% sodium dodecyl sulfate, pH 7.4) containing a protease and phosphatase inhibitor cocktail set (Calbiochem). Whole cell lysates were incubated overnight with mouse anti‐TXNIP antibody (1:100). The immune complexes were precipitated via incubation with protein A/G agarose beads (Santa Cruz Biotechnology) for 4 h at 4°C with constant rotation. Immune complexes were washed three times in RIPA buffer, and immunoprecipitates were resuspended in Laemmli sample buffer. The samples were analysed by Western blot using anti‐TXNIP and anti‐TRX2 as primary antibodies.
Hypoxia/reoxygenation
Human liver carcinoma HepG2 cells were obtained from the American Type Culture Collection (Rockville, MD, USA). HepG2 cells were grown in DMEM with 10% FBS and 1% penicillin/streptomycin and maintained at 37°C and 5% CO2. Cells from passage numbers 10–20 were used. For hypoxia/reoxygenation (H/R), the medium was replaced with glucose‐free hypoxic medium equilibrated at 5% CO2 and 95% N2 and placed into a modular incubator chamber (Billups‐Rothenburg, Del Mar, CA, USA) flushed with the same hypoxic gas mixture. After incubation under hypoxic conditions for 12 h, the cells were moved to 95% air and 5% CO2 for 3 h for reoxygenation. The cells were treated with 0.05 μM of RvD1 based on previous studies (Lee and Surh, 2013; Kang and Lee, 2016). The duration for hypoxia and reoxygenation was selected based on our preliminary experiments.
TRX2 siRNA treatment
Small interfering RNA (siRNA) for TRX2 and the non‐specific control were purchased from Bioneer (Daejeon, Korea). HepG2 cells were transfected with siRNA using Lipofectamine® 2000 (Thermo Fisher Scientific Inc., Waltham, MA, USA). After 24 h of incubation, the cells were washed and then treated with RvD1 (0.05 μM) or vehicle for H/R. After H/R for 15 h, the cells were harvested for further analysis.
Data and statistical analysis
Data collection and statistical analysis in this study followed the recommendations on pharmacology experimental design and analysis (Curtis et al., 2015). All data are presented as mean ± SEM. The overall significance of results was analysed by one‐way ANOVA, with appropriate Bonferroni correction for multiple comparisons. We used the SPSS v.12.0 statistical software package (SPSS, Chicago, IL, USA). Differences between group means were considered significant when P < 0.05.
Materials
The RvD1 used in these experiments was supplied by Cayman Chemicals (Ann Arbor, MI, USA). NADPH, 5,5′‐dithiobis (2‐nitrobenzoic acid) , 2‐vinylpyridine, were supplied by Sigma‐Aldrich (St. Louis, MO, USA).
Nomenclature of targets and ligands
Key protein targets and ligands in this article are hyperlinked to corresponding entries in http://www.guidetopharmacology.org, the common portal for data from the IUPHAR/BPS Guide to PHARMACOLOGY (Harding et al., 2018), and are permanently archived in the Concise Guide to PHARMACOLOGY 2017/18 (Alexander et al., 2017a,b,c).
Results
RvD1 attenuates IR‐induced liver injury
To investigate the effect of RvD1 on liver IR‐induced injury, we measured the activities of serum ALT and AST, indicators of hepatocellular damage. After reperfusion for 6 h, serum ALT and AST activities were significantly increased and these increases were attenuated by treatment with 15 μg·kg−1 of RvD1 (Figure 1A). The histological features shown in Figure 1B indicate normal lobular architecture and cell structure in the livers of the vehicle‐ and RvD1‐treated sham groups. After reperfusion for 6 h, the liver sections showed extensive cell death and inflammatory cell infiltration. These pathological changes were ameliorated by RvD1 (Figure 1B).
Figure 1.
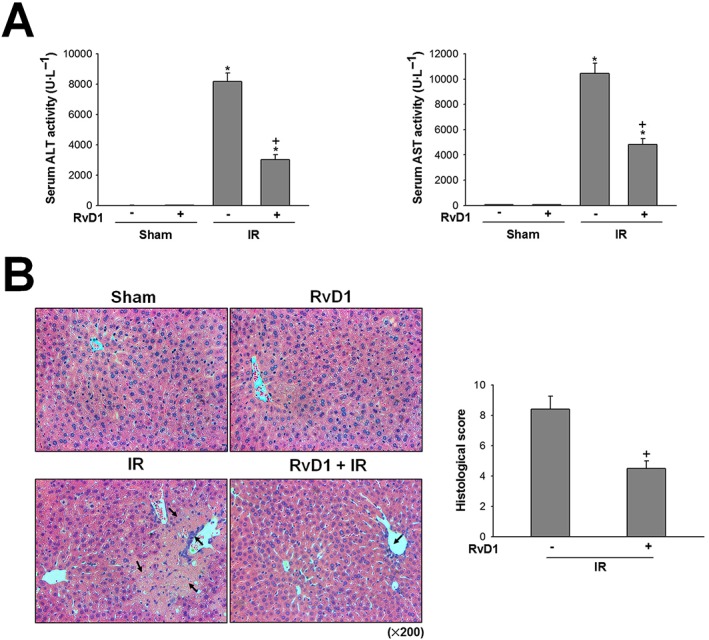
Effect of RvD1 on hepatocellular damage in liver IR. Mice received i.p. injections of RvD1 (15 μg·kg−1) 1 h prior to ischaemia and again immediately before reperfusion. (A) Serum ALT and AST levels were measured by spectrophotometric assay. (B) Histological lesions were graded using Suzuki score. The necrotic area and inflammatory cell infiltration are indicated by arrows. All values are expressed as mean ± SEM (n = 8 per group). * P < 0.05, significantly different from the vehicle‐treated sham group; + P < 0.05, significantly different from the vehicle‐treated IR group.
RvD1 attenuates mitochondrial dysfunction in liver IR
We evaluated whether RvD1 affected mitochondrial damage, a pathogenic contributor to IR injury. Induction of mitochondrial permeability transition (MPT) pores can lead to mitochondrial swelling. As shown in Figure 2A, in the sham group, mitochondrial swelling was at a basal level but after reperfusion for 6 h, mitochondrial swelling significantly increased to approximately 1.4‐fold compared with that of sham group. GDH, a mitochondrial matrix enzyme, is another indicator of mitochondrial damage. Serum GDH activity in the sham group was significantly increased after IR, by 18.0‐fold, compared with that of the sham group. These increases were attenuated by RvD1 (Figure 2A, B). Onset of MPT and release of mitochondrial enzymes lead to mitochondrial membrane potential collapse, failure of ATP synthesis and cell death. To determine the effect of RvD1 on mitochondrial dysfunction, we evaluated mitochondrial respiratory complex I and III activities (which are more susceptible to IR injury than the other complexes) and hepatic ATP levels (Han et al., 2008). Mitochondrial respiratory complex I and III activities significantly decreased to approximately 62.9% and 52.0% those of the sham group after reperfusion for 6 h, respectively. The hepatic levels of ATP (Figure 2D), a marker for mitochondrial dysfunction‐induced energy disturbance, was also decreased to approximately 50% of that in the sham group by the IR injury. Both these decreases were attenuated by treatment with RvD1 (Figure 2C, D).
Figure 2.
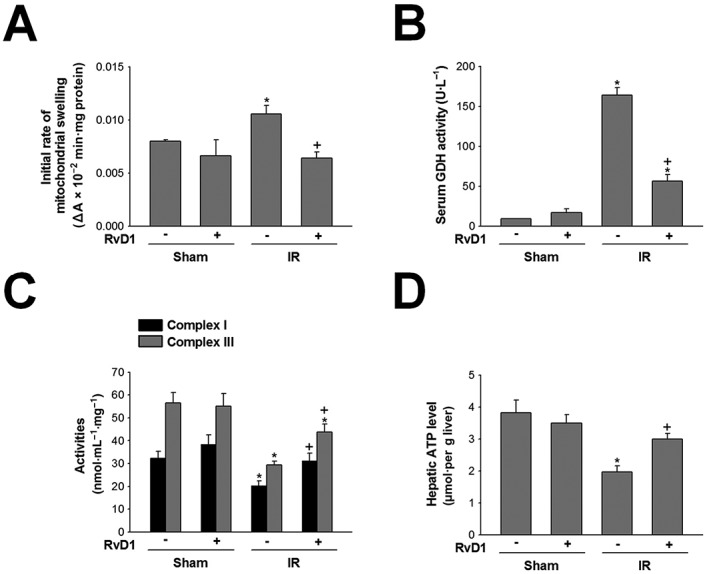
Effect of RvD1 on mitochondrial dysfunction in liver IR. Mice received i.p. injections of RvD1 (15 μg·kg−1) 1 h prior to ischaemia and again immediately before reperfusion. (A) Mitochondrial swelling, (B) serum GDH activity, (C) mitochondrial respiratory complex I and III activities and (D) hepatic ATP level were measured. All values are expressed as mean ± SEM (n = 8 per group). * P < 0.05, significantly different from the vehicle‐treated sham group; + P < 0.05, significantly different from the vehicle‐treated IR group.
RvD1 reduces mitochondrial oxidative stress in liver IR
The uncontrolled production of mitochondrial ROS plays an important role in liver IR injury. We next assessed tissue level of MDA, an end‐product of lipid peroxidation, and endogenous antioxidant systems involving MnSOD and GSH. In the sham group, the low levels of MDA in hepatic mitochondria were increased after reperfusion for 6 h, compared with that of sham group, and this increase was attenuated by RvD1 (Figure 3A). In contrast, after reperfusion for 6 h, the expression of MnSOD protein and the GSH/GSSG ratio were decreased compared with those in the sham group. Treatment with RvD1 attenuated both these decreases (Figure 3B, C).
Figure 3.
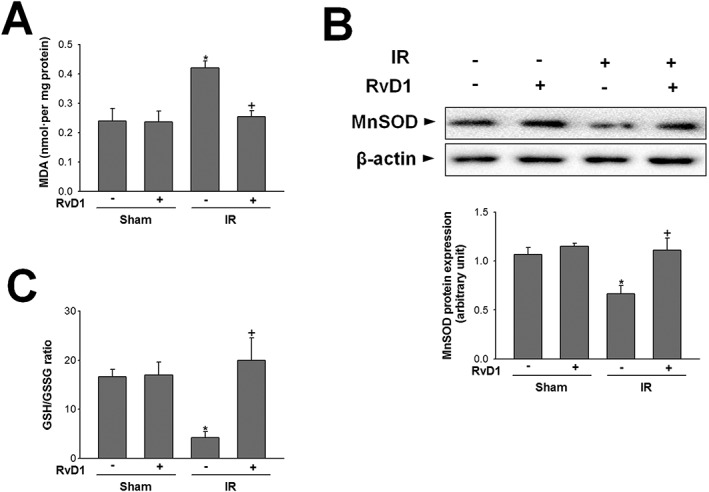
Effect of RvD1 on mitochondrial oxidative stress in liver IR. Mice received i.p. injections of RvD1 (15 μg·kg−1) 1 h prior to ischaemia and again immediately before reperfusion. (A) Mitochondrial lipid peroxidation, (B) MnSOD protein level in whole liver extracts and (C) GSH/GSSG ratio were measured. Protein expression was adjusted to β‐actin as a loading control. All values are expressed as mean ± SEM (n = 8 per group). * P < 0.05, significantly different from the vehicle‐treated sham group; + P < 0.05, significantly different from the vehicle‐treated IR group.
RvD1 regulates mitochondrial QC‐related protein expression in liver IR
To investigate whether RvD1 affects mitochondrial QC, we first examined the levels of mitophagy‐related proteins. After reperfusion for 6 h, the expression of PINK1 protein was increased by 1.3‐fold, compared with that of the sham group. This increase was attenuated by RvD1 (Figure 4A). In contrast, expression of Parkin protein decreased compared with that of the sham group after reperfusion for 6 h. This decrease was attenuated by RvD1 (Figure 4A). Next, we assessed the processes related to mitochondrial biogenesis and levels of mtDNA. Activation of PGC1α leads to stimulation of the transcription factor NRF1, followed by induction of TFAM synthesis and, ultimately, production of mitochondria. The levels of PGC1α, NRF1 and TFAM protein, and hepatic mtDNA level were all lower than those in the sham group and RvD1 attenuated these decreases (Figure 4B and Table 1). Finally, we examined the expression of proteins involved in mitochondrial fission and fusion. After reperfusion for 6 h, expression of DRP1 protein was increased in the IR group compared with that of the sham group, and RvD1 treatment attenuated this increase. In contrast, expression of MFN2 protein was decreased by IR, compared with that of the sham group, and this change was not affected by RvD1 treatment (Figure 4C).
Figure 4.
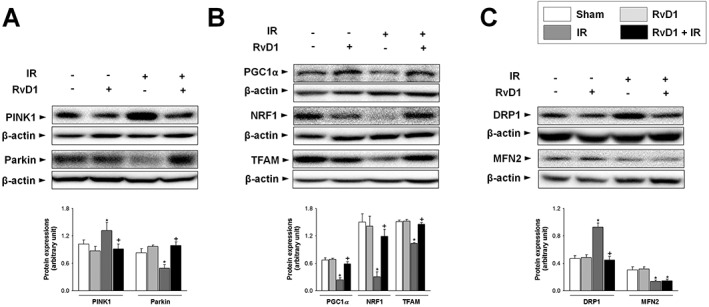
Effect of RvD1 on mitochondrial QC‐related protein levels in liver IR. Mice received i.p. injections of RvD1 (15 μg·kg−1) 1 h prior to ischaemia and again immediately before reperfusion. Western blot analysis was performed to measure the protein levels of (A) PINK1 and Parkin, (B) PGC1α, NRF1 and TFAM, and (C) DRP1 and MFN2 in whole liver extracts. Protein expression was adjusted to β‐actin as a loading control. All values are expressed as mean ± SEM (n = 8 per group). * P < 0.05, significantly different from the vehicle‐treated sham group; + P < 0.05, significantly different from the vehicle‐treated IR group.
Table 1.
Effect of RvD1 on hepatic mtDNA level in liver IR
| Group | mtDNA copy number (fold increase) |
|---|---|
| Sham | |
| Vehicle | 1.00 ± 0.11 |
| RvD1 | 1.14 ± 0.15 |
| IR | |
| Vehicle | 0.54 ± 0.05* |
| RvD1 | 0.87 ± 0.06# |
Mice received i.p. injections of RvD1 (15 μg·kg−1) 1 h prior to ischaemia and again immediately before reperfusion. qRT‐PCR analysis was performed to measure expression level of mtDNA in whole liver extracts. The mtDNA copy number was quantified relative to both β‐actin and the average of all ΔCt values in each sample using the Ct method. All values are expressed as mean ± SEM (n = 8 per group).
P < 0.05, significantly different from the vehicle‐treated sham group;
P < 0.05, significantly different from the vehicle‐treated IR group.
RvD1 modulates TRX2 protein expression and the association of TRX2 and TXNIP in liver IR
To further explore the molecular mechanisms involved in RvD1‐mediated mitochondrial QC regulation, we examined TRX2, a redox‐sensitive mitochondrial protein, and its interaction with TXNIP. Expression of TRX2 protein was decreased in the IR group, compared with that of the sham group and this decrease was attenuated by RvD1 (Figure 5A). By contrast, TXNIP protein expression was higher in the IR group compared with that of the sham group, and this increase was attenuated by RvD1 (Figure 5B). To examine the interaction between TRX2 and TXNIP, immunoprecipitation was performed using anti‐TXNIP antibody and detected using anti‐TRX2 antibody. There was a significant increase in TXNIP‐TRX2 association after reperfusion for 6 h. RvD1 attenuated this increase (Figure 5C). Furthermore, while IR significantly reduced TRX1 protein expression, compared with that of the sham group, RvD1 had no effect on TRX1 expression (Figure 5D).
Figure 5.
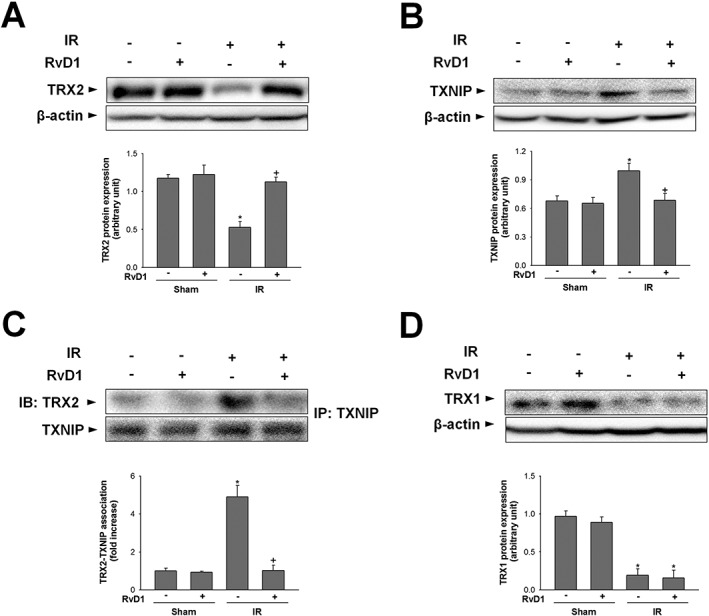
Effect of RvD1 on TRX2 protein level and TRX2‐TXNIP association in liver IR. Mice received i.p. injections of RvD1 (15 μg·kg−1) 1 h prior to ischaemia and again immediately before reperfusion. Western blot analysis was performed to measure the levels of (A, B) TRX2, TXNIP protein, (C) association of TRX2‐TXNIP and (D) TRX1 protein in whole liver extracts. Protein expression was adjusted to β‐actin as a loading control. All values are expressed as mean ± SEM (n = 8 per group). * P < 0.05, significantly different from the vehicle‐treated sham group; + P < 0.05, significantly different from the vehicle‐treated IR group.
TRX2 knockdown abolishes the regulatory effects of RvD1 on inflammatory mediators
We confirmed the involvement of TRX2 in the hepatoprotective effects of RvD1 by gene ablation studies using cultures of HepG2 cells exposed to hypoxia /reoxygenation (H/R) procedure. The efficacy of siRNA transfection is shown in Figure 6A. TRX2 siRNA treatment markedly reduced the level of TRX2 protein expression in both control and H/R groups. To examine whether TRX2 was involved in the regulation of inflammation by RvD1, we evaluated the markers for inflammatory response in HepG2 cells exposed to H/R. After H/R, the expression of TNF‐α and IL‐6 protein increased, relative to those in the control group. These increases were attenuated by RvD1. TRX2 knockdown reversed these alterations induced by RvD1 (Figure 6B, C).
Figure 6.
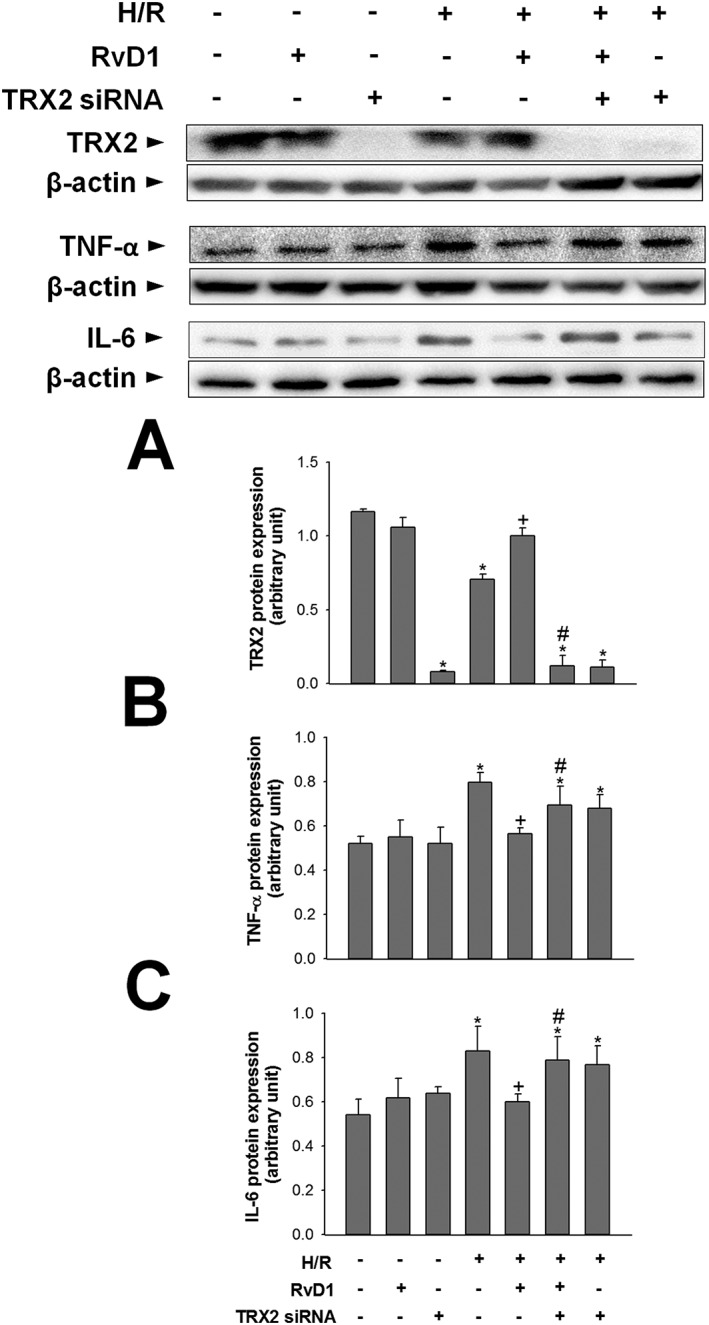
Effect of TRX2 gene silencing on the regulatory effect of RvD1 on inflammatory response. HepG2 cells were transfected with TRX2 siRNA 24 h before H/R. HepG2 cells were treated with 0.05 μM of RvD1 30 min before H/R. (A) TRX2 protein expression was measured to confirm the efficacy of TRX2 siRNA. Western blot analysis was performed to measure the protein levels of (B) TNF‐α and (C) IL‐6 in cell lysates. Protein expression was adjusted to β‐actin as a loading control. All values are expressed as mean ± SEM (n = 8 per group). * P < 0.05, significantly different from the control group; + P < 0.05, significantly different from the H/R group; # P < 0.05, significantly different from the RvD1‐treated H/R group.
TRX2 knockdown abolishes the regulatory effects of RvD1 on mitochondrial QC
We initially examined the levels of mitophagy‐related proteins. After H/R, expression of PINK1 protein increased, compared with that of the control group. In contrast, expression of Parkin protein was lower than that in the control group after H/R. These changes were attenuated by RvD1. TRX2 siRNA abolished the regulatory effects of RvD1 on mitophagy (Figure 7A, B). Next, we examined expression of proteins related to mitochondrial biogenesis. The levels of PGC1α, NRF1 and TFAM protein all were lower after H/R, than those of the control group. These decreases were attenuated by RvD1. Enhanced mitochondrial biogenesis after exposure to RvD1 was blunted by TRX2 siRNA (Figure 7C–E). Finally, regarding mitochondrial fission, the expression of DRP1 protein increased after H/R, compared with that of the control group, and RvD1 treatment attenuated this increase. This attenuation was also blunted by TRX2 siRNA (Figure 7F).
Figure 7.
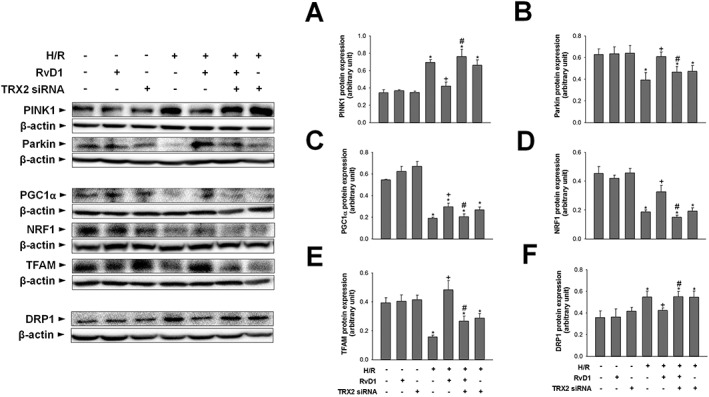
Effect of TRX2 gene silencing on the regulatory effect of RvD1 on mitochondrial QC. HepG2 cells were transfected with TRX2 siRNA 24 h before H/R. HepG2 cells were treated with 0.05 μM of RvD1 30 min before H/R. Western blot analysis was performed to measure the protein levels of (A, B) PINK1 and Parkin, (C–E) PGC1α, NRF1 and TFAM, and (F) DRP1 in cell lysates. Protein expression was adjusted to β‐actin as a loading control. All values are expressed as mean ± SEM (n = 8 per group). * P < 0.05, significantly different from the control group; + P < 0.05, significantly different from the H/R group; # P < 0.05, significantly different from the RvD1‐treated H/R group.
Discussion
RvD1 has immunomodulatory properties, but the underlying mechanisms are not well understood. Liver IR injury is a sterile inflammatory process involving complex cellular and molecular interactions. In a previous study, we found that RvD1 expression in the liver and serum was up‐regulated following IR‐induced hepatocellular damage, and that exogenous administration of RvD1 to mice induced M2 skewing of Kupffer cells and increased engulfment of apoptotic neutrophils (Kang and Lee, 2016). Redox imbalance and subsequent overproduction of ROS can cause oxidative stress and are involved in the pathophysiology of various diseases including IR. In the liver, early generation of ROS or reactive nitrosative species (RNS) during reperfusion plays a pivotal role in initiating deleterious cellular responses leading to inflammation, cell death and organ dysfunction. Thus, we investigated whether RvD1 has a role in the regulation of the redox system and in protecting the liver from oxidative damage.
Mitochondria are key determinants of cell fate during IR injury (Go et al., 2015). Succinate‐driven reverse electron transport through mitochondrial complex I is a well‐established source of ROS after prolonged ischaemia (Chouchani et al., 2014). Damage in mitochondrial complex III was shown to promote MPT pore opening, increase matrix ADP and NAD+ concentrations, and sustain ROS burst (Korge et al., 2017). As such, targeting mitochondrial ROS by preserving complex I or III during liver IR has been investigated using various pharmacological interventions. For example, the mitochondria‐targeted antioxidants MitoQ and Mito‐CP attenuated the impaired complex I activity and exerted liver protection after reperfusion (Mukhopadhyay et al., 2012). RvD1 was reported to inhibit http://www.guidetopharmacology.org/GRAC/ObjectDisplayForward?objectId=2646&familyId=920&familyType=ENZYME‐mediated ROS production and reduce endothelial barrier dysfunction (Chattopadhyay et al., 2017). RvD1 mitigated IR‐induced lung injury by modulating http://www.guidetopharmacology.org/GRAC/FamilyDisplayForward?familyId=158#834 activity and reducing metabolic disturbance (Zhao et al., 2016), suggesting its involvement in the redox balance system in multiple organs. However, the molecular pathways involved in RvD1 regulation of mitochondria damage and redox imbalance remain ill‐defined. In the present study, impairment of the activities of mitochondrial complexes I and III was evident in the liver exposed to IR. IR‐induced ROS generation and mitochondrial oxidative damage were indicated by increases in mitochondrial swelling, an indicator for MPT pore opening, and mitochondrial lipid peroxidation and by a decrease in mitochondrial antioxidant MnSOD2 protein expression. The circulating level of GDH, a mitochondrial matrix enzyme, is an indicator of mitochondrial injury and is relevant to clinical liver conditions such as http://www.guidetopharmacology.org/GRAC/LigandDisplayForward?ligandId=5239 intoxication (McGill et al., 2014). We showed that IR markedly increased serum GDH activity. Serum GDH activity from IR mice, treated with RvD1, was lower than that of the IR group, suggesting that RvD1 improves mitochondrial dysfunction after IR. Indeed, depletion of hepatic ATP due to mitochondrial dysfunction was alleviated by RvD1. Collectively, our results indicate that RvD1 provides hepatoprotection from IR by inhibiting mitochondrial oxidative damage.
Hepatocytes possess diverse mechanisms to maintain mitochondrial homeostasis and prevent abnormal or dysfunctional mitochondrial fission and fusion, mitochondrial biogenesis and degradation (mitophagy). Disruption of anabolic‐catabolic balance between mitochondrial biogenesis and mitophagy contributes to cell death by delaying post‐injury recovery (Perez‐Pinzon et al., 2012). Mitophagy is mediated by PINK1 and Parkin, an E3 ubiquitin ligase. PINK1 accumulates on the outer membrane of damaged mitochondria, followed by recruitment of Parkin from the cytosol to promote mitophagy signalling (Kawajiri et al., 2010). Mitophagy decreased and liver injuries were exacerbated in Parkin KO mice after treatment with alcohol (Williams et al., 2015a) and in mice with acetaminophen overdose after acute knockdown of Parkin (Williams et al., 2015b). http://www.guidetopharmacology.org/GRAC/LigandDisplayForward?ligandId=224, a direct ROS scavenger and indirect antioxidant, was shown to enhance mitophagy and attenuated carbon tetrachloride‐induced chronic liver fibrosis in rats (Kang et al., 2016). Activation of autophagy by RvD1 through MAPK1 and nuclear factor erythroid‐derived 2‐related factor 2 signalling pathways has been reported in murine naïve peritoneal macrophages (Prieto et al., 2015). However, whether mitophagy is a target of RvD1‐mediated tissue/organ protection is unknown. In the present study, the level of PINK1 protein expression increased indicating accumulation of damaged mitochondria, while Parkin protein expression decreased after reperfusion. These changes were attenuated by RvD1. Overall, our findings demonstrate that RvD1 restores impaired mitophagy induced by IR.
Mitochondrial biogenesis requires coordination of nuclear and mitochondrial genomes to replace defective mitochondria or to supplement existing mitochondria to increase respiratory capacity (Scarpulla et al., 2012). In previous studies of post‐myocardial infarction, mtDNA copy number was reduced, leading to impairment of mitochondrial complex I, III and IV activities (Ide et al., 2001). PGC1α is the master regulator of mitochondrial biogenesis and mediates activation of transcription factors such as the NRF1 and NRF2. These NRFs activate TFAM, which drives mitochondrial gene transcription and genome replication (Ventura‐Clapier et al., 2008). In rat primary hepatocytes subjected to H/R, TFAM protein levels decreased along with mitochondrial mass and membrane potential decrease (Khader et al., 2016). Interestingly, in our study, the levels of PGC1α, NRF1 and TFAM protein expression and mtDNA copy number were reduced by IR, and RvD1 attenuated these changes, suggesting that RvD1 activates mitochondrial biogenesis.
Mitochondria are highly dynamic organelles that constantly undergo fission and fusion to adapt to stress (Youle and van der Bliek, 2012; Ni et al., 2015). Mitochondrial fission plays important roles in removal of damaged mitochondria by mitophagy and mitochondrial biogenesis during cell mitosis. However, excessive mitochondrial fission following reperfusion contributed to IR‐induced rat heart dysfunction and amplified release of mitochondrial ROS including hydrogen peroxide (Giedt et al., 2012; Disatnik et al., 2013). DRP1 is a cytosolic GTPase protein that is recruited to the outer membrane of mitochondria to trigger fission (Frank et al., 2001). In our recent report, inhibition of DRP1 by Mdivi‐1 suppressed mitochondrial swelling and hepatocellular damage in D‐galactosamine/LPS‐induced acute liver injury (Lee et al., 2017). On the other hand, mitochondrial fusion controls the correct distribution of mtDNA, lipids and proteins, which is critical for cell differentiation and proliferation (Mishra and Chan, 2014). MFN1 and MFN2 mediate mitochondrial fusion with optic atrophy 1. Hepatic deletion of MFN2 induced ROS overproduction (Sebastian et al., 2012), and overexpression of http://www.guidetopharmacology.org/GRAC/ObjectDisplayForward?objectId=2707 suppressed mitochondrial dysfunction of ischaemic mouse livers in MFN2‐dependent manner (Biel et al., 2016). In the present study, IR markedly increased DRP1 protein level, and this increase was attenuated by RvD1. In contrast, RvD1 had no effect on altered MFN2 expression. Overall, our data indicate that RvD1 reduces the IR‐induced shift towards mitochondrial fission.
TRX2 and TXNIP, redox‐dependent signal complexes, have emerged as key components of mitochondrial homeostasis. In response to oxidative stress, TXNIP translocates from the cytosol or nucleus to mitochondria and oxidizes TRX2, reducing TRX2 binding to http://www.guidetopharmacology.org/GRAC/ObjectDisplayForward?objectId=2080 and allowing ASK1 activation, resulting in cell death (Saxena et al., 2010; Yoshihara et al., 2014). TRX2 activity is reduced by IR via interaction with TXNIP in the heart (Yoshioka et al., 2012) and liver (Nivet‐Antoine et al., 2010). Overexpression of mitochondrial TRX2 conferred a strong resistance to ROS‐induced damage in a manner similar to the effects of TXNIP deficiency in human bone cancer cells (Chen et al., 2002). Elucidation of TRX2‐TXNIP signalling in mitochondrial QC and its regulation by RvD1 are novel findings in the current study. After reperfusion, hepatic TRX2 protein expression decreased, while TXNIP protein expression and its association with TRX2 increased. RvD1 attenuated these changes. Interestingly, the protein level of TRX1, which is located in the cytoplasm, was also reduced by IR but was not affected by RvD1. To confirm the role of TRX2 in the regulatory effects of RvD1 on mitochondria dysfunction and possibly linked inflammation, we adapted the H/R system to HepG2 cells and performed TRX2 knockdown using siRNA. H/R increased the expression of TNF‐α and IL‐6 protein expression. These increases were attenuated by RvD1. TRX2 knockdown abolished these alterations with RvD1, suggesting the possible involvement of TRX2 in the inflammatory response in HepG2 cells exposed to H/R. Furthermore, the present in vitro results on indicators of mitophagy, mitochondrial biogenesis and fission recapitulate the findings from the in vivo studies. Of note, TRX2 knockdown abolished the effects of RvD1 on these pathways. Our results indicated that TRX2 was involved in the regulation of mitophagy, mitochondrial biogenesis and mitochondrial fission by RvD1.
In conclusion, the present study demonstrated that RvD1 (i) prevents ROS‐mediated mitochondrial dysfunction; (ii) rescued dysregulation of mitophagy, mitochondrial biogenesis and fission and (iii) activated TRX2 signalling during IR. Overall, our findings suggest that RvD1 ameliorated IR‐induced liver injury by regulating redox‐dependent mitochondrial QC and provide further support for the development of RvD1 as a therapeutic strategy in a variety of ischaemic diseases.
Author contributions
J.W.K., H.S.C. and S.M.L. designed the research. J.W.K. and H.S.C. performed the research. J.W.K. and H.S.C. analysed the data. J.W.K., H.S.C. and S.M.L. wrote the paper.
Conflict of interest
The authors declare no conflicts of interest.
Declaration of transparency and scientific rigour
This http://onlinelibrary.wiley.com/doi/10.1111/bph.13405/abstract acknowledges that this paper adheres to the principles for transparent reporting and scientific rigour of preclinical research recommended by funding agencies, publishers and other organisations engaged with supporting research.
Acknowledgements
This research was supported by the Mid‐Career Research Program through a National Research Foundation of Korea grant funded by the Ministry of Education, Science, and Technology (MEST) in Korea (NRF‐2016R1A2B4009880).
Kang, J.‐W. , Choi, H.‐S. , and Lee, S.‐M. (2018) Resolvin D1 attenuates liver ischaemia/reperfusion injury through modulating thioredoxin 2‐mediated mitochondrial quality control. British Journal of Pharmacology, 175: 2441–2453. doi: 10.1111/bph.14212.
References
- Alexander SPH, Fabbro D, Kelly E, Marrion NV, Peters JA, Faccenda E et al (2017a). The Concise Guide to PHARMACOLOGY 2017/18: Enzymes. Br J Pharmacol 174: S272–S359. [DOI] [PMC free article] [PubMed] [Google Scholar]
- Alexander SPH, Cidlowski JA, Kelly E, Marrion NV, Peters JA, Faccenda E et al (2017b). The Concise Guide to PHARMACOLOGY 2017/18: Nuclear hormone receptors. Br J Pharmacol 174: S208–S224. [DOI] [PMC free article] [PubMed] [Google Scholar]
- Alexander SPH, Kelly E, Marrion NV, Peters JA, Faccenda E, Harding SD et al (2017c). The Concise Guide to PHARMACOLOGY 2017/18: Transporters. Br J Pharmacol 174: S360–S446. [DOI] [PMC free article] [PubMed] [Google Scholar]
- Bannenberg GL, Chiang N, Ariel A, Arita M, Tjonahen E, Gotlinger KH et al (2005). Molecular circuits of resolution: formation and actions of resolvins and protectins. J Immunol 174: 4345–4355. [DOI] [PubMed] [Google Scholar]
- Biel TG, Lee S, Flores‐Toro JA, Dean JW, Go KL, Lee MH et al (2016). Sirtuin 1 suppresses mitochondrial dysfunction of ischemic mouse livers in a mitofusin 2‐dependent manner. Cell Death Differ 23: 279–290. [DOI] [PMC free article] [PubMed] [Google Scholar]
- Chang AL, Ulrich A, Suliman HB, Piantadosi CA (2015). Redox regulation of mitophagy in the lung during murine Staphylococcus aureus sepsis. Free Radic Biol Med 78: 179–189. [DOI] [PMC free article] [PubMed] [Google Scholar]
- Chattopadhyay R, Raghavan S, Rao GN (2017). Resolvin D1 via prevention of ROS‐mediated SHP2 inactivation protects endothelial adherens junction integrity and barrier function. Redox Biol 12: 438–455. [DOI] [PMC free article] [PubMed] [Google Scholar]
- Chen Y, Cai J, Murphy TJ, Jones DP (2002). Overexpressed human mitochondrial thioredoxin confers resistance to oxidant‐induced apoptosis in human osteosarcoma cells. J Biol Chem 277: 33242–33248. [DOI] [PubMed] [Google Scholar]
- Chouchani ET, Pell VR, Gaude E, Aksentijevic D, Sundier SY, Robb EL et al (2014). Ischaemic accumulation of succinate controls reperfusion injury through mitochondrial ROS. Nature 515: 431–435. [DOI] [PMC free article] [PubMed] [Google Scholar]
- Curtis MJ, Bond RA, Spina D, Ahluwalia A, Alexander SP, Giembycz MA et al (2015). Experimental design and analysis and their reporting: new guidance for publication in BJP. Br J Pharmacol 172: 3461–3471. [DOI] [PMC free article] [PubMed] [Google Scholar]
- Dai S, He Y, Zhang H, Yu L, Wan T, Xu Z et al (2009). Endothelial‐specific expression of mitochondrial thioredoxin promotes ischemia‐mediated arteriogenesis and angiogenesis. Arterioscler Thromb Vasc Biol 29: 495–502. [DOI] [PMC free article] [PubMed] [Google Scholar]
- Disatnik MH, Ferreira JC, Campos JC, Gomes KS, Dourado PM, Qi X et al (2013). Acute inhibition of excessive mitochondrial fission after myocardial infarction prevents long‐term cardiac dysfunction. J Am Heart Assoc 2: e000461. [DOI] [PMC free article] [PubMed] [Google Scholar]
- Elimadi A, Sapena R, Settaf A, Le Louet H, Tillemnt J, Morin D (2001). Attenuation of liver normothermic ischemia‐‐reperfusion injury by preservation of mitochondrial functions with S‐15176, a potent trimetazidine derivative. Biochem Pharmacol 62: 509–516. [DOI] [PubMed] [Google Scholar]
- Ellis G, Goldberg DM (1972). Optimal conditions for the kinetic assay of serum glutamate dehydrogenase activity at 37°C. Clin Chem 18: 523–527. [PubMed] [Google Scholar]
- Frank S, Gaume B, Bergmann‐Leitner ES, Leitner WW, Robert EG, Catez F et al (2001). The role of dynamin‐related protein 1, a mediator of mitochondrial fission, in apoptosis. Dev Cell 1: 515–525. [DOI] [PubMed] [Google Scholar]
- Giedt RJ, Yang C, Zweier JL, Matzavinos A, Alevriadou BR (2012). Mitochondrial fission in endothelial cells after simulated ischemia/reperfusion: role of nitric oxide and reactive oxygen species. Free Radic Biol Med 52: 348–356. [DOI] [PMC free article] [PubMed] [Google Scholar]
- Go KL, Lee S, Zendejas I, Behrns KE, Kim JS (2015). Mitochondrial dysfunction and autophagy in hepatic ischemia/reperfusion injury. Biomed Res Int 2015: 183469. [DOI] [PMC free article] [PubMed] [Google Scholar]
- Harding SD, Sharman JL, Faccenda E, Southan C, Pawson AJ, Ireland S et al (2018). The IUPHAR/BPS Guide to PHARMACOLOGY in 2018: updates and expansion to encompass the new guide to IMMUNOPHARMACOLOGY. Nucl Acids Res 46: D1091–D1106. [DOI] [PMC free article] [PubMed] [Google Scholar]
- Han F, Da T, Riobo NA, Becker LB (2008). Early mitochondrial dysfunction in electron transfer activity and reactive oxygen species generation after cardiac arrest. Crit Care Med 36: S447–S453. [DOI] [PMC free article] [PubMed] [Google Scholar]
- He M, Cai J, Go YM, Johnson JM, Martin WD, Hansen JM et al (2008). Identification of thioredoxin‐2 as a regulator of the mitochondrial permeability transition. Toxicol Sci 105: 44–50. [DOI] [PMC free article] [PubMed] [Google Scholar]
- Huang Q, Zhou HJ, Zhang H, Huang Y, Hinojosa‐Kirschenbaum F, Fan P et al (2015). Thioredoxin‐2 inhibits mitochondrial reactive oxygen species generation and apoptosis stress kinase‐1 activity to maintain cardiac function. Circulation 131: 1082–1097. [DOI] [PMC free article] [PubMed] [Google Scholar]
- Ide T, Tsutsui H, Hayashidani S, Kang D, Suematsu N, Nakamura K et al (2001). Mitochondrial DNA damage and dysfunction associated with oxidative stress in failing hearts after myocardial infarction. Circ Res 88: 529–535. [DOI] [PubMed] [Google Scholar]
- Kalogeris T, Baines CP, Krenz M, Korthuis RJ (2012). Cell biology of ischemia/reperfusion injury. Int Rev Cell Mol Biol 298: 229–317. [DOI] [PMC free article] [PubMed] [Google Scholar]
- Kang JW, Hong JM, Lee SM (2016). Melatonin enhances mitophagy and mitochondrial biogenesis in rats with carbon tetrachloride‐induced liver fibrosis. J Pineal Res 60: 383–393. [DOI] [PubMed] [Google Scholar]
- Kang JW, Lee SM (2016). Resolvin D1 protects the liver from ischemia/reperfusion injury by enhancing M2 macrophage polarization and efferocytosis. Biochim Biophys Acta 1861: 1025–1035. [DOI] [PubMed] [Google Scholar]
- Kawajiri S, Saiki S, Sato S, Sato F, Hatano T, Eguchi H et al (2010). PINK1 is recruited to mitochondria with parkin and associates with LC3 in mitophagy. FEBS Lett 584: 1073–1079. [DOI] [PubMed] [Google Scholar]
- Khader A, Yang WL, Godwin A, Prince JM, Nicastro JM, Coppa GF et al (2016). Sirtuin 1 stimulation attenuates ischemic liver injury and enhances mitochondrial recovery and autophagy. Crit Care Med 44: e651–e663. [DOI] [PMC free article] [PubMed] [Google Scholar]
- Kilkenny C, Browne W, Cuthill IC, Emerson M, Altman DG, NC3Rs Reporting Guidelines Working Group (2010). Animal research: reporting in vivo experiments: the ARRIVE guidelines. Br J Pharmacol 160: 1577–1579. [DOI] [PMC free article] [PubMed] [Google Scholar]
- Korge P, John SA, Calmettes G, Weiss JN (2017). Reactive oxygen species production induced by pore opening in cardiac mitochondria: the role of complex II. J Biol Chem 292: 9896–9905. [DOI] [PMC free article] [PubMed] [Google Scholar]
- Lee HN, Surh YJ (2013). Resolvin D1‐mediated NOX2 inactivation rescues macrophages undertaking efferocytosis from oxidative stress‐induced apoptosis. Biochem Pharmacol 86: 759–769. [DOI] [PubMed] [Google Scholar]
- Lee SB, Kang JW, Kim SJ, Ahn J, Kim J, Lee SM (2017). Afzelin ameliorates D‐galactosamine and lipopolysaccharide‐induced fulminant hepatic failure by modulating mitochondrial quality control and dynamics. Br J Pharmacol 174: 195–209. [DOI] [PMC free article] [PubMed] [Google Scholar]
- Liao Z, Dong J, Wu W, Yang T, Wang T, Guo L et al (2012). Resolvin D1 attenuates inflammation in lipopolysaccharide‐induced acute lung injury through a process involving the PPARgamma/NF‐kappaB pathway. Respir Res 13: 110. [DOI] [PMC free article] [PubMed] [Google Scholar]
- Lu Z, Xu X, Hu X, Fassett J, Zhy G, Tao Y et al (2010). PGC‐1 alpha regulates expression of myocardial mitochondrial antioxidants and myocardial oxidative stress after chronic systolic overload. Antioxid Redox Signal 13: 1011–1022. [DOI] [PMC free article] [PubMed] [Google Scholar]
- McGill MR, Staggs VS, Sharpe MR, Lee WM, Jaeschke H, Acute Liver Failure Study Group (2014). Serum mitochondrial biomarkers and damage‐associated molecular patterns are higher in acetaminophen overdose patients with poor outcome. Hepatology 60: 1336–1345. [DOI] [PMC free article] [PubMed] [Google Scholar]
- McGrath JC, Lilley E (2015). Implementing guidelines on reporting research using animals (ARRIVE etc.): new requirements for publication in BJP. Br J Pharmacol 172: 3189–3193. [DOI] [PMC free article] [PubMed] [Google Scholar]
- Mendes‐Braz M, Elias‐Miro M, Jimenez‐Castro MB, Casillas‐Ramirez A, Ramalho FS, Peralta C (2012). The current state of knowledge of hepatic ischemia‐reperfusion injury based on its study in experimental models. J Biomed Biotechnol 2012: 298657. [DOI] [PMC free article] [PubMed] [Google Scholar]
- Mishra P, Chan DC (2014). Mitochondrial dynamics and inheritance during cell division, development and disease. Nat Rev Mol Cell Biol 15: 634–646. [DOI] [PMC free article] [PubMed] [Google Scholar]
- Mukhopadhyay P, Horavath B, Zsengeller Z, Batkai S, Cao Z, Kechrid M et al (2012). Mitochondrial reactive oxygen species generation triggers inflammatory response and tissue injury associated with hepatic ischemia‐reperfusion: therapeutic potential of mitochondrially targeted antioxidants. Free Radic Biol Med 53: 1123–1138. [DOI] [PMC free article] [PubMed] [Google Scholar]
- Ni HM, Williams JA, Ding WX (2015). Mitochondrial dynamics and mitochondrial quality control. Redox Biol 4: 6–13. [DOI] [PMC free article] [PubMed] [Google Scholar]
- Nivet‐Antoine V, Cottart CH, Lemarechal H, Vamy M, Margaill I, Beaudeux JL et al (2010). trans‐Resveratrol downregulates Txnip overexpression occurring during liver ischemia‐reperfusion. Biochimie 92: 1766–1771. [DOI] [PubMed] [Google Scholar]
- Perez‐Pinzon MA, Stetler RA, Fiskum G (2012). Novel mitochondrial targets for neuroprotection. J Cereb Blood Flow Metab 32: 1362–1376. [DOI] [PMC free article] [PubMed] [Google Scholar]
- Prieto P, Rosales‐Mendoza CE, Terron V, Toledano V, Cuadrado A, Lopez‐Collazo E et al (2015). Activation of autophagy in macrophages by pro‐resolving lipid mediators. Autophagy 11: 1729–1744. [DOI] [PMC free article] [PubMed] [Google Scholar]
- Saxena G, Chen J, Shalev A (2010). Intracellular shuttling and mitochondrial function of thioredoxin‐interacting protein. J Biol Chem 285: 3997–4005. [DOI] [PMC free article] [PubMed] [Google Scholar]
- Scarpulla RC, Vega RB, Kelly DP (2012). Transcriptional integration of mitochondrial biogenesis. Trends Endocrinol Metab 23: 459–466. [DOI] [PMC free article] [PubMed] [Google Scholar]
- Sebastian D, Hernandes‐Alavarez MI, Segales J, Sorianello E, Munoz JP, Sala D et al (2012). Mitofusin 2 (Mfn2) links mitochondrial and endoplasmic reticulum function with insulin signaling and is essential for normal glucose homeostasis. Proc Natl Acad Sci U S A 109: 5523–5528. [DOI] [PMC free article] [PubMed] [Google Scholar]
- Serhan CN, Petasis NA (2011). Resolvins and protectins in inflammation resolution. Chem Rev 111: 5922–5943. [DOI] [PMC free article] [PubMed] [Google Scholar]
- Spinazzi M, Casarin A, Pertegato V, Salviati L, Angelini C (2012). Assessment of mitochondrial respiratory chain enzymatic activities on tissues and cultured cells. Nat Protoc 7: 1235–1246. [DOI] [PubMed] [Google Scholar]
- Spite M, Summers L, Porter TF, Srivastava S, Bhatnagar A, Serhan CN (2009). Resolvin D1 controls inflammation initiated by glutathione‐lipid conjugates formed during oxidative stress. Br J Pharmacol 158: 1062–1073. [DOI] [PMC free article] [PubMed] [Google Scholar]
- Suzuki S, Toledo‐Pereyra LH, Rodriguez FJ, Cejalvo D (1993). Neutrophil infiltration as an important factor in liver ischemia and reperfusion injury. Modulating effects of FK506 and cyclosporine. Transplantation 55: 1265–1272. [DOI] [PubMed] [Google Scholar]
- Tietze F (1969). Enzymic method for quantitative determination of nanogram amounts of total and oxidized glutathione: applications to mammalian blood and other tissues. Anal Biochem 27: 502–522. [DOI] [PubMed] [Google Scholar]
- Valle I, Alvarez‐Barrientos A, Arza E, Lamas S, Monsalve M (2005). PGC‐1alpha regulates the mitochondrial antioxidant defense system in vascular endothelial cells. Cardiovasc Res 66: 562–573. [DOI] [PubMed] [Google Scholar]
- Ventura‐Clapier R, Garnier A, Veksler V (2008). Transcriptional control of mitochondrial biogenesis: the central role of PGC‐1alpha. Cardiovasc Res 79: 208–217. [DOI] [PubMed] [Google Scholar]
- Wang X, Su B, Siedlak SL, Moreira PI, Fujioka H, Wang Y et al (2008). Amyloid‐beta overproduction causes abnormal mitochondrial dynamics via differential modulation of mitochondrial fission/fusion proteins. Proc Natl Acad Sci U S A 105: 19318–19323. [DOI] [PMC free article] [PubMed] [Google Scholar]
- Willems PH, Rossignol R, Dieteren CE, Murphy MP, Koopman WJ (2015). Redox homeostasis and mitochondrial dynamics. Cell Metab 22: 207–218. [DOI] [PubMed] [Google Scholar]
- Williams JA, Ni HM, Ding Y, Ding WX (2015a). Parkin regulates mitophagy and mitochondrial function to protect against alcohol‐induced liver injury and steatosis in mice. Am J Physiol Gastrointest Liver Physiol 309: G324–G340. [DOI] [PMC free article] [PubMed] [Google Scholar]
- Williams JA, Ni HM, Haynes A, Manley S, Li Y, Jaeschke H et al (2015b). Chronic deletion and acute knockdown of Parkin have differential responses to acetaminophen‐induced mitophagy and liver injury in mice. J Biol Chem 290: 10934–10946. [DOI] [PMC free article] [PubMed] [Google Scholar]
- Yin B, Barrionuevo G, Batinic‐Haberle I, Sandberg M, Weber SG (2017). Differences in reperfusion‐induced mitochondrial oxidative stress and cell death between hippocampal CA1 and CA3 subfields are due to the mitochondrial thioredoxin system. Antioxid Redox Signal 27: 534–549. [DOI] [PMC free article] [PubMed] [Google Scholar]
- Yoshihara E, Masaki S, Matsuo Y, Chen Z, Tian H, Yodoi J (2014). Thioredoxin/Txnip: redoxisome, as a redox switch for the pathogenesis of diseases. Front Immunol 4: 514. [DOI] [PMC free article] [PubMed] [Google Scholar]
- Yoshioka J, Chutkow WA, Lee S, Kim JB, Yan J, Tian R et al (2012). Deletion of thioredoxin‐interacting protein in mice impairs mitochondrial function but protects the myocardium from ischemia‐reperfusion injury. J Clin Invest 122: 267–279. [DOI] [PMC free article] [PubMed] [Google Scholar]
- Youle RJ, van der Bliek AM (2012). Mitochondrial fission, fusion, and stress. Science 337: 1062–1065. [DOI] [PMC free article] [PubMed] [Google Scholar]
- Zhang T, Shu HH, Chang L, Ye F, Xu KQ, Huang WQ (2015). Resolvin D1 protects against hepatic ischemia/reperfusion injury in rats. Int Immunopharmacol 28: 322–327. [DOI] [PubMed] [Google Scholar]
- Zhang T, Xiu HH, Liu JX, Ma Y, Xu KQ, Huang WQ (2017). Protective effect of aspirin‐triggered resolvin D1 on hepatic ischemia/reperfusion injury in rats: the role of miR‐146b. Int Immunopharmacol 51: 140–147. [DOI] [PubMed] [Google Scholar]
- Zhao Q, Wu J, Hua Q, Lin Z, Ye L, Zhang W et al (2016). Resolvin D1 mitigates energy metabolism disorder after ischemia‐reperfusion of the rat lung. J Transl Med 14: 81. [DOI] [PMC free article] [PubMed] [Google Scholar]