

Abstract
Alzheimer's disease (AD) is a progressive neurodegenerative disorder with considerable evidence suggesting an initiation of disease in the entorhinal cortex and hippocampus and spreading thereafter to the rest of the brain. In this study, we combine genetics and imaging data obtained from the Alzheimer's Disease Neuroimaging Initiative and the AddNeuroMed study. To identify genetic susceptibility loci for AD, we conducted a genome-wide study of atrophy in regions associated with neurodegeneration in this condition. We identified one single-nucleotide polymorphism (SNP) with a disease-specific effect associated with entorhinal cortical volume in an intron of the ZNF292 gene (rs1925690; P-value = 2.6× 10⁻⁸; corrected P-value for equivalent number of independent quantitative traits = 7.7 × 10⁻⁸) and an intergenic SNP, flanking the ARPP-21 gene, with an overall effect on entorhinal cortical thickness (rs11129640; P-value = 5.6 × 10⁻⁸; corrected P-value = 1.7 × 10⁻⁷). Gene-wide scoring also highlighted PICALM as the most significant gene associated with entorhinal cortical thickness (P-value = 6.7 × 10⁻⁶).
Keywords: Alzheimer's disease, imaging-genetics, quantitative trait
Introduction
The US NIH Alzheimer's Disease Neuroimaging Initiative (ADNI)1 and the European Union FP6-funded AddNeuroMed study2 have complementary goals. ADNI is a 5-year public–private partnership investigating the effectiveness of integrating neuroimaging, genetic/biological markers, as well as clinical and neuropsychological assessments in measuring the progression of mild cognitive impairment (MCI) and early Alzheimer's disease (AD). The main aim of the AddNeuroMed study, also a private–public partnership and a pilot for the European FP6 Innovative Medicines Initiative, is to find biomarkers for AD, in particular for early diagnosis of the disease. Both projects have acquired similar data, and in this study, we integrate neuroimaging and genetic data obtained from the two projects to identify novel susceptibility loci for AD.
Research to identify genetic factors that predispose to AD recently resulted in the publication of two large-scale genome-wide association studies (GWASs). Harold et al.3 analyzed >16000 individuals in a two-stage case–control analysis, identifying, in addition to APOE, two loci that were significantly associated with AD (namely CLU and PICALM). Another large-scale study by Lambert et al.4 also found association with the CLU locus and additionally with the CR1 locus. These findings have elucidated some of the genes that are causally implicated in predisposition to AD. However, the diseased case versus normal control design of these GWASs and the studies that preceded them have an inherent confound in that a proportion of the apparently normal control population will already harbor disease because of the long clinically silent prodromal phase. One way to address this confound is the use of endophenotypes of disease—that is, markers of pathology in vivo that can be used to separate diseased from normal individuals more accurately than can be achieved by clinical assessment alone, and hence have the potential for greater power than studies using the standard AD/normal case–control design. One approach to endophenotypes as a marker of disease in genetic studies is the use of imaging measures in a quantitative trait (QT) analysis.
This imaging-genetics approach has been undertaken by a number of previous studies in AD. Potkin et al.5 identified a number of loci potentially associated with hippocampal atrophy in a subset of the ADNI cohort (AD and control samples). Shen et al.6 combined whole-genome genotyping data with 142 measures of gray matter density, volume and cortical thickness in the full ADNI cohort. However, they focused on the main effects of each single-nucleotide polymorphism (SNP) and did not investigate disease-specific effects.
In this study, we integrate magnetic resonance imaging (MRI) measures and genome-wide common variation data in a combined data set of 939 subjects (236 AD, 424 MCI and 279 controls) from the AddNeuroMed2 study and the ADNI;1 both these public–private partnerships having common objectives and, critically for this analysis, common genetics and imaging protocols.7,8 We had two aims: (1) to carry out a GWAS of AD-related brain regions and (2) to investigate the influence of AD-related genes and loci reported by recent large-scale GWASs for AD,3,4 specifically, the CLU, PICALM and CR1 loci. We focus on brain regions that are unequivocally affected by AD-related neurodegeneration, namely the hippocampus and entorhinal cortex, and also on the related measures whole-brain volume (WBV) and total ventricular volume (VV). We use these MRI-derived measures as QTs to determine disease-specific common variants associated with neural atrophy in patients with AD.
Materials and methods
Samples
A total of 281 subjects were selected from the AddNeuroMed study, a prospective, longitudinal multicenter study, to discover biomarkers for AD.2 Data were collected from six medical centers across Europe: University of Kuopio (Finland), University of Perugia (Italy), Aristotle University of Thessaloniki (Greece), King's College London (United Kingdom), Medical University of Lodz (Poland) and University of Toulouse (France). Informed consent was obtained for all subjects, and protocols and procedures were approved by the relevant institutional review board at each data acquisition site. Neuropsychological tests were conducted at baseline. None of the MCI and AD subjects had other neurological or psychiatric disease, significant unstable systemic illness or organ failure and alcohol or substance misuse. AD diagnosis was made using the NINCDS-ADRDA (National Institute of Neurological and Communicative Disease and Stroke and Alzheimer's disease) criteria for probable AD.9 At baseline, all MCI subjects fulfilled the diagnostic criteria for amnestic MCI.10,11 A total of 281 patients were genotyped (94 AD, 96 MCI and 91 controls) and underwent MRI.
Data for 818 ADNI subjects were downloaded from the ADNI database (http://www.loni.ucla.edu/ADNI), including baseline 1.5-T MRI scans, Illumina genotyping data (Illumina, San Diego, CA, USA), demographic and neuropsychological information, APOE genotype and baseline diagnosis information (see Supplementary Methods for details).
Genotyping
Genotyping for all samples was performed using the Illumina HumanHap610-Quad BeadChips, which contain 620 901 markers. ADNI genotyping was conducted as described previously. 6 AddNeuroMed genotyping was performed by the CNG (Centre National de Génotypage CNG, France) (see Supplementary Methods for details). The APOE genotype was obtained separately using standard methods.
AddNeuroMed and ADNI genotyping data were merged, and any ambiguous or uncalled SNPs were removed using PLINK.12 SNPs with call rates < 98% or minor allele frequencies <5% were excluded. The Hardy–Weinberg equilibrium was assessed in control samples and SNPs with Hardy–Weinberg equilibrium <10−5 were excluded. A total of 488 911 SNPs passed quality control protocols. Individual samples with SNP call rates <98% were excluded. Gender and relatedness tests were conducted in PLINK. Individuals with incongruous or ambiguous SNP genders compared with clinical genders were excluded. In cases in which pairs of samples were related (PI-HAT > 0.1875), one of the samples was removed at random. Ethnicity information was available for all participants. To restrict the analysis data set to Caucasian samples, so as to avoid confounding effects due to differing allele frequencies in other populations, the samples were merged with the Hapmap phase 3 populations,13 and a population stratification analysis was conducted using Eigenstrat.14 Samples classified as non-European were excluded based on ethnicity information and Eigenstrat analysis (AddNeuroMed n =0, ADNI n =64). Overall, 1004 samples passed these quality control filters (AddNeuroMed n = 278, ADNI n =726). The genotyping rate in these samples was 0.998.
Imaging
Data acquisition
Data acquisition for AddNeuroMed15 and ADNI8 took place using 1.5-T MR systems using a common protocol, which included a high-resolution sagittal three-dimensional T1-weighted MPRAGE volume (voxel size 1.1 × 1.1 × 1.2 mm3) and axial proton density/T2-weighted fast spin echo images. Full brain and skull coverage was required for both of the latter data sets, and a detailed quality control was carried out on all MR images using the AddNeuroMed QC framework.15 All MR images received a clinical read by a radiologist to exclude any subjects with non-AD-related pathologies.
AddNeuroMed and ADNI image analysis
A highly automated structural MRI image processing pipeline developed by Fischl and Dale16 and Fischl et al.17,18 and producing both regional cortical thickness measures and regional volume measures was used for data analysis. Cortical reconstruction and volumetric segmentation included removal of the nonbrain tissue using a hybrid watershed/surface deformation procedure, automated Talairach transformation, segmentation of the subcortical white matter and deep gray matter volumetric structures (including the hippocampus, amygdala, caudate, putamen, ventricles) intensity normalization, tessellation of the gray matter–white matter boundary, automated topology correction and surface deformation following intensity gradients to optimally place the gray/white and gray/cerebrospinal fluid borders at the location where the greatest shift in intensity defines the transition to the other tissue class. Surface inflation was followed by registration to a spherical atlas, which used individual cortical folding patterns to match cortical geometry across subjects and parcellation of the cerebral cortex into units based on gyral and sulcal structures. All volumes were normalized by the subject's intracranial volume (ICV).
Regional cortical thickness was measured from 34 areas, and regional cortical volume was measured bilaterally from 24 areas. In total, images obtained from 1097 AddNeuroMed and ADNI samples passed imaging quality control and produced normalized WBVs. Measures for total hippocampal volume (HPV), VV, total entorhinal cortical volume (ERV) and mean (of left and right) entorhinal cortical thickness were extracted for 1070 samples.
QT analysis
The four normalized (by ICV) volumetric measures WBV, HPV, VV, ERV and the cortical thickness measure mean (of left and right) entorhinal cortical thickness (ERT) were used as QTs in separate regression analyses. ERT was not normalized by ICV. Including ICV as a covariate in the ERT analysis produces very similar results (r of regression coefficients = 0.999), and ICV is not significant in any of the regressions. The numbers of samples that passed both imaging and genotyping quality control protocols and for which there were complete relevant phenotypic and demographic data were 963 (WBV) and 939 (HPV, VV, ERV and ERT).
QT analyses were implemented using the linear model function (--linear) in PLINK, which allows covariates to be included in the linear model.12 Each QT was regressed on the number of minor alleles of the 478 081 autosomal SNPs passing quality control criteria, assuming an additive allele effect. A number of different linear models were analyzed:
The additive allele effect was ascertained in an initial model, including age, gender, APOE ε4 allele dosage and disease status as covariates. Disease status was coded as a continuous variable in the model (controls=0, MCI=1, AD=2) to reflect the nonindependent nature of the three diagnosis states. The genomic inflation factor (based on median χ2 of the additive term in the model) was calculated to investigate potential population stratification effects in the analysis. The genomic inflation factors for WBV, HPV and VV for this model were > 1.05, indicating potential population effects. The ERV and ERT analyses had genomic inflation factors of 1.01.
To allow for population effects, Eigenstrat14 was run using the 1004 samples that passed quality control. Seven significant eigenvectors were detected using Tracy–Widom statistics. Model 1 was re-run for WBV, HPV and VV, including the seven significant eigenvalues for each sample. The genomic inflation factors for WBV, HPV and VV for this model were 1.00, 1.00 and 1.01, respectively.
To detect SNP effects that may differ according to disease status, an interaction term for disease status and the additive allele effect was included in the third model. For ERV and ERT, the covariates age, gender, APOE ε4 allele dosage and disease status were included in the model. For WBV, HPV and VV, significant eigenvalues were further added.
To allow for multiple testing of five QTs (namely WBV, HPV, VV, ERV and ERT) that are correlated (Supplementary Table 1), we applied Matrix Spectral Decomposition (see http://gump.qimr.edu.au/general/daleN/matSpD/), based on the study by Nyholt,19 to QTs, which results in an effective number of independent variables of 3, using VeffLi.
Gene analysis
We performed linkage disequilibrium (LD)-based SNP grouping in PLINK12 on the results of our entorhinal cortical thickness analysis using the --clump command with default settings. We also performed a set-based analysis in PLINK, using SNPs ±100 kb of PICALM and ±750 kb of ARPP-21 (because of the intergenic location of the significant associated SNP) as sets of genes and permuting 10000 times. This analysis was implemented by PLINK as follows (from http://pngu.mgh.harvard.edu/∼purcell/plink/anal.shtml#set): For the gene set, for each SNP, determine which other SNPs are in LD, above a certain threshold R (0.5). Perform standard single SNP QT analysis. For the set, select up to N ‘independent’ SNPs (as defined before) with P-values below P (0.05). The best SNP is selected first; subsequent SNPs are selected in order of decreasing statistical significance, after removing SNPs in LD with previously selected SNPs. From these subsets of SNPs, the statistic for each set is calculated as the mean of these single SNP statistics. Permute the data set 10 000 times, keeping LD between SNPs constant (that is, permute trait). The empirical P-value for set (EMP1) is the number of times the permuted set statistic exceeds the original one for the set.
Finally, we used a novel method for calculating gene-based P-values from GWA results (see Supplementary Methods for details). We restricted our analysis to ∼20 000 protein-coding genes annotated in Ensembl v56 and mapped them to SNPs if the SNP was within 20 kb of the annotated coordinates.
Imputation
To further investigate the evidence of association at the PICALM, ARRP-21 and ZNF292 loci, we imputed SNPs in the region ±500 kb of PICALM and ZNF292 and in ±750 kb of the ARRP-21 locus with minor allele frequency >0.01 and imputation quality scores ≥0.99 in the CEU Hapmap phase 2 population20 and the 1000 Genomes project21 using Beagle22 and IMPUTE,23 respectively, and applied the QT analysis.
Results
QT analysis
Previous work has shown brain atrophy in patients with AD to be most pronounced in hippocampal and entorhinal cortical regions, as well as in WBV in MRI studies.7,24–26 The decreases in these areas and the corresponding increase in ventricular volume in the participants in this study are congruent with previous findings (Supplementary Figure 1). Although there are significant correlations between the neuroimaging traits that we measured (Supplementary Table 1), we aimed to identify structure-specific variants associated with disease and markers of general neurodegeneration (Table 1).
Table 1. Mean age, percentage female, mean APOE ε4 allele dosage and total n of control, MCI and AD subjects who passed the genetic and imaging quality control protocols for whole-brain volume (WBV) and all other (Other) quantitative trait analyses.
| Control | MCI | AD | |
|---|---|---|---|
| WBV (N=963) | |||
| Age | 74.99 | 74.86 | 75.38 |
| Sex (% female) | 49.3 | 39.2 | 51.8 |
| APOE ε4 | 0.32 | 0.66 | 0.82 |
| n | 284 | 434 | 245 |
| Other (N=939) | |||
| Age | 75.04 | 74.72 | 75.19 |
| Sex (% female) | 49.5 | 39.6 | 52.5 |
| APOE ε4 | 0.30 | 0.66 | 0.83 |
| n | 279 | 424 | 236 |
Abbreviations: AD, Alzheimer's disease; MCI, mild cognitive impairment.
In brief, 1118 subjects were genotyped using the Illumina 610K Beadchip, and standard sample and SNP quality control measures were implemented (see the ‘Materials and methods’ section). Samples classified as non-European were excluded based on ethnicity information and principal components analysis.14 Measures of entorhinal cortical thickness and volume, hippocampal volume, together with total brain and ventricular volumes were derived using automated regional analysis as described previously7 (see the ‘Materials and methods’ section). We implemented models with and without the SNP by disease interaction, the latter model allowing us to investigate the main SNP effect in addition to disease-associated SNP effects identified by the interaction term in the former model. Quantile–quantile plots and Manhattan plots of the results are shown in Supplementary Figures 2–5.
This analysis identified one SNP (Table 2a) with a disease-specific effect associated with entorhinal cortical volume at the genome-wide significance threshold of P<5 × 10⁻⁸ in an intron of the ZNF292 gene (rs1925690; P-value = 2.6 × 10⁻⁸; corrected P-value for equivalent number of independent QTs = 7.7 × 10⁻⁸; Figure 1a) and an intergenic SNP, flanking the ARPP-21 gene, with a main effect in entorhinal cortical thickness close to this threshold (rs11129640; P-value = 5.6 × 10⁻⁸; corrected P-value = 1.7 × 10⁻⁷; Figure 1b). Neither of these variants has been previously associated with neurodegeneration, nor is either significantly associated with AD in the recent GWASs.3,4 ZNF292 encodes a putative zinc-finger protein of unknown function. The disease-specific effect of this SNP is shown in Supplementary Figure 6. The ARPP-21 gene encodes a neuronal phosphoprotein enriched in regions of the brain receiving dopaminergic innervation.27 In all, 29 SNPs representing 21 different loci have main effects with P-values < 10−5 (Supplementary Table 2), and 24 SNPs representing 17 loci have disease-associated effects with P-values < 10−5 (Supplementary Table 3). Imputation of variants proximal to the ARPP-21 and ZNF292 loci (see the ‘Materials and methods’ section) identified a number of additional variants at P-values <10−4 proximal to rs11129640 (Supplementary Figure 7), but none in the case of the ZNF292 rs1925690 variant, Supplementary Figure 8). LD-based SNP grouping was carried out for the ARPP-21 and ZNF292 loci; however, this analysis did not reveal any further SNPs. A set-based analysis of the ARPP-21 locus using SNPs ± 750 kb of ARPP-21 as a set of genes and permuting 10 000 times, resulted in an empirical P-value < 10−4 and revealed 5 SNPs at P<0.05 passing the LD threshold (see the ‘Materials and methods’ section).
Table 2.
(a) Uncorrected P-values for SNPs that have marginal genome-wide significance; (b) PICALM locus SNPs (P-value < 10−5) from Harold et al.3
| (a) | ||||||||||||||
|---|---|---|---|---|---|---|---|---|---|---|---|---|---|---|
|
| ||||||||||||||
| SNP | Chromosome | Position | Nearest gene | Relation to gene | Beta | P-value | Trait | |||||||
| rs11129640 | 3 | 35117515 | ARPP-21 | Intergenic | −0.124 | 5.57 × 10⁻⁸ | ERT main | |||||||
| rs1925690 | 6 | 87923782 | ZNF292 | Intron | 2.99 × 10⁻⁴ | 2.56 × 10⁻⁸ | ERV disease | |||||||
| (b) | ||||||||||||||
|
| ||||||||||||||
| SNP | Chromosome | Position | Nearest gene | Relation to gene | Beta | ERT P-value | GWAS P-value | |||||||
|
| ||||||||||||||
| rs3851179 | 11 | 85546288 | PICALM | Intergenic | 0.043 | 0.034 | 1.9 × 10⁻⁸ | |||||||
| rs7941541 | 11 | 85536186 | PICALM | Intergenic | 0.049 | 0.019 | 2.1 × 10⁻⁷ | |||||||
| rs543293 | 11 | 85497725 | PICALM | Intergenic | 0.054 | 0.009 | 6.9 × 10⁻⁷ | |||||||
| rs1237999 | 11 | 85492678 | PICALM | Intergenic | 0.053 | 0.009 | 1.1 × 10⁻⁶ | |||||||
| rs541458 | 11 | 85465999 | PICALM | Intergenic | 0.052 | 0.013 | 2.3 × 10⁻⁶ | |||||||
| rs536841 | 11 | 85465472 | PICALM | Intergenic | 0.053 | 0.011 | 3.5 × 10⁻⁶ | |||||||
Abbreviations: AD, Alzheimer's disease; ERT, entorhinal cortical thickness; ERV, entorhinal cortical volume; GWAS, genome-wide association study; SNP, single-nucleotide polymorphism.
AD GWAS (GWAS P-value) and the uncorrected P-values in our main entorhinal cortex thickness (ERT P-value) quantitative trait analysis.
Figure 1.

(a) Manhattan plot of SNP effect P-values from the disease-specific entorhinal cortical volume analysis. (b) Manhattan plot of SNP effect P-values from the main entorhinal cortical thickness analysis. SNP, single-nucleotide polymorphism.
Table 3. Main entorhinal cortical thickness analysis gene-based results for genes with local FDR <0.1 (see the ‘Materials and methods’ section for details).
| Ensembl ID | Gene symbol | P-value | FDR |
|---|---|---|---|
| ENSG00000073921 | PICALM | 6.66 × 10⁻⁶ | 0.039 |
| ENSG00000100266 | PACSIN2 | 6.81 × 10⁻⁶ | 0.039 |
| ENSG00000175911 | AC127496.2 | 1.38 × 10⁻⁵ | 0.050 |
| ENSG00000196600 | SLC22A25 | 2.10 × 10⁻⁵ | 0.059 |
| ENSG00000146067 | AC145098.2 | 2.16 × 10⁻⁵ | 0.060 |
| ENSG00000203724 | C1orf53 | 2.97 × 10⁻⁵ | 0.068 |
| ENSG00000113811 | RP11-884K10.1 | 5.95 × 10⁻⁵ | 0.088 |
| ENSG00000124588 | NQO2 | 6.01 × 10⁻⁵ | 0.088 |
| ENSG00000182747 | SLC35D3 | 6.28 × 10⁻⁵ | 0.090 |
| ENSG00000176108 | CHMP6 | 7.36 × 10⁻⁵ | 0.095 |
Abbreviation: FDR, false discovery rate.
In light of recent large-scale GWASs for AD,3,4 we then sought to identify any corroboratory evidence in our analyses for the genome-wide significant variants at the CLU, PICALM and CR1 loci from these studies. The rs11136000 SNP in clusterin identified by Harold et al.3 and Lambert et al.4 is not significantly associated with any of the imaging QTs, nor is the rs6701713 variant in CR1 identified by Lambert et al.4 The PICALM-associated SNP rs3851179 identified by Harold et al.,3 the minor allele of which they found to have an odds ratio of 0.86, is associated with an increase in entorhinal cortical thickness (uncorrected P< 0.05; Table 2b) in our main effect analysis. We then performed LD-based SNP grouping in PLINK12 on the results of our entorhinal cortical thickness analysis. This highlighted the intronic PICALM SNP rs642949 (uncorrected P-value = 9.6 × 10⁻⁵) as being in LD with two further SNPs with P-values < 0.001 (Figure 2a). We also performed a set-based analysis in PLINK, using SNPs ± 100 kb of PICALM as a gene set and permuting 10 000 times. Of the 11 SNPs significant at P<0.05, 5 variants were independently significant (based on an r2 threshold of 0.5), resulting in an empirical P-value = 0.0034. To investigate the evidence of association at the PICALM locus further, we imputed SNPs with minor allele frequency >0.01 and imputation quality scores ≥0.99 in the CEU Hapmap phase 2 population20 and the 1000 Genomes project21 using Beagle22 and IMPUTE,23 respectively, and applied the QT analysis. Although none of the imputed SNPs reaches suggestive significance, there are a further eleven Hapmap phase 2 SNPs and five 1000 genome SNPs at P-values <10−3 (Figures 2b and c).
Figure 2.
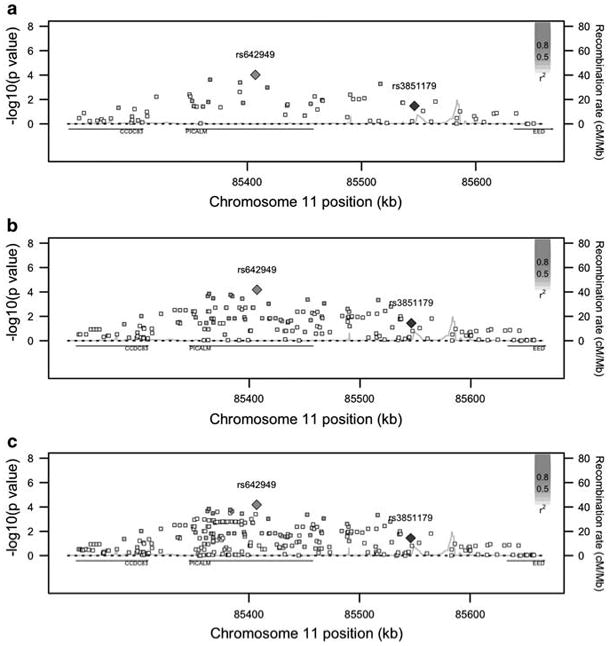
SNP effect P-values from the main entorhinal cortical thickness analysis in the region surrounding PICALM for (a) original results (b) HapMap phase 2 SNPs and (c) 1000 Genomes Project SNPs. rs3851179 (in blue) is the SNP identified in the Harold et al.3 AD GWAS. Figure 2 was adapted from SNAP34 output. AD, Alzheimer's disease; GWAS, genome-wide association study; SNP, single-nucleotide polymorphism. The color reproduction of this figure is available on the html full text version of the manuscript.
As there seemed to be multiple nominally positive SNPs in the region, we used a novel method for calculating gene-based P-values from GWA results (see the ‘Materials and methods’ section). We restricted our analysis to ∼20 000 protein-coding genes annotated in Ensembl v56 and mapped them to genotyped SNPs within 20 kb of the annotated coordinates. We calculated gene-wide P-values using a modified Fisher's method to combine P-values from correlated tests and applied a local false discovery rate. This method identified PICALM as the most significant gene in the main entorhinal cortical thickness analysis (P-value = 6.7 × 10⁻⁶; false discovery rate = 0.039; Table 3). The ARPP-21 gene was not significant in this analysis (false discovery rate = 1), most likely because of the most significant SNP being located outside our threshold of 20 kb. The method was also applied to the disease-specific entorhinal cortical volume analysis, revealing ZNF292 as the thirty-fifth most significant gene (false discovery rate = 0.25).
Discussion
We present a genome-wide QT study for brain atrophy as an endophenotype for AD pathology of >900 participants from the ADNI and AddNeuroMed projects. To our knowledge, this is the largest study integrating imaging measures and genetics in AD. We selected brain regions known to be affected by AD (such as the hippocampus, entorhinal cortex and whole brain) and in which atrophy has been highlighted by previous MRI studies.7,24–26,28 MRI scans were processed to produce volumetric measures of these regions of interest and also entorhinal cortical thicknesses. Genotyping data (∼478K SNPs) were integrated with the imaging traits in QT analyses.
We used this imaging QTL approach first for all subjects and then with disease status as an interaction effect because we reasoned that this study design would have greater power to detect disease susceptibility loci than a case versus control design. In the latter, more usual approach, the presence of clinically silent cases in the control group and susceptible but unaffected people presents a substantial confound. Using a measure of active disease as an endophenotype might help to overcome this problem.
Our design also includes a large number of MCI subjects, adding to the power of the study. However, many MCI subjects will not progress to AD and a recent meta-analysis by Mitchell et al.29 showed an annual conversion rate of 8.1% and a cumulative proportion of 33.6% for MCI conversion to dementia, although it is noted that some studies show higher proportions of conversion, and in all studies, some MCI subjects fail to progress only because of death. Although the findings we report in this study will require replication, we note that despite the relatively small sample size compared with GWASs (1000 versus > 10 000) it is striking that we observe main SNP and disease-specific effects that reach nominal genome-wide significance (Table 2a).
The most significant SNP (P = 6.54 × 10⁻⁸; main ERT analysis) we identify is proximal to the ARPP-21 gene, a regulator of calmodulin signaling, that is involved in the cellular cAMP signaling pathway, particularly in striatal medium spiny neurons.30 Calmodulin signaling has been widely implicated in AD pathogenesis (see the study by O'Day and Myre31 for a review). In addition to identifying common variants that are associated with disease susceptibility, we included an interaction term between disease status and the additive SNP effect in the analysis. Implementing this model with our QTs, we identified 24 SNPs correlated with the brain regions at P-values <10−5 and one SNP <10−6 (Supplementary Table 3). The most significant SNP (ERV; P-value = 3.45 × 10∼8) is in an intron in the ZNF292 gene, which codes for a zinc-finger protein expressed in the brain.32 Our disease-specific analysis highlights the association between the minor allele of this SNP (rs1925690) and increased entorhinal cortical volume (Supplementary Figure 6) in AD subjects, whereas the converse is evident in control individuals.
Our analysis suggests further evidence for the PICALM locus in neurodegeneration. Using a genecentric approach, we identify a number of SNPs contributing to a locus association with entorhinal cortical thickness (Figure 2). The PICALM variant identified by Harold et al.3 and other more significant variants in our study are associated with less atrophy in the entorhinal cortex, suggesting a protective effect. The PICALM protein is involved in clathrin-mediated endocytosis, inhibition of which has recently been shown to decrease levels of amyloid-β in brain interstitial fluid in mice.33
We have focused on a small number of regions known to be affected in AD and have conducted main and disease-specific effects for all SNPs in both the ADNI and the AddNeuroMed cohorts. Our study design was different from the previously published study of the ADNI cohort by Shen et al.6 in that we restricted our analysis to regions previously strongly implicated in the etiopathology of AD and reprocessed all neuroimages. This meant that we tested different phenotypes to those of Shen et al. in our combined ADNI and AddNeuroMed cohort. These differences and the design of the study by Shen et al. do not allow a direct comparison of the results, and we would consider that we have conducted an independent analysis of the data.
Our data provide further evidence of a causal role for PICALM in AD, demonstrate the power of endophenotype-genotype association studies and further identify two genes, namely ARPP-21 and ZNF292, as putative risk factors for this devastating and common neurodegenerative disease.
Supplementary Material
Acknowledgments
AddNeuroMed is funded through the EU FP6 program as part of InnoMed. In addition, we are grateful for additional support from the NIHR Specialist Biomedical Research Centre for Mental Health at the South London and Maudsley NHS Foundation Trust and King's College London, Institute of Psychiatry, London, United Kingdom. Data collection and sharing for this project were funded by the Alzheimer's Disease Neuroimaging Initiative (ADNI) (National Institutes of Health Grant U01 AG024904). ADNI is funded by the National Institute on Aging, the National Institute of Biomedical Imaging and Bioengineering, and through generous contributions from the following: Abbott, AstraZeneca AB, Bayer Schering Pharma AG, Bristol-Myers Squibb, Eisai Global Clinical Development, Elan Corporation, Genentech, GE Healthcare, GlaxoSmithKline, Innogenetics, Johnson and Johnson, Eli Lilly and Co., Medpace Inc., Merck and Co. Inc., Novartis AG, Pfizer Inc., F Hoffman-La Roche, Schering-Plough, Synarc Inc., and Wyeth, as well as nonprofit partners, the Alzheimer's Association and Alzheimer's Drug Discovery Foundation, with participation from the US Food and Drug Administration. Private sector contributions to ADNI are facilitated by the Foundation for the National Institutes of Health (http://www.fnih.org). The grantee organization is the Northern California Institute for Research and Education, and the study is coordinated by the Alzheimer's Disease Cooperative Study at the University of California, San Diego. ADNI data are disseminated by the Laboratory for NeuroImaging at the University of California, Los Angeles. This research was also supported by NIH grants P30 AG010129, K01 AG030514 and the Dana Foundation. We thank Mike Weale for assistance with the implementation of population stratification and are grateful to Cathryn Lewis, Amanda Myers and Peter Holmans for advice on the analysis. Data used in the preparation of this article were obtained from the Alzheimer's Disease Neuroimaging Initiative (ADNI) database (http://www.loni.ucla.edu/ADNI). As such, the investigators within the ADNI contributed to the design and implementation of ADNI and/or provided data, but did not participate in analysis or writing of this report. ADNI investigators include (complete listing available at http://www.loni.ucla.edu/ADNI/Collaboration/ADNI_Manuscript_Citations.pdf).
Footnotes
Conflict of interest: The authors declare no conflict of interest.
Supplementary Information accompanies the paper on the Molecular Psychiatry website (http://www.nature.com/mp)
References
- 1.Mueller SG, Weiner MW, Thal LJ, Petersen RC, Jack CR, Jagust W, et al. Ways toward an early diagnosis in Alzheimer's disease: the Alzheimer's Disease Neuroimaging Initiative (ADNI) Alzheimers Dement. 2005;1:55–66. doi: 10.1016/j.jalz.2005.06.003. [DOI] [PMC free article] [PubMed] [Google Scholar]
- 2.Lovestone S, Francis P, Strandgaard K. Biomarkers for disease modification trials—the innovative medicines initiative and AddNeuroMed. J Nutr Health Aging. 2007;11:359–361. [PubMed] [Google Scholar]
- 3.Harold D, Abraham R, Hollingworth P, Sims R, Gerrish A, Hamshere ML, et al. Genome-wide association study identifies variants at CLU and PICALM associated with Alzheimer's disease. Nat Genet. 2009;41:1088–1093. doi: 10.1038/ng.440. [DOI] [PMC free article] [PubMed] [Google Scholar]
- 4.Lambert JC, Heath S, Even G, Campion D, Sleegers K, Hiltunen M, et al. Genome-wide association study identifies variants at CLU and CR1 associated with Alzheimer's disease. Nat Genet. 2009;41:1094–1099. doi: 10.1038/ng.439. [DOI] [PubMed] [Google Scholar]
- 5.Potkin SG, Guffanti G, Lakatos A, Turner JA, Kruggel F, Fallon JH, et al. Hippocampal atrophy as a quantitative trait in a genome-wide association study identifying novel susceptibility genes for Alzheimer's disease. PloS One. 2009;4:e6501. doi: 10.1371/journal.pone.0006501. [DOI] [PMC free article] [PubMed] [Google Scholar]
- 6.Shen L, Kim S, Risacher SL, Nho K, Swaminathan S, West JD, et al. Whole Genome Association Study of Brain-Wide Imaging Phenotypes for Identifying Quantitative Trait Loci in MCI and AD: a Study of the ADNI Cohort. NeuroImage. 2010;53:1051–1063. doi: 10.1016/j.neuroimage.2010.01.042. [DOI] [PMC free article] [PubMed] [Google Scholar]
- 7.Simmons A, Westman E, Muehlboeck S, Mecocci P, Vellas B, Tsolaki M, et al. MRI measures of Alzheimer's disease and the AddNeuroMed study. Ann NYAcad Sci. 2009;1180:47–55. doi: 10.1111/j.1749-6632.2009.05063.x. [DOI] [PubMed] [Google Scholar]
- 8.Jack CR, Jr, Bernstein MA, Fox NC, Thompson P, Alexander G, Harvey D, et al. The Alzheimer's Disease Neuroimaging Initiative (ADNI): MRI methods. J Magn Reson Imaging. 2008;27:685–691. doi: 10.1002/jmri.21049. [DOI] [PMC free article] [PubMed] [Google Scholar]
- 9.McKhann G, Drachman D, Folstein M, Katzman R, Price D, Stadlan EM. Clinical diagnosis of Alzheimer's disease: Report of the NINCDS-ADRDA Work Group under the Auspices of Department of Health and Human Services Task Force on Alzheimer's Disease. Neurology. 1984;34:939–944. doi: 10.1212/wnl.34.7.939. [DOI] [PubMed] [Google Scholar]
- 10.Petersen RC, Smith GE, Waring SC, Ivnik RJ, Tangalos EG, Kokmen E. Mild cognitive impairment: clinical characterization and outcome. Arch Neurol. 1999;56:303–308. doi: 10.1001/archneur.56.3.303. [DOI] [PubMed] [Google Scholar]
- 11.Petersen RC, Doody R, Kurz A, Mohs RC, Morris JC, Rabins PV, et al. Current concepts in mild cognitive impairment. Arch Neurol. 2001;58:1985–1992. doi: 10.1001/archneur.58.12.1985. [DOI] [PubMed] [Google Scholar]
- 12.Purcell S, Neale B, Todd-Brown K, Thomas L, Ferreira MA, Bender D, et al. PLINK: a tool set for whole-genome association and population-based linkage analyses. Am J Human Genet. 2007;81:559–575. doi: 10.1086/519795. [DOI] [PMC free article] [PubMed] [Google Scholar]
- 13.International HapMap Consortium. The International HapMap Project. Nature. 2003;426:789–796. doi: 10.1038/nature02168. [DOI] [PubMed] [Google Scholar]
- 14.Price AL, Patterson NJ, Plenge RM, Weinblatt ME, Shadick NA, Reich D. Principal components analysis corrects for stratification in genome-wide association studies. Nat Genet. 2006;38:904–909. doi: 10.1038/ng1847. [DOI] [PubMed] [Google Scholar]
- 15.Simmons A, Westman E, Muehlboeck S, Mecocci P, Vellas B, Tsolaki M, et al. The AddNeuroMed framework for multi-centre MRI assessment of longitudinal changes in Alzheimer's disease: experience from the first 24 months. Int J Ger Psych. doi: 10.1002/gps.2491. in press. [DOI] [PubMed] [Google Scholar]
- 16.Fischl B, Dale AM. Measuring the thickness of the human cerebral cortex from magnetic resonance images. Proc Natl Acad Sci USA. 2000;97:11050–11055. doi: 10.1073/pnas.200033797. [DOI] [PMC free article] [PubMed] [Google Scholar]
- 17.Fischl B, Salat DH, Busa E, Albert M, Dieterich M, Haselgrove C, et al. Whole brain segmentation: automated labeling of neuroanatomical structures in the human brain. Neuron. 2002;33:341–355. doi: 10.1016/s0896-6273(02)00569-x. [DOI] [PubMed] [Google Scholar]
- 18.Fischl B, Salat DH, van der Kouwe AJ, Makris N, Segonne F, Quinn BT, et al. Sequence-independent segmentation of magnetic resonance images. NeuroImage. 2004;23(Suppl 1):S69–S84. doi: 10.1016/j.neuroimage.2004.07.016. [DOI] [PubMed] [Google Scholar]
- 19.Nyholt DR. A simple correction for multiple testing for single-nucleotide polymorphisms in linkage disequilibrium with each other. Am J Human Genet. 2004;74:765–769. doi: 10.1086/383251. [DOI] [PMC free article] [PubMed] [Google Scholar]
- 20.Frazer KA, Ballinger DG, Cox DR, Hinds DA, Stuve LL, Gibbs RA, et al. A second generation human haplotype map of over 3.1 million SNPs. Nature. 2007;449:851–861. doi: 10.1038/nature06258. [DOI] [PMC free article] [PubMed] [Google Scholar]
- 21.The 1000 Genomes Project. http://www1000genomesorg/.
- 22.Browning SR, Browning BL. Rapid and accurate haplotype phasing and missing-data inference for whole-genome association studies by use of localized haplotype clustering. Am J Human Genet. 2007;81:1084–1097. doi: 10.1086/521987. [DOI] [PMC free article] [PubMed] [Google Scholar]
- 23.Howie BN, Donnelly P, Marchini J. A flexible and accurate genotype imputation method for the next generation of genome-wide association studies. PLoS Genet. 2009;5:e1000529. doi: 10.1371/journal.pgen.1000529. [DOI] [PMC free article] [PubMed] [Google Scholar]
- 24.Kesslak JP, Nalcioglu O, Cotman CW. Quantification of magnetic resonance scans for hippocampal and parahippocampal atrophy in Alzheimer's disease. Neurology. 1991;41:51–54. doi: 10.1212/wnl.41.1.51. [DOI] [PubMed] [Google Scholar]
- 25.Convit A, De Leon MJ, Tarshish C, De Santi S, Tsui W, Rusinek H, et al. Specific hippocampal volume reductions in individuals at risk for Alzheimer's disease. Neurobiol Aging. 1997;18:131–138. doi: 10.1016/s0197-4580(97)00001-8. [DOI] [PubMed] [Google Scholar]
- 26.Jack CR, Jr, Petersen RC, Xu Y, O'Brien PC, Smith GE, Ivnik RJ, et al. Rate of medial temporal lobe atrophy in typical aging and Alzheimer's disease. Neurology. 1998;51:993–999. doi: 10.1212/wnl.51.4.993. [DOI] [PMC free article] [PubMed] [Google Scholar]
- 27.Hemmings HC, Jr, Girault JA, Williams KR, LoPresti MB, Greengard P. ARPP- 21 a cyclic AMP-regulated phosphoprotein (Mr = 21 000) enriched in dopamine-innervated brain regions. Amino acid sequence of the site phosphorylated by cyclic AMP in intact cells and kinetic studies of its phosphorylation in vitro J Biol Chem. 1989;264:7726–7733. [PubMed] [Google Scholar]
- 28.Risacher SL, Saykin AJ, West JD, Shen L, Firpi HA, McDonald BC. Baseline MRI predictors of conversion from MCI to probable AD in the ADNI cohort. Curr Alzheimer Res. 2009;6:347–361. doi: 10.2174/156720509788929273. [DOI] [PMC free article] [PubMed] [Google Scholar]
- 29.Mitchell AJ, Shiri-Feshki M. Rate of progression of mild cognitive impairment to dementia—meta-analysis of 41 robust inception cohort studies. Acta Psychiatr Scand. 2009;119:252–265. doi: 10.1111/j.1600-0447.2008.01326.x. [DOI] [PubMed] [Google Scholar]
- 30.Rakhilin SV, Olson PA, Nishi A, Starkova NN, Fienberg AA, Nairn AC, et al. A network of control mediated by regulator of calcium/calmodulin-dependent signaling. Science (New York, NY) 2004;306:698–701. doi: 10.1126/science.1099961. [DOI] [PubMed] [Google Scholar]
- 31.O'Day DH, Myre MA. Calmodulin-binding domains in Alzheimer's disease proteins: extending the calcium hypothesis. Biochem Biophys Res Commun. 2004;320:1051–1054. doi: 10.1016/j.bbrc.2004.06.070. [DOI] [PubMed] [Google Scholar]
- 32.Nagase T, Ishikawa K, Miyajima N, Tanaka A, Kotani H, Nomura N, et al. Prediction of the coding sequences of unidentified human genes. IX. The complete sequences of 100 new cDNA clones from brain which can code for large proteins in vitro. DNA Res. 1998;5:31–39. doi: 10.1093/dnares/5.1.31. [DOI] [PubMed] [Google Scholar]
- 33.Cirrito JR, Kang JE, Lee J, Stewart FR, Verges DK, Silverio LM, et al. Endocytosis is required for synaptic activity-dependent release of amyloid-beta in vivo. Neuron. 2008;58:42–51. doi: 10.1016/j.neuron.2008.02.003. [DOI] [PMC free article] [PubMed] [Google Scholar]
- 34.Johnson AD, Handsaker RE, Pulit SL, Nizzari MM, O'Donnell CJ, de Bakker PI. SNAP: a web-based tool for identification and annotation of proxy SNPs using HapMap. Bioinformatics (Oxford, England) 2008;24:2938–2939. doi: 10.1093/bioinformatics/btn564. [DOI] [PMC free article] [PubMed] [Google Scholar]
Associated Data
This section collects any data citations, data availability statements, or supplementary materials included in this article.