Abstract
Purpose
To simultaneously image brain lesions and veins in multiple sclerosis.
Methods
An interleaved sequence was developed to simultaneously acquire 3D T2*-weighted (or susceptibility-weighted, SW) and fluid-attenuated inversion recovery (FLAIR) images on a 3.0T MRI system. The pulse sequence parameters were calculated to minimize signal perturbation from steady state while maintaining acceptable image contrast and scan time. Fifteen multiple sclerosis patients were enrolled in this prospective study and underwent a standard MS imaging protocol. In addition, SW and FLAIR images were acquired separately and also in an interleaved manner. The SW and FLAIR images were combined into one image to visualize lesions and penetrating veins. The contrast ratios between white matter lesions and penetrating veins were compared between the interleaved sequence and the individual non-interleaved acquisitions.
Results
Interleaved scanning of the FLAIR and the SW pulse sequences was achieved, producing aligned images, and with similar image contrast as in the non-interleaved images. A total of 1076 lesions were identified in all patients on the combined SW-FLAIR image, of which 968 lesions (90%) had visible penetrating veins. Lesion-to-vein contrast ratio was 32.7 ± 17.9 (mean ± standard deviation) for the interleaved sequence compared to 28.1 ± 13.7 using the separate acquisitions (P<0.001).
Conclusion
The feasibility of interleaved acquisition of susceptibility-weighted and FLAIR images was demonstrated. This sequence provides self-registered images and facilitates the visualization of veins in brain lesions.
Keywords: Interleaved scanning, FLAIR*, FLAIR SWI, multiple sclerosis, steady state
INTRODUCTION
Detection of focal lesions in the white matter (WM) plays a central role in the radiologic diagnosis of multiple sclerosis (MS) (1). WM lesions are not specific to MS, though, as they are also found in other neurological conditions such as small vessel disease, migraine, acute disseminated encephalomyelitis, and neuromyelitis optica (2,3). Visualization of veins running through the lesions is thought to be an additional confirmatory feature for the diagnosis of MS (4–6). Veins are more commonly visualized on susceptibility-weighted (SW, or T2*-weighted) gradient echo sequences (7–9). Combining the information from images such as T2-weighted FLAIR (fluid-attenuated inversion recovery) which visualizes lesions with high contrast and SW images which depict the veins more clearly may greatly facilitate the identification of perivenous lesions (10,11). The combined images show the MS lesions as hyperintense signal penetrated by the hypointense veins, likely improving detection of lesions with penetrating veins.
The individual FLAIR and T2*/SW images may be combined in various ways, for example by directly multiplying the FLAIR and the magnitude T2* images as in the FLAIR* technique (11), or by multiplying the FLAIR image by a calculated SW imaging (SWI) phase image (8), as in FLAIR SWI (10). Synthetic images constructed by combining separate acquisitions are prone to patient movement between the two scans. This necessitates the use of image registration techniques to align the images, which might cause image blurring and are error-prone. As a result, the reconstruction pipeline becomes complicated, less robust, and slower. To minimize image registration errors and improve practical implementation, we propose an interleaved pulse sequence to simultaneously acquire SW and FLAIR images. In this report, we describe the interleaved pulse sequence and demonstrate its feasibility for visualizing veins penetrating lesions in MS.
METHODS
Non-interleaved SW and FLAIR protocols
Full-brain 3D FLAIR images were acquired using sagittal three-dimensional (3D) acquisition as part of the site’s standard MS protocol. In addition, 3D SW (T2*-weighted) images were acquired, and together these images were used to reconstruct the reference combined SW-FLAIR image. The scan parameters for FLAIR were: repetition time (TR) = 4800 ms, echo time (TE) = 302 ms (contrast-equivalent TE = 129 ms), inversion time (TI) = 1650 ms, TSE echo train length = 167, echo-spacing = 3.3 ms, T2-preparation = 125 ms, field of view (FOV) = 256 mm × 256 mm × 180 mm, voxel size = 1 mm × 1 mm × 1 mm, number of signal averages = 2, two dimensional SENSE factor = 2.5 × 2.5. The total acquisition time for FLAIR was 5 min 31 sec. The 3D SW sequence used a flow-compensated echo-planar imaging (EPI)-accelerated gradient echo with the same FOV and voxel size = 0.7 mm × 0.7 mm × 0.5 mm, TR/TE = 47/25 ms, flip angle = 20°, number of signal averages = 1, EPI factor = 15, and SENSE factor of 2 × 2, and scan duration of 2 min 22 sec.
Interleaved SW-FLAIR
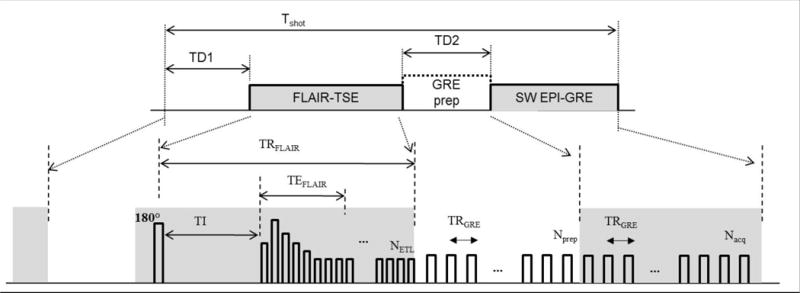
The proposed interleaved 3D SW-FLAIR pulse sequence consists of alternating FLAIR and GRE modules separated by two preparation periods (Fig. 1). The FLAIR module consists of an inversion pulse, inversion delay period, and a variable-flip-angle turbo spin echo (TSE) readout. The SW module consists of a train of EPI-accelerated gradient echo (EPI-GRE) readout segments. Two preparation intervals are inserted before the start of the FLAIR and EPI-GRE modules, respectively, to mitigate the interruption in the steady state. The TD1 delay period before the FLAIR readout is chosen to allow magnetization recovery through T1 relaxation that produces image contrast similar to the non-interleaved FLAIR image. In the second preparation period (TD2) prior to the start of the EPI-GRE module, a preparation sequence is performed consisting of a train of RF pulses of the same flip angle and TR as in the EPI-GRE sequence in order to drive the magnetization to approach its steady state value and reduce k-space modulation.
Fig. 1.

The interleaved 3D SW-FLAIR pulse sequences. The preparation interval TD1 allows T1 recovery prior to the FLAIR turbo-spin echo (FLAIR-TSE) acquisition. The GRE preparation module (GRE prep) during the TD2 period consists of dummy repetitions of the GRE sequence to help the magnetization reach its steady state. The susceptibility weighted EPI-accelerated GRE module (SW EPI-GRE) follows with Nacq TR periods in each shot. The respective repetition, inversion and echo times are denoted. Abbreviations: TR, repetition time; TE, echo time; Tshot, shot interval; TI, inversion time; NETL, eco train length of the TSE readout; Nprep, number of GRE preparation periods; Nacq, number of GRE acquisition periods.
Bloch equation simulation of the interleaved sequences were performed using the extended phase graph method (12), assuming the following (M0, T1, T2) parameters: WM, (0.7, 850 ms, 85 ms); GM, (0.8, 1400 ms, 100 ms); CSF, (1.0, 4000 ms, 2000 ms); and blood, (1.0, 1500 ms, 30 ms). Simulations were repeated to account for spatial variations in the B1 field. The TR of the FLAIR module in the interleaved sequence was reduced to 2500 ms, approximately equal to the shortest possible TR. The TD1 delay interval was determined based on simulations of the tissue signal at various TD1 delays to assure sufficient CSF suppression and signal-to-noise ratio of WM and GM. Next, the number of RF pulses in the GRE-preparation module (TD2 interval) was chosen such that the magnetization of GM, WM, and veins reach 90% of their steady state values, accounting for up to 10% variation in the flip angle. Following the TD2 preparation module, an EPI- GRE readout train consisting of 45 TR periods was collected. This pulse train was chosen such that FLAIR and GRE take the same number of shots (Nshot = 69) to complete the scan. Both pulse sequences used a linear k-space ordering such that both sequences crossed the center of k-space at approximately the same time.
MS Studies
MS Subjects
MRI studies of the brain were performed using a 15-channel head coil on a 3.0 T Ingenia scanner (Philips Healthcare, Best, The Netherlands). Fifteen MS patients were enrolled in this study (nine women and six men, age = 43±11 (mean ± standard deviation) years). Table 1 summarizes the patient’s clinical characteristics. The study was approved by our Institutional Review Board, and all volunteers gave written informed consent.
Table 1.
Patient characteristics.
| Female | n = 9 |
| Male | n = 6 |
| Age | 41.5 years (median), 26–62 (range) |
| Clinical course | |
| Relapsing-remitting | n = 10 |
| Relapsing MS (possibly in progressive stage) | n = 3 |
| Secondary progressive | n = 1 |
| Primary progressive | n = 1 |
| Disease duration (from first symptoms) | 11.5 years (median), 1–43 years (range) |
| Extended disability status score (EDSS) | 1.75 (median), 0–4 (range), one missing score |
Imaging Protocol
A standard MS imaging protocol was extended to include the acquisition of 3D SW images. The individual 3D FLAIR and 3D SW images were acquired with minimal delay between the two acquisitions to minimize position differences. The interleaved 3D SW and FLAIR sequence was acquired immediately after the non-interleaved sequences, using identical spatial coverage and resolution as in the separate 3D FLAIR and SW protocols. The implementation utilized a framework for interleaved scanning based on rapid switching between separately defined scans at arbitrary time points (13). The scan parameters of all pulse sequences were the same as described in the previous section, with the values for TD1 and TD2 preparation as reported below in the Results section.
Data analysis
All images were interpolated to a 0.5 × 0.5 × 0.5 mm3 resolution and reformatted into the axial plane. The FLAIR* and the interleaved FLAIR* images were reconstructed by multiplying the corresponding FLAIR and magnitude T2* images. Image registration was performed to align the non-interleaved FLAIR image to the corresponding T2* image using rigid-body registration in the Statistical Parametric Mapping (SPM) software version 12 (www.fil.ion.ucl.ac.uk).
An experienced neuroradiologist inspected the FLAIR* images and identified the locations of all WM lesions, separately marking lesions with visible penetrating veins. Regions of interest (ROIs) were placed in the identified WM lesions such that the ROI samples the lesion and the penetrating vein, if visible. Location-matched ROIs were placed on the interleaved FLAIR* images. For each ROI with visible veins, the maximum and the minimum intensity values were attributed to the lesion and the vein, respectively. To mitigate the effect of noise, the top and the bottom 5% (chosen somewhat arbitrarily) of the intensity values within the ROI (size ~100 pixels) were averaged to yield Slesion and Svein. The contrast ratio between lesions and veins (CRlesion-vein) was calculated using the follow formula: CR = (Slesion-Svein)/(Slesion+Svein). The Wilcoxon signed rank test was used to test for differences in the contrast ratios on the FLAIR* and the interleaved FLAIR* images using the Matlab Statistics Toolbox (Mathworks, Natick, MA). Statistical significance was assumed for P<0.05. All the values were expressed as (mean ± standard) deviation.
RESULTS
Simulations
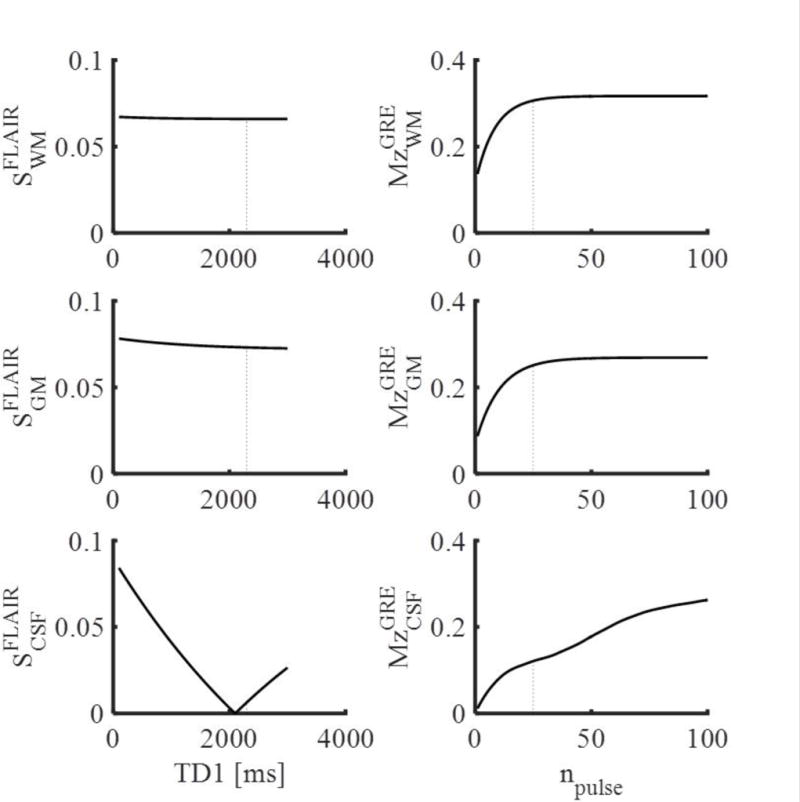
Variations in the preparation period TD1 affected CSF suppression, but had little impact on the WM and GM levels (Fig. 2). Therefore, the TD1 delay was selected to provide comparable T1 recovery and CSF suppression, and to match the scan time of the non-interleaved FLAIR sequence. TD1 was set to 2310 ms, for an effective FLAIR TR of 4810 ms. The small 10 ms difference in TR from the original FLAIR was due to numerical round-off needed for scan interleaving. The number of RF pulses in the GRE-preparation module (TD2 interval) required to reach 90% of the steady state value of the magnetization of WM, GM, and veins was 19–27, accounting for 10% error in flip angle. Thus, a train of 25 pulses was used for a total preparation time TD2 of 1175 ms, which allowed recovery of WM, GM and veins to 97%, 93%, and 92% of their steady state values, respectively, at the nominal flip angle (Fig. 2). The total scan duration to acquire the interleaved 3D SW and FLAIR images was 9 min 13 sec.
Fig. 2.

Results of Bloch simulations of the interleaved SW-FLAIR pulse sequence showing the FLAIR signal after different TD1 delay periods (left), and the longitudinal magnetization at the end of the TD2 preparation period consisting of npulse RF pulses. The dotted lines indicate the selected values: TD1 =2310 ms and npulse = 25.
MS Studies
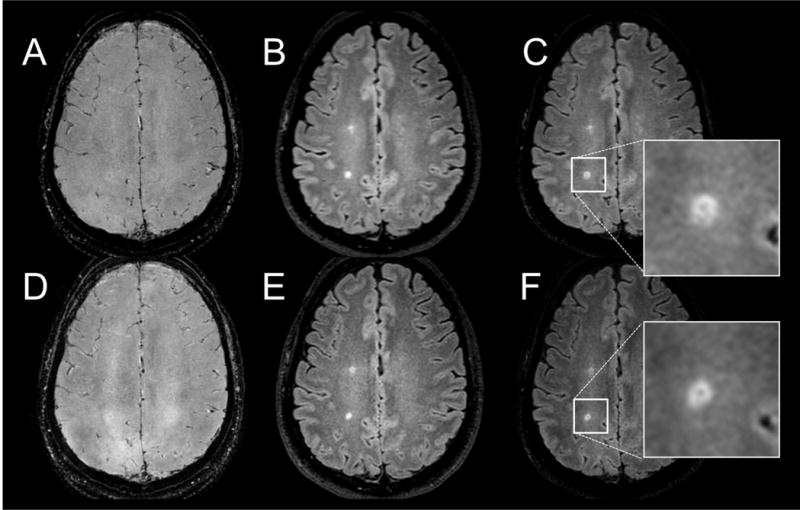
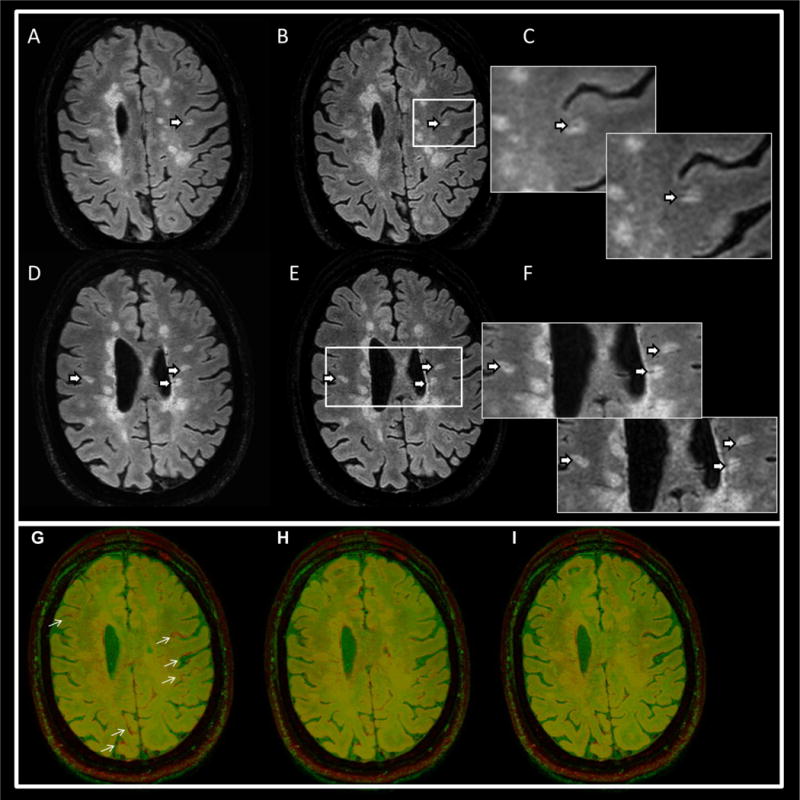
Scanning with the interleaved sequence was completed successfully on all patients. Figure 3 shows representative FLAIR, SW (T2*-weighted) and calculated FLAIR* images acquired with the conventional and the proposed interleaved sequences from one MS patient. Visually, tissue contrast and image quality of the interleaved FLAIR and T2*w images were comparable to those from the separate acquisitions. A slight signal modulation was observed in the interleaved T2*w images (Fig. 4). The computed FLAIR* images show the veins running through MS lesions (arrows) with similar conspicuity in both scans. Figure 4 shows corresponding slices from FLAIR* and interleaved FLAIR* images in three MS patients, again showing the visibility of lesions-penetrating veins on both sequences.
Fig. 3.

A reformatted axial slice in the brain of an MS patient showing 3D T2*-weighted gradient echo (A) and FLAIR (B) images acquired separately. The corresponding interleaved images are shown in D and E. The corresponding reconstructed FLAIR* images are shown in C and F. A vein running through a periventricular lesion is visible on both FLAIR* images (arrows), and in their magnified views (C, F).
Fig. 4.

Upper panel: representative FLAIR* images from two MS patients acquired with separate FLAIR and T2* acquisitions (A, D) and the corresponding images from the interleaved sequences (B, E). The arrows point to perivenous lesions. Magnified views in (C, F) depict the lesion areas for FLAIR* (upper left) and the interleaved FLAIR* (lower right) images. The bottom panel shows an image overlay of FLAIR (red) on T2* (green) in one MS patient. The separate acquisitions (G) shows small differences in head position (arrows), which disappear with image registration (H). The images acquired with the interleaved pulse sequence are automatically aligned (I).
Although the separate FLAIR and T2* acquisitions were performed with minimal delay between the two scans to minimize motion, motion was noted in a few cases. Image registration was necessary to correct for position errors. On the other hand, the interleaved sequence consistently produced aligned images (Fig. 4).
A total of 1076 lesions were identified in all patients. The average number of lesions per subject was (72 ± 59). Of all lesions, 968 lesions (90%) had visible veins. The average WM lesion-to-vein contrast ratio was (32.7 ± 17.9) with the interleaved sequence compared to (28.1 ± 13.7) with the separate acquisitions of FLAIR and SW (P<0.001).
DISCUSSION
The potential diagnostic specificity of the central vein sign (CVS) has recently attracted increased interest in the MS research community (14,15). The introduction of methods combining SW and FLAIR images allowed visualization and assessment of the venous volume inside the MS plaques (16). We have demonstrated the feasibility of an interleaved sequence for simultaneous acquisition of SW and FLAIR images which produces self-registered images. This approach simplifies the reconstruction pipeline, avoids errors and image blur arising from image registration, and allows almost real-time availability of the combined SW-FLAIR image.
In this study 90% of the lesions showed penetrating veins, in agreement with the previous work showing 69–89% prevalence of vein in MS lesions (16–18). A small increase in lesion-vein contrast was observed in the interleaved FLAIR* image, which is likely due to slight differences in the relaxation pathways in the interleaved sequence. The primary goal of this study was to show feasibility of interleaved SW and FLAIR acquisition while preserving image contrast. Hence, the observed contrast improvement was rather incidental. However, we recognize that the interleaved sequences carries the potential to utilize the interaction between the FLAIR and the GRE modules to optimize a specific image quality target such as lesion-vein contrast in the SW-FLAIR image, lesion contrast on FLAIR, or CSF suppression on GRE. These targets will be the subject of a future study.
Head motion may occur any time during the scan. In practice, however, patients are usually instructed to remain still during data acquisition, and are allowed to adjust their position for more comfort in between individual acquisitions. Motion thus more frequently occur between the scans. Because the position of the head is primarily determined by the time of acquiring the center of k-space, interleaved acquisition, which acquires the center of k-space of the two images within a few seconds, produces images with the same head position. In contrast, the temporal separation is a few minutes when the two images are acquired separately, increasing the odds of inter-scan patient movement. On the other hand, intrascan patient motion alters the point spread function and causes image blurring or ghosting, but does not affect position. All pulse sequences, separate or interleaved, are susceptible to blurring/ghosting from intrascan motion, but the prolonged apparent acquisition times of the interleaved sequences make it slightly more susceptible to intrascan motion.
The method by which the SW and FLAIR images are combined may also provide another way to improve visualization of penetrating veins in a fashion similar to the optimized combination of T2w and FLAIR images for enhancing lesion contrast (19). Optimized versions of FLAIR-SWI and FLAIR* (10,11) may similarly be obtained using a combination of T2* or SWI images with FLAIR that maximizes a measure of veins and iron detectability and lesion-vein contrast.
We implemented the interleaved SW-FLAIR sequence utilizing recovery periods and preparation modules to control the magnetization evolution to minimize disturbance of the steady state conditions for the individual pulse sequences. Due to its long relaxation times, CSF did not reach steady state during the short TD2 period. Residual signal modulation from CSF was observed on the interleaved SW images, although it did not adversely affect the final lesion-vein contrast. A preparation module to further attenuate the CSF signal inconsistency on the T2* acquisition, for example using an inversion pulse, may help alleviate this problem.
The interleaved sequence permitted simultaneous SW and FLAIR acquisition at the expense of ~80 seconds increase in scan time. While long scan times increase the susceptibility to intrascan motion effects, we did not observe large motion effects in this study. Techniques employing compressed sensing can help to reduce the data acquisition time (20). In addition, redundant information in the two sequences may also allow a multimodal compressed sensing implementation (21,22) that could further reduce the scan time. Ongoing studies will explore these methods.
In conclusion, we have developed and implemented an interleaved sequence for simultaneous acquisition of SW and FLAIR images. The proposed pulse sequence eliminates the need for image registration and avoids the associated registration errors and blur. This will help future development of methods that optimally combine these images for improved visualization of lesion-penetrating veins.
References
- 1.Polman CH, Reingold SC, Banwell B, et al. Diagnostic criteria for multiple sclerosis: 2010 revisions to the McDonald criteria. Ann Neurol. 2011;69:292–302. doi: 10.1002/ana.22366. [DOI] [PMC free article] [PubMed] [Google Scholar]
- 2.Solomon AJ, Watts R, Ontaneda D, Absinta M, Sati P, Reich DS. Diagnostic performance of central vein sign for multiple sclerosis with a simplified three-lesion algorithm. Mult Scler J. 2017 doi: 10.1177/1352458517726383. [DOI] [PMC free article] [PubMed] [Google Scholar]
- 3.Eckstein C, Saidha S, Levy M. A differential diagnosis of central nervous system demyelination: Beyond multiple sclerosis. J Neurol. 2012;259:801–816. doi: 10.1007/s00415-011-6240-5. [DOI] [PubMed] [Google Scholar]
- 4.Mistry N, Abdel-Fahim R, Samaraweera A, Mougin O, Tallantyre E, Tench C, Jaspan T, Morris P, Morgan PS, Evangelou N. Imaging central veins in brain lesions with 3-T T2*-weighted magnetic resonance imaging differentiates multiple sclerosis from microangiopathic brain lesions. Mult Scler J. 2016;22:1289–1296. doi: 10.1177/1352458515616700. [DOI] [PubMed] [Google Scholar]
- 5.Tallantyre EC, Dixon JE, Donaldson I, Owens T, Morgan PS, Morris PG, Evangelou N. Ultra-high-field imaging distinguishes MS lesions from asymptomatic white matter lesions. Neurology. 2011;76:534–539. doi: 10.1212/WNL.0b013e31820b7630. [DOI] [PMC free article] [PubMed] [Google Scholar]
- 6.Kau T, Taschwer M, Deutschmann H, Schönfelder M, Weber JR, Hausegger KA. The “central vein sign”: Is there a place for susceptibility weighted imaging in possible multiple sclerosis? Eur Radiol. 2013;23:1956–1962. doi: 10.1007/s00330-013-2791-4. [DOI] [PubMed] [Google Scholar]
- 7.Gaitán MI, De Alwis MP, Sati P, Nair G, Reich DS. Multiple sclerosis shrinks intralesional, and enlarges extralesional, brain parenchymal veins. Neurology. 2013;80:145–151. doi: 10.1212/WNL.0b013e31827b916f. [DOI] [PMC free article] [PubMed] [Google Scholar]
- 8.Reichenbach JR, Venkatesan R, Schillinger DJ, Kido DK, Haacke EM. Small vessels in the human brain: MR venography with deoxyhemoglobin as an intrinsic contrast agent. Radiology. 1997;204:272–277. doi: 10.1148/radiology.204.1.9205259. [DOI] [PubMed] [Google Scholar]
- 9.Haacke EM, Xu Y, Cheng Y-CN, Reichenbach JR. Susceptibility weighted imaging (SWI) Magn Reson Med. 2004;52:612–618. doi: 10.1002/mrm.20198. [DOI] [PubMed] [Google Scholar]
- 10.Grabner G, Dal-Bianco A, Schernthaner M, Vass K, Lassmann H, Trattnig S. Analysis of multiple sclerosis lesions using a fusion of 3.0 T FLAIR and 7.0 T SWI phase: FLAIR SWI. J Magn Reson Imaging. 2011;33:543–549. doi: 10.1002/jmri.22452. [DOI] [PubMed] [Google Scholar]
- 11.Sati P, George IC, Shea CD, Gaitán MI, Reich DS. FLAIR*: a combined MR contrast technique for visualizing white matter lesions and parenchymal veins. Radiology. 2012;265:926–32. doi: 10.1148/radiol.12120208. [DOI] [PMC free article] [PubMed] [Google Scholar]
- 12.Hennig J. Multiecho imaging sequences with low refocusing flip angles. J Magn Reson. 1988;78:397–407. [Google Scholar]
- 13.Henningsson M, Mens G, Koken P, Smink J, Botnar RM. A new framework for interleaved scanning in cardiovascular MR: Application to image-based respiratory motion correction in coronary MR angiography. Magn Reson Med. 2015;73:692–696. doi: 10.1002/mrm.25149. [DOI] [PubMed] [Google Scholar]
- 14.Rovira À, Wattjes MP, Tintoré M, et al. Evidence-based guidelines: MAGNIMS consensus guidelines on the use of MRI in multiple sclerosis-clinical implementation in the diagnostic process. Nat Rev Neurol. 2015;11:471–482. doi: 10.1038/nrneurol.2015.106. [DOI] [PubMed] [Google Scholar]
- 15.Sati P, Oh J, Constable RT, et al. The central vein sign and its clinical evaluation for the diagnosis of multiple sclerosis: a consensus statement from the North American Imaging in Multiple Sclerosis Cooperative. Nat Rev Neurol. 2016;12:714–722. doi: 10.1038/nrneurol.2016.166. [DOI] [PubMed] [Google Scholar]
- 16.Dal-Bianco A, Hametner S, Grabner G, et al. Veins in plaques of multiple sclerosis patients – a longitudinal magnetic resonance imaging study at 7 Tesla –. Eur Radiol. 2015;25:2913–2920. doi: 10.1007/s00330-015-3719-y. [DOI] [PubMed] [Google Scholar]
- 17.Kilsdonk ID, Lopez-Soriano A, Kuijer JPA, De Graaf WL, Castelijns JA, Polman CH, Luijten PR, Geurts JJJG, Barkhof F, Wattjes MP. Morphological features of MS lesions on FLAIR at 7 T and their relation to patient characteristics. J Neurol. 2014;261:1356–1364. doi: 10.1007/s00415-014-7351-6. [DOI] [PubMed] [Google Scholar]
- 18.Kuchling J, Ramien C, Bozin I, Dorr J, Harms L, Rosche B, Niendorf T, Paul F, Sinnecker T, Wuerfel J. Identical lesion morphology in primary progressive and relapsing-remitting MS—an ultrahigh field MRI study. Mult Scler. 2014;20:1866–1871. doi: 10.1177/1352458514531084. [DOI] [PubMed] [Google Scholar]
- 19.Gabr RE, Hasan KM, Haque ME, Nelson FM, Wolinsky JS, Narayana PA. Optimal combination of FLAIR and T2-weighted MRI for improved lesion contrast in multiple sclerosis. J Magn Reson Imaging. 2016;44:1293–1300. doi: 10.1002/jmri.25281. [DOI] [PMC free article] [PubMed] [Google Scholar]
- 20.Lustig Michael, Donoho David L, Santos Juan M, Pauly JM. Compressed sensing MRI. Signal Process Mag IEEE. 2008;25:72–82. [Google Scholar]
- 21.Ji S, Dunson D, Carin L. Multitask compressive sensing. IEEE Trans Signal Process. 2009;57:92–106. doi: 10.1109/TSP.2010.2070796. [DOI] [PMC free article] [PubMed] [Google Scholar]
- 22.Bilgic B, Goyal VK, Adalsteinsson E. Multi-contrast reconstruction with Bayesian compressed sensing. Magn Reson Med. 2011;66:1601–1615. doi: 10.1002/mrm.22956. [DOI] [PMC free article] [PubMed] [Google Scholar]


