

Abstract
Purpose
The bSSFP acquisition enables high spatiotemporal resolution for hyperpolarized 13C MRI at 3T, but is limited by spectral contamination from adjacent resonances. The purpose of this study was to develop a framework for in vivo dynamic high resolution imaging of hyperpolarized [1-13C]pyruvate and [1-13C]lactate generated in vivo at 3T by simplifying the spectrum through the use of selective suppression pulses.
Methods
Spectral suppression pulses were incorporated into the bSSFP sequence for suppression of [1-13C]alanine and [1-13C]pyruvate-hydrate signals, leaving only the pyruvate and lactate resonances. Subsequently, the bSSFP pulse width, time-bandwidth, and repetition time were optimized for imaging these dual resonances.
Results
The spectral suppression reduced both the alanine and pyruvate-hydrate signals by 85.5 ± 4.9% and had no significant effect on quantitation of pyruvate to lactate conversion (liver: P = 0.400, kidney: P = 0.499). High resolution (2 × 2 mm2 and 3 × 3 mm2) sub-second 2D coronal projections and 3D 2.5 mm isotropic images were obtained in rats and tumor-bearing mice with 1.8-5 s temporal resolution, allowing for calculation of lactate-to-pyruvate ratios and kPL.
Conclusion
The developed framework presented here shows the capability for dynamic high resolution volumetric hyperpolarized bSSFP imaging of pyruvate-to-lactate conversion on a clinical 3T MR scanner.
Keywords: 13C, hyperpolarized, pyruvate, SSFP, metabolism
Introduction
New developments in hyperpolarized (HP) 13C MRI via dissolution dynamic nuclear polarization have facilitated real-time detection of [1-13C]pyruvate biodistribution and metabolism in various diseases, including cancer and diabetes (1–4). The conversion of pyruvate to lactate as a potential biomarker in disease prognosis and aggressiveness has been studied extensively, including in a recent successful phase I clinical trial focused on prostate cancer patients, and in recent ongoing phase II clinical trials focused on prostate cancer, brain cancer, and liver metastases (5–9). Because the hyperpolarized magnetization is nonrecoverable and constantly depleted due to the effects of RF excitation and metabolism, multiple rapid imaging strategies have been investigated, including MR spectroscopic imaging (MRSI), spiral, and echo planar imaging (EPI) (10–15). Each of these sequences provides adequate spectral resolution, but has limitations in additionally achieving both high spatial and temporal resolution with sufficient SNR.
Recent publications have focused on optimizing high spatiotemporal resolution imaging for HP 13C MRI with the balanced steady-state free precession (bSSFP) sequence since it offers the highest SNR per unit time (16–19). The advantage of the bSSFP sequence is readily apparent when imaging single non-metabolized compounds, such as urea, or multiple non-metabolized compounds with large chemical shift differences (17,20–23). Because of the SNR efficiency, 1.5 mm 3D Isotropic (0.0034 cm3) HP 13C imaging is currently possible with the bSSFP sequence at 3T (18), which is a higher spatial resolution compared to current EPI (24,25), MRSI (15), and spiral imaging (26,27) acquisitions. However, due to the difficulty in dealing with off-resonance with this sequence (i.e. banding artifacts), imaging of HP [1-13C]pyruvate and the resulting metabolites is much more challenging because of the small chemical shift between the metabolites and the need for high spectral selectivity. As described previously (16), various approaches have been developed with the bSSFP sequence, such as using a multi-echo or low bandwidth readout (28–31), low flip angle bSSFP for metabolite-specific imaging (32,33), and a variable phase advance approach (30). These approaches have shown the ability to acquire most, if not all, resonances within the pyruvate spectrum at relatively high spatial resolutions compared to other spectroscopic and imaging techniques, especially at high fields in preclinical systems. However, the disadvantages of these approaches, such as long TR, relatively low SNR, and complex reconstructions involving several assumptions, make them sub-optimal for high spatiotemporal resolution imaging at clinical field strengths.
A recent publication presented a method for acquiring HP [1-13C]pyruvate, [1-13C]lactate, and [13C,15N2]urea simultaneously with the bSSFP sequence at 14T by optimizing the RF pulse and TR for spectral selectivity and cycling through the three transmit frequencies for dynamic imaging (16). This approach exploits the large frequency separation at 14T, as well as the use of higher strength gradients available on a preclinical system, which enables short RF pulses and short TRs. Translation of this approach to clinically relevant field strengths is considerably more challenging due to the ∼5x closer frequency separation (i.e. compared to 3T). The RF pulse widths necessary for spectral selectivity are closer to ∼20 ms, leading to long TRs and a frequency response unsuitable for bSSFP imaging due to B0 inhomogeneity and consequent banding artifacts.
The goal of this study was to develop a new method for fast, high resolution imaging of [1-13C]pyruvate and its metabolic product [1-13C]lactate at 3T with the bSSFP sequence. Spectral suppression pulses centered on [1-13C]alanine and [1-13C]pyruvate-hydrate were played prior to imaging to reduce the problem to a two-peak system. The combination of these spectral suppression pulses and a carefully chosen RF pulse width and time-bandwidth (TBW) allowed for a TR of ∼15 ms. This method was tested on phantoms and applied in healthy rat kidneys and tumor-bearing mice with 2D coronal projections and 3D imaging at <5 s temporal resolution.
Methods
Sample preparation
[1-13C]pyruvate was prepared as described previously (18). ∼24 uL of sample was polarized in a HyperSense system (Oxford Instruments, Abingdon, UK) operating at 3.35 T and 1.35 K for ∼1 hour, and subsequently dissolved in ∼4.5 mL of NaOH/Tris buffer, resulting in a 80 mM [1-13C]pyruvate solution at physiologic pH and temperature.
Animal preparation and hardware
All animal studies were done under protocols approved by the University of California San Francisco Institutional Animal Care and Use Committee (IACUC). Healthy Sprague-Dawley rats and tumor-bearing mice (transgenic adenocarcinoma of mouse prostate or TRAMP (34)) were used during the course of these experiments. The rats and mice were anesthetized using isoflurane (1.5%, gas flow rate 1 L/min) and inserted with lateral tail vein catheters.
All experiments were performed on a 3 Tesla clinical MRI scanner (GE Healthcare, Waukesha, WI) using custom dual-tuned 13C/1H quadrature transceiver radiofrequency (RF) coils (8 cm diameter for rats and 5 cm diameter for mice). All animals were placed in a supine position on a heated pad within the coil for the duration of the experiments. A 1 mL enriched [13C]urea vial phantom (6.0 M) was placed on top of the animal near the abdominal region and used for frequency and power calibration.
MR Experiments
A 20 ms Shinnar-Le Roux (SLR) designed spectral suppression pulse (Fig. 1A) with an excitation bandwidth of 150 Hz (Fig. 1B) was used during the course of these studies (35). The suppression capability of the pulse was first tested with a slab-selective magnetic resonance spectroscopy (MRS) sequence using a thermal 13C phantom that consisted of four different sized chambers containing 1 M sodium lactate (185 ppm), 2 M sodium formate (a doublet at 166 and 173 ppm), 1 M sodium bicarbonate (163 ppm), and 1 M alanine (178 ppm). The MRS parameters were: one 50 mm axial slab covering the phantom, RF compensated progressive flip angle scheme, adiabatic double-spin echo (36), 120 ms TE, 25 kHz spectral width, 2048 spectral points, 3 s temporal resolution, 10 time-points, with one suppression pulse played out prior to each time-point, with the suppression pulse waveform ending 1 ms before slab excitation. The suppression pulse center frequency was centered on lactate and moved downfield in 10 Hz increments up to 180 Hz.
Figure 1.
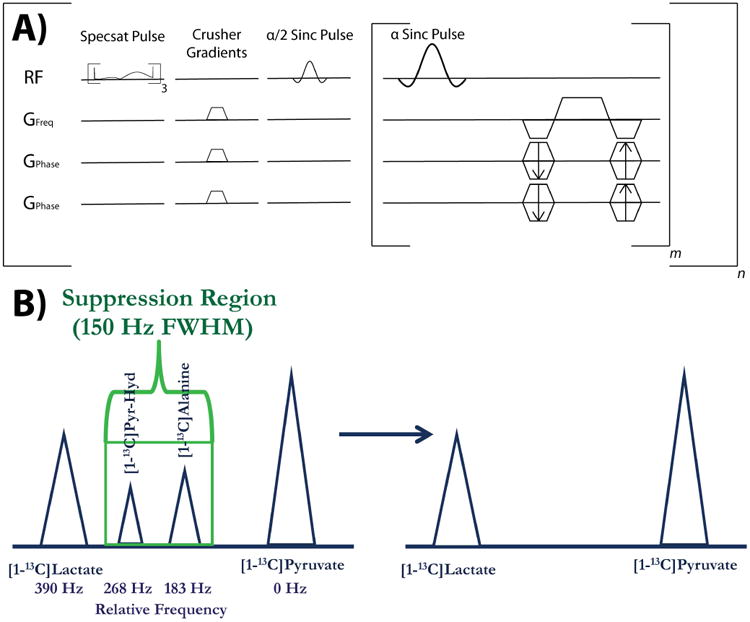
Depiction of pulse sequence and spectral suppression region. (A) Pulse sequence diagram for the 3D bSSFP sequence used in these studies, with the spectral suppression (Specsat) pulses and crusher gradients being played out 3 times and one time, respectively, prior to imaging. The sequence consists of m phase encodes and n time-points, with the 2D version sequence featuring one fewer set of phase encode gradients for projection imaging. (B) The suppression region for the spectral suppression pulse is shown here in the context of suppressing the two main peaks between [1-13C]pyruvate and [1-13C]lactate, [1-13C]alanine and [1-13C]pyruvate-hydrate. The relative frequency separation in Hz for 3T is shown below the spectrum.
Subsequently, the pulse was also tested in vivo in rats with the slab-selective MRS sequence, with each animal undergoing one scan with spectral suppression and one scan without spectral suppression. The in vivo parameters were: two 12 mm axial slabs, one localized on liver and one on kidney, RF compensated progressive flip angle scheme, double-spin echo, 120 ms TE, 25 kHz spectral width, 2048 spectral points, 3 s temporal resolution, 10 time-points, with one suppression pulse (centered ∼158 Hz upfield of lactate, between the alanine and pyruvate-hydrate resonances) played out prior to each time-point, ending 1 ms before slab excitation. All scans started at 20 s after beginning of injection and 3 mL of 80 mM [1-13C]pyruvate was injected over 12 s via tail vein catheters in six different rats.
Unless otherwise noted all subsequent acquisitions used a custom 13C bSSFP sequence, with α/2–TR/2 preparation pulses and α-TR/2-α/2 flip back pulses storing remaining magnetization on the longitudinal axis (18). Figure 1A shows the entire 3D version of the sequence (without the flip back pulses), with the spectral suppression pulses and associated crusher gradients. The RF pulse width and TR/TE necessary for bSSFP imaging were simulated and chosen to selectively excite either pyruvate or lactate, whereby a 6.8 ms sinc pulse (TBW = 2) led to a TR/TE of 15.3/7.65 ms. The selectivity was tested using both a thermal [13C]urea phantom and hyperpolarized [13C,15N2]urea phantom. The phantom experiments were acquired by alternating between on-resonance and 390 Hz off-resonance.
Initial in vivo bSSFP images were acquired as coronal projections with slight variations in parameters for sequence optimization based on available SNR. These studies utilized the following general parameters: 12 × 6 cm2 FOV, 60 × 30 matrix size for 2 × 2 mm2 in-plane resolution (or 40 × 20 for 3 × 3 mm2), progressive flip angle scheme (increasing along time, constant within each time-point, similar to schemes described previously (37,38)), 6 time-points and 5 s temporal resolution for each metabolite, three suppression pulses played before each time-point as described above. An alternating center frequency scheme was utilized, with each metabolite acquired every 2.5 s. All scans started at 20 s after beginning of injection and 3 mL of 80mM [1-13C]pyruvate was injected over 12 s via tail vein catheters in four different rats. A dynamic 2D CSI sequence was used for comparison in three rats of dynamic lactate-to-pyruvate ratios and had the following parameters: 8 cm coronal FOV, axial 8 cm slab, 8 × 8 matrix size leading to 10 × 10 mm2 in-plane resolution, 5 kHz spectral width, 256 spectral points, TR of 76 ms, progressive flip angle scheme, 6 time-points.
Further optimized in vivo bSSFP images were also acquired as coronal projections and utilized the following general parameters: 12 × 6 cm2 FOV, 40 × 20 for 3 × 3 mm2 in-plane resolution, progressive flip angle scheme, 10-13 time-points and 3.6 s temporal resolution for each metabolite, three suppression pulses played before each time-point as described above. An alternating center frequency scheme was utilized, with each metabolite acquired every 1.8 s. All scans started at 5 s after beginning of injection and 3 mL of 80mM [1-13C]pyruvate was injected over 12 s via tail vein catheters in three different rats.
3D rat studies utilized the following general parameters: 12 × 6 × 2 cm3 FOV, 48 × 24 × 8 matrix size, progressive flip angle scheme, 10 time-points and 3.6 s temporal resolution for each metabolite, three suppression pulses played before each time-point as described above. 3D tumor-bearing mice studies utilized the following general parameters: 8 × 4 × 4 cm3 FOV, 32 × 16 × 16 matrix size, 2.5 mm isotropic resolution, progressive flip angle scheme, 10 time-points and 3.6 s temporal resolution for each metabolite, three suppression pulses played before each time-point as described above. An alternating center frequency scheme was utilized in both sets of studies, with each metabolite acquired every 1.8 s. Each 3D acquisition was undersampled along the time dimension by using a different undersampling pattern for each time-point, which resulted in 70% undersampling for rat studies and 75% undersampling for mouse studies. A local low rank plus sparse (LLR+S) algorithm was used for reconstruction, as described previously (39). Briefly, the LLR+S algorithm enforces both low rank and sparse constraints via iterative soft thresholding on singular values and sparse coefficients to reconstruct undersampled dynamic MRI.
For anatomic reference, 3D bSSFP proton images (16 × 8 × 4.8 cm, 256 × 128 × 80, 5.1 ms TR, 50° flip angle) were acquired for rats and T2-weighted fast spin echo proton (6 × 6 × 8 cm, 256 × 192 × 40, 7.6 s TR) images were obtained for mice.
Data and Statistical Analysis
All data was reconstructed and analyzed in Matlab (MathWorks, Natick, Massachusetts, USA), except the 2D CSI, which was analyzed in SIVIC (40), and carbon overlays onto proton data were done in Osirix (41). Lactate-to-pyruvate ratios from the slab-selective MRS acquisitions were calculated from integration of summed (through time) magnitude spectra. Percentage suppression of alanine and pyruvate-hydrate was calculated based on percent change in alanine-to-pyruvate ratios and pyruvate-hydrate-to-pyruvate ratios, respectively. Statistical significance of the comparison between acquisitions with and without spectral suppression were performed using a paired sample t-test in Matlab and a P-value < 0.05 was considered significant.
kPL from the 2D bSSFP rat acquisitions was calculated using the model described in Maidens et al. (38), which assumes unidirectional conversion from pyruvate to lactate. Additionally, the T1 of pyruvate was kept fixed during the fitting process, while allowing the T1 of lactate and kPL to vary. Since this model was designed based on acquisitions with single RF pulses, such as EPI, and to account for the use of variable flip angles during the bSSFP acquisition, a single effective flip angle was calculated for each time-point based on the depleted Mz magnetization during the imaging. This depletion was calculated by modeling the signal decay of the bSSFP sequence using the signal equation taken from Svensson et al. (42):
| [1] |
where E1 = exp(-TR/T1), E2 = exp(-TR/T2), n is the RF pulse number, and T1 and T2 assumed to be 25 s and 1.5 s, respectively. The Mz,0 was updated after every time-point to account for T1 decay between successive time-points. The resulting effective flip angles for each time-point were calculated in the following manner:
| [2] |
where i is the time-point, Mz,post is the Mz immediately after completion of imaging and Mz,pre is the Mz immediately before beginning of imaging. An initial SNR threshold based on pyruvate signal was used to filter out low SNR voxels.
Results
Spectral Suppression Pulse Phantom and in vivo Experiments
Figure 2 shows the effect of the spectral suppression pulse at different frequency offsets from the lactate resonance, with offsets ≥100 Hz showing no effect. The signal level at ≥100 Hz (Fig. 2A green line) equaled the signal level without any spectral saturation pulses played out (Fig. 2A dashed line). Therefore, with the offset set to 158 Hz in vivo, within the liver (Fig. 2B and 2C) and kidneys (Fig. 2D and 2E), the pulse was able to successfully suppress both alanine and pyruvate-hydrate without having an effect on the lactate or pyruvate resonances. Specifically, alanine and pyruvate-hydrate in the liver were suppressed by 89.0 ± 5.1% and 90.7 ± 4.1%, respectively, and by 84.1 ± 4.2% and 83.4 ± 5.3% in the kidneys, respectively. Calculations of lactate-to-pyruvate ratios showed no statistically significant difference between spectral suppression and no spectral suppression in either liver (P = 0.400) or kidney (P = 0.499), indicating no significant effect on quantitative analysis.
Figure 2.
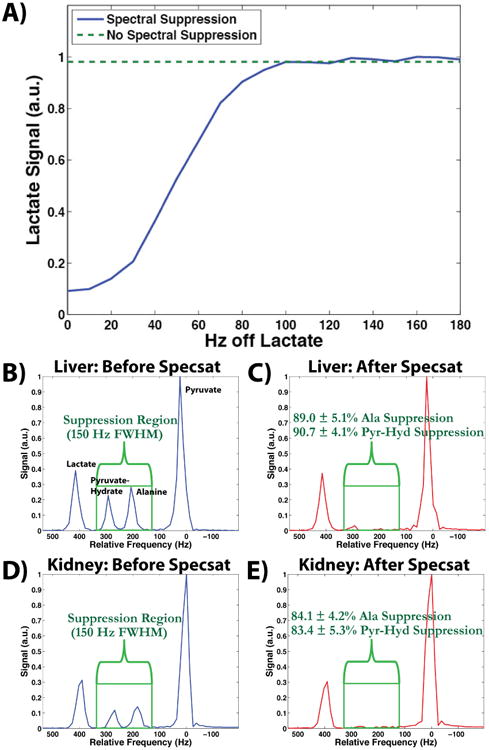
Slab-selective MRS results of the spectral suppression pulse. (A) The effect of the spectral suppression pulse is shown as a function of the distance of the spectral suppression pulse center frequency to the lactate peak in a thermal phantom (blue line). At ≥100 Hz the pulse has no effect on the lactate peak, which is indicated by the green dashed line and is representative of the baseline lactate signal when no spectral suppression pulses are present. (B, C) Parts B and C show the spectrum from a liver slab before and after the spectral suppression pulses, respectively. The pyruvate and lactate peaks remain unaffected, while the alanine and pyruvate-hydrate peaks are sufficiently suppressed by 89.0 ± 5.1% and 90.7 ± 4.1%, respectively. (D, E) Parts D and E show similar results from a kidney slab as parts B and C, with the alanine and pyruvate-hydrate peaks sufficiently suppressed by 84.1 ± 4.2% and 83.4 ± 5.3%, respectively.
Excitation pulse train simulations
Figure 3 shows the simulations of the frequency response for a α = 60° 6.8 ms sinc pulse (TBW = 2) and 15.3 ms TR at ± 25 Hz around the on-resonance frequency (Fig. 3A) and 390 Hz off-resonance frequency (Fig. 3B). The simulations demonstrated successful individual selectivity of pyruvate and lactate with the bSSFP sequence as there was minimal excitation 390 ± 25 Hz off-resonance with this combination of pulse width, time-bandwidth, and TR. The [13C]urea phantom results (Fig. 3C and 3D) matched the simulations, having ∼100:1 selectivity. Additionally, based on the suppression percentages detailed previously, the simulations of the bSSFP signal response near alanine and pyruvate-hydrate, and the relative production of each compound based on the slab-selective MRS, the signal contribution of those resonances in the image amounted to <5%.
Figure 3.
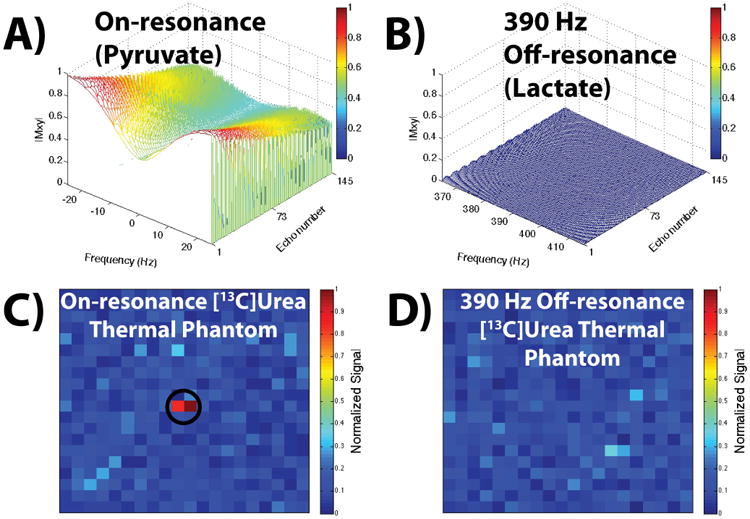
Simulated and experimental bSSFP signal responses. (A, B) Simulations of a α = 60° 6.8 ms sinc pulse (TBW = 2) with a 15.3 ms TR. Part A shows the frequency response on-resonance, i.e. when the transmit frequency is set to pyruvate, and part B shows the frequency response 390 Hz off-resonance, i.e. at the lactate resonance. Part B shows negligible excitation 390 ± 25 Hz off-resonance for this pulse width, TBW, and TR, indicating no contamination of the pyruvate image with lactate signal (and vice-versa when the transmit frequency is set to lactate due to the symmetric frequency response). (C, D) Parts C and D show the thermal phantom acquisition with the aforementioned pulse and TR, with the on-resonance and off-resonance responses matching the simulations in parts A and B.
2D bSSFP Imaging and Comparison to 2D CSI
Figure 4 shows successful acquisition of projection images of each metabolite from a 20 s scan start time at both 2 × 2 mm2 (Fig. 4A-C) and 3 × 3 mm2 (Fig. 4D-F) in-plane resolution, with clear visualization of biodistribution within the heart, vasculature, and kidneys at both resolutions. Comparison of the 2D CSI and bSSFP acquisitions revealed a similar increasing trend in normalized dynamic lactate-to-pyruvate ratios between the two acquisitions. This matching trend was seen for the first four time-points in each kidney (normalized to the highest lactate-to-pyruvate ratio for each type of acquisition). The SNR was too low in the last two time-points of the bSSFP acquisition for accurate lactate-to-pyruvate calculation.
Figure 4.
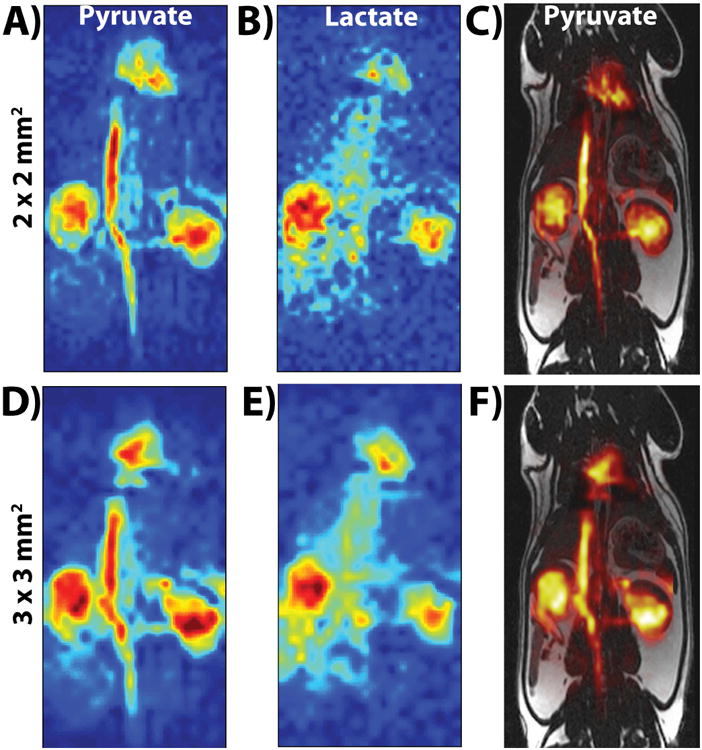
Parts A (pyruvate) and B (lactate) show the first time-point (20 s after start of injection) of the 2 × 2 mm2 in-plane resolution bSSFP acquisition, while parts D (pyruvate) and E (lactate) show the first time-point of the 3 × 3 mm2 in-plane resolution bSSFP acquisition. Parts C and F show the carbon pyruvate image overlaid onto the 1H anatomical image. The SNR (>40 for pyruvate and >15 for lactate) was high enough at both spatial resolutions to visualize pyruvate and lactate distribution in kidneys, heart, and vasculature. All images were zero-filled for display purposes.
Figure 5A and Figure 5B show the time-points of pyruvate and lactate, respectively, from a 2D 3 × 3 mm2 dynamic coronal projection (the scan started 5 s after start of injection). The signal from pyruvate lasted throughout all the time-points, particularly in the kidneys, while lactate was present for approximately 22 s before the SNR became too low for visualization. Figure 5C shows the resulting kPL map, with the resulting values matching up well with literature values for healthy rat kidneys (kPL ≈ 0.013 s-1) and vasculature (kPL ≈ 0.004 s-1) (43). Figure 5D shows the AUClac/AUCpyr map, with the trend of AUC ratio values agreeing well with the kPL values based on qualitative analysis, such as the heart and vasculature having relatively lower AUC ratios and kPL, with kidneys and liver being relatively higher (44,45).
Figure 5.
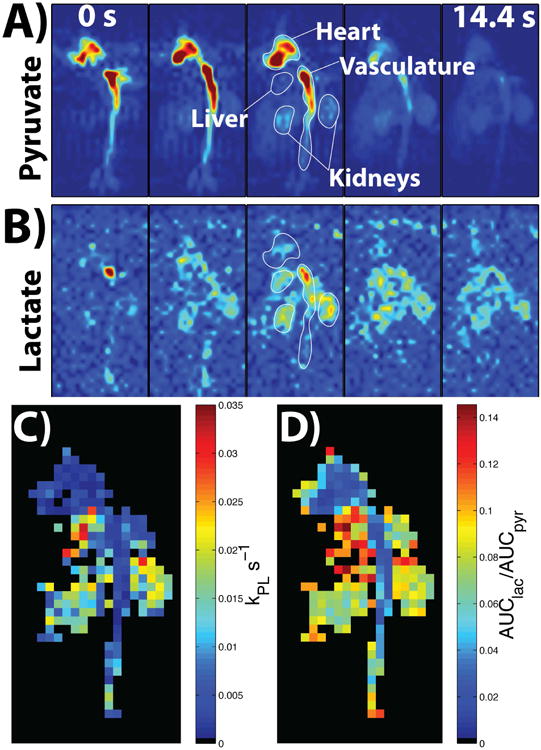
Parts A and B show the resulting images of pyruvate and lactate, respectively, from all the time-points of the 2D dynamic coronal projection scan, which started at 5 s after the start of injection (represented by the 0 s in the first time-point). The SNR was high enough to visualize heart, vasculature, and kidneys for both metabolites, with the pyruvate signal lasting in the kidneys to the last time-point. Part C shows the resulting kPL map with voxels in the vasculature and kidney featuring values that match up well with literature values (kPL ≈ 0.013 s-1 in kidneys and kPL ≈ 0.004 s-1 in vasculature (43)). Part D shows the AUClac/AUCpyr map, with the AUC ratio values agreeing well with the kPL values based on qualitative analysis, i.e. low heart and vasculature AUC ratio and kPL, higher liver AUC ratio and kPL, with kidneys being in between (44). The images in parts A and B were zero-filled for display purposes, while kPL and AUC ratio maps are at native resolution.
3D bSSFP Imaging
Figures 6 and 7 show all the slices from a representative time-point of each metabolite as well as the dynamics of the sum along the slice dimension from the 3D 2.5 mm isotropic dynamic acquisition for both rat kidney imaging (Fig. 6A for pyruvate and 6B for lactate) and mouse tumor imaging (Fig. 7A for pyruvate and 7B for lactate). The SNR was high enough to again visualize the uptake, biodistribution and metabolism of both metabolites in both studies, although the signal appeared to last longer in the tumor-bearing mice, probably due to higher lactate production in the tumor region compared to a healthy rat.
Figure 6.
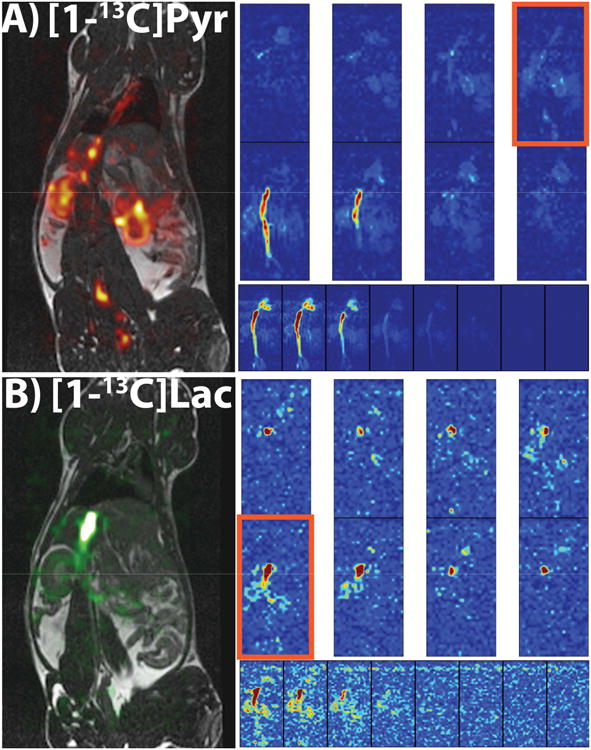
In vivo 3D dynamic rat imaging results. (A, B) Results from a 3D dynamic 2.5 mm isotropic resolution acquisition in a healthy rat. Parts A and B are of pyruvate and lactate, respectively. Each part features a 3D view of a representative time-point (top two rows), all the time-points of the sum along the slice dimension (bottom row) showing how long the signal lasts for each metabolite, and a carbon overlay on a 1H anatomical image of the slice outlined in orange. The SNR was also high enough in this acquisition to visualize each metabolite in heart, vasculature, and kidneys, although the signal doesn't last as long as the 2D coronal projections due to smaller voxel sizes, especially with lactate. All images were zero-filled for display purposes.
Figure 7.
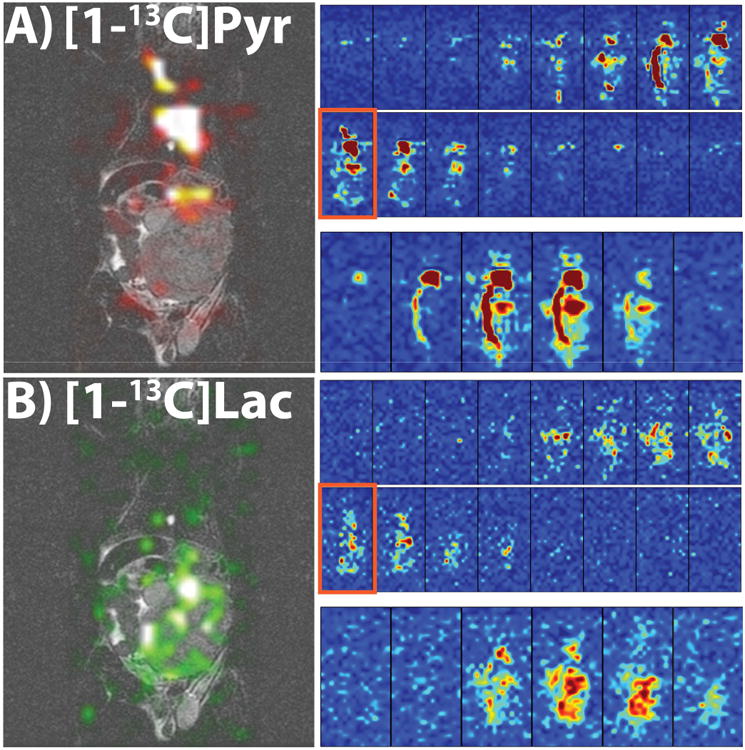
In vivo 3D dynamic tumor-bearing mouse results. (A, B) Results from a 3D dynamic 2.5 mm isotropic resolution acquisition in a tumor-bearing mouse. Parts A and B are of pyruvate and lactate, respectively, and the presented views are similar to Figure 6A and 6B. The SNR was high enough to visualize the metabolites and heart and tumor, with the signal lasting longer than in the rats, potentially due to a larger production of lactate in the tumor. All images were zero-filled for display purposes.
Discussion
We have developed an approach for high resolution dynamic [1-13C]pyruvate and [1-13C]lactate imaging with spectrally-suppressed bSSFP at a clinically relevant field strength of 3T and investigated its feasibility in preclinical studies. By combining spectral suppression pulses and an optimized pulse width and TBW, and TR, we were able to provide a framework for imaging [1-13C]pyruvate and [1-13C]lactate with the bSSFP sequence at higher spatiotemporal resolutions than previously done at 3T. Considering the challenge of controlling the bSSFP frequency response around the tight spectral spacing of resonances in the [1-13C]pyruvate system, reducing the problem to a two-peak system with the spectral suppression pulses was very advantageous. While in this study we ignored the contribution of bicarbonate because of a low effective flip angle based on the bSSFP signal response (∼3°) and low SNR at the achieved spatial resolutions, additional spectral suppression pulses can be added to suppress bicarbonate during the acquisition.
This approach was not designed to resolve all the resonances of [1-13C]pyruvate and all its metabolites, and other approaches would need to be utilized to incorporate [1-13C]alanine, [1-13C]pyruvate-hydrate, and/or [1-13C]bicarbonate imaging. As mentioned in the introduction, and displayed in Figure 1B, the tight spacing of the resonances would conventionally require considerably long RF pulses to selectively excite each individual resonance, especially with alanine resonating only 85 Hz away from pyruvate-hydrate and 183 Hz away from pyruvate. With the TR consequently elongated as well, the susceptibility to banding artifacts would be increased due to the bSSFP frequency response. The approach presented here was designed for pyruvate-to-lactate conversion imaging, but could be modified to help alleviate this issue by spectrally suppressing only one resonance at a time, thereby allowing more flexibility with the RF pulse width, either with a sinc pulse or an alternate selective RF pulse design (46).
The optimization of flip angle scheme, spatial resolution, and temporal resolution is a constant challenge with HP 13C imaging due to the nonrecoverable magnetization decay. The parameters chosen for the initial studies presented here were designed for high spatial and temporal resolution with sufficient SNR for calculation of lactate-to-pyruvate ratios and kPL. Thermal phantom studies demonstrated no effect on the lactate or pyruvate resonances directly when applying the suppression pulse. Based on the comparison to the 2D CSI data, the trend of calculated lactate-to-pyruvate ratio was similar over a 20 s temporal window before the lactate SNR was too small for quantitative analysis. Similarly, the 3D rat data showed the capability of obtaining high resolution 3D isotropic images of both pyruvate and lactate, but was again limited in lactate SNR over the course of the full temporal window. Acquisitions of high spatiotemporal resolution data can be limited by lactate production in the region of interest, in this case the kidneys. Conversely, the 3D TRAMP data provided higher lactate SNR in the tumor region, reflecting more lactate production. Imaging of produced lactate in healthy rat kidneys is most likely restricted to 2D projection or slice-selective imaging with a high in-plane resolution to acquire adequate lactate SNR over the temporal window necessary for accurate quantitation of pyruvate to lactate conversion. Starting the scans at 5 s was shown to be a good delay to visualize uptake, distribution, and metabolism of pyruvate, with 20 s being slightly too late as the build-up of lactate was already considerable and affected subsequent parameter fitting.
Calculation of kPL with the bSSFP sequence presents additional challenges due to multiple RF pulses needed for phase encoding and relatively longer acquisition times. The signal decay is therefore a combination of not only kPL and T1, but also effects from flow, B0/B1 inhomogeneity in the coil, and other metabolism, which may result in faster than anticipated signal decay. While all sequences have to deal with these effects in some fashion, bSSFP specifically is very challenging due to the frequency response, where deviation from the on-resonant conditions can result in considerable deviations from the intended flip angle scheme. The model used for calculating kPL fitted both kPL and lactate T1, with the resulting T1's being considerably shorter than expected in the kidneys, i.e. in the range of ∼3-10 s versus expected ∼15-25 s, which could be explained by the aforementioned effects and may represent an aggregate signal decay term. While kPL values agreed with the literature as discussed in Figure 5, the relatively low calculated lactate T1 may indicate a modification to the model needs to be made to incorporate bSSFP signal decay for more accurate calculation of these parameters.
Recently acquired data in human cancer patients with a 5T GE SpinLab system offers promising results for high spatiotemporal imaging of pyruvate and lactate due to increased polarization, higher injection doses, larger organs, and, in some cases, higher lactate production (6–8). Based on the banding artifacts seen in Figure 3A due to the 15.3 ms TR, future work will focus on incorporating an improved selective RF pulse design (46) for better off-resonance sensitivity and shorter pulse widths in the bSSFP readout. Initial simulations suggest the feasibility of an optimized ∼2 ms pulse width and ∼7 ms TR, which would cut the imaging time by half and improve SNR due to the shorter effective echo time. Utilizing a linear ramp preparation scheme (16,47) can also reduce off-resonance sensitivity, and allow imaging of other produced metabolites, such as bicarbonate. These additions would help alleviate some potential issues with additional B0 and B1 inhomogeneity (19) problems arising from human-sized FOVs and clinical setups compared to the more homogenous acquisitions used here with the small preclinical volume coils. While the bSSFP sequence is relatively robust to B1 inhomogeneity (16), B0 inhomogeneity can be accounted for in part by the improved selective RF pulse design and the linear ramp preparation scheme and in part by the effects being lower for 13C acquisitions compared to 1H due to the four-fold lower gyromagnetic ratio. Furthermore, the spectral suppression pulses have a wide excitation bandwidth that would still successfully suppress alanine and pyruvate-hydrate that may shift due to the B0 inhomogeneity. Additionally, the suppression effect would still be high in the presence of B1 inhomogeneity since three pulses would be played out along with crusher gradients, although additional pulses could be added without any effect on the scan time.
Acknowledgments
We gratefully acknowledge Dr. Irene Marco-Rius, Dr. Robert Bok, Lucas Carvajal, and Mark van Criekinge for all their help with the experiments, as well as grant support from NIH P41EB013598, R01EB017449, R01CA183071 and R01EB013427. NIH K01DK099451 supported CVM.
References
- 1.Ardenkjaer-Larsen JH, Fridlund B, Gram A, Hansson G, Hansson L, Lerche MH, Servin R, Thaning M, Golman K. Increase in signal-to-noise ratio of > 10,000 times in liquid-state NMR. Proc Natl Acad Sci U S A. 2003;100:10158–10163. doi: 10.1073/pnas.1733835100. [DOI] [PMC free article] [PubMed] [Google Scholar]
- 2.Kurhanewicz J, Vigneron DB, Brindle K, et al. Analysis of cancer metabolism by imaging hyperpolarized nuclei: prospects for translation to clinical research. Neoplasia. 2011;13:81–97. doi: 10.1593/neo.101102. [DOI] [PMC free article] [PubMed] [Google Scholar]
- 3.Laustsen C, Ostergaard JA, Lauritzen MH, Norregaard R, Bowen S, Sogaard LV, Flyvbjerg A, Pedersen M, Ardenkjaer-Larsen JH. Assessment of early diabetic renal changes with hyperpolarized [1-13C]pyruvate. Diabetes Metab Res Rev. 2013;29:125–129. doi: 10.1002/dmrr. [DOI] [PubMed] [Google Scholar]
- 4.Bertelsen LB, Nielsen PM, Qi H, Nørlinger TS, Zhang X, Stødkilde-jørgensen H, Laustsen C. Diabetes Induced Renal Urea Transport Alterations Assessed with 3D hyperpolarized 13C,15N-Urea. Magn Reson Med. 2016 doi: 10.1002/mrm.26256. [DOI] [PubMed] [Google Scholar]
- 5.Nelson SJ, Kurhanewicz J, Vigneron DB, et al. Metabolic imaging of patients with prostate cancer using hyperpolarized [1-13C]pyruvate. Sci Transl Med. 2013;5:198ra108. doi: 10.1126/scitranslmed.3006070. [DOI] [PMC free article] [PubMed] [Google Scholar]
- 6.Chen H, Larson PEZ, Gordon JW, et al. Phase II Clinical Hyperpolarized 13C 3D-Dynamic Metabolic Imaging of Prostate Cancer using a B1-insensitive Variable Flip Angle Design. Proc Intl Soc Mag Reson Med. 2017;25:0725. [Google Scholar]
- 7.Gordon JW, Chen H, Larson PEZ, et al. Human Hyperpolarized C-13 MRI Using a Novel Echo-Planar Imaging (EPI) Approach. Proc Intl Soc Mag Reson Med. 2017;25:0728. doi: 10.1002/MRM26123.4. [DOI] [Google Scholar]
- 8.Granlund KL, Vargas HA, Lyashchenko SK, et al. Utilizing hyperpolarized MRI in prostate cancer to assess metabolic dynamics and histopathologic grade. Proc Intl Soc Mag Reson Med. 2017;25:0727. [Google Scholar]
- 9.Zhu Z, Marco-rius I, Ohliger MA, et al. Hyperpolarized 13C Dynamic Breath-held Molecular Imaging to Detect Targeted Therapy Response in Patients with Liver Metastases. Proc Intl Soc Mag Reson Med. 2017;25:1115. [Google Scholar]
- 10.Larson PEZ, Hu S, Lustig M, Kerr AB, Nelson SJ, Kurhanewicz J, Pauly JM, Vigneron DB. Fast Dynamic 3D MRSI with Compressed Sensing and Multiband Excitation Pulses for Hyperpolarized 13C Studies. Magn Reson Med. 2011;65:610–619. doi: 10.1016/j.biotechadv.2011.08.021.Secreted. [DOI] [PMC free article] [PubMed] [Google Scholar]
- 11.Reed GD, Larson PEZ, Von Morze C, Bok R, Lustig M, Kerr AB, Pauly JM, Kurhanewicz J, Vigneron DB. A method for simultaneous echo planar imaging of hyperpolarized 13C pyruvate and 13C lactate. J Magn Reson. 2012;217:41–7. doi: 10.1016/j.jmr.2012.02.008. [DOI] [PMC free article] [PubMed] [Google Scholar]
- 12.Jiang W, Lustig M, Larson PEZ. Concentric rings K-space trajectory for hyperpolarized 13C MR spectroscopic imaging. Magn Reson Med. 2016;75:19–31. doi: 10.1002/mrm.25577. [DOI] [PMC free article] [PubMed] [Google Scholar]
- 13.Gordon JW, Niles DJ, Fain SB, Johnson KM. Joint spatial-spectral reconstruction and k-t spirals for accelerated 2D spatial/1D spectral imaging of 13C dynamics. Magn Reson Med. 2014;71:1435–1445. doi: 10.1002/mrm.24796. [DOI] [PMC free article] [PubMed] [Google Scholar]
- 14.Gordon JW, Vigneron DB, Larson PEZ. Development of a Symmetric Echo Planar Imaging Framework for Clinical Translation of Rapid Dynamic Hyperpolarized 13C Imaging. Magn Reson Med. 2016:1–7. doi: 10.1002/mrm.26123. [DOI] [PMC free article] [PubMed] [Google Scholar]
- 15.Chen HY, Larson PEZ, Bok RA, et al. Assessing prostate cancer aggressiveness with hyperpolarized dual-agent 3D dynamic imaging of metabolism and perfusion. Cancer Res. 2017;77:3207–3216. doi: 10.1158/0008-5472.CAN-16-2083. [DOI] [PMC free article] [PubMed] [Google Scholar]
- 16.Shang H, Sukumar S, Morze C Von, et al. Spectrally Selective Three-Dimensional Dynamic Balanced Steady-State Free Precession for Hyperpolarized C-13 Metabolic Imaging With Spectrally Selective Radiofrequency Pulses. Magn Reson Med. 2016 doi: 10.1002/mrm.26480. [DOI] [PMC free article] [PubMed] [Google Scholar]
- 17.Reed GD, von Morze C, Verkman AS, et al. Imaging Renal Urea Handling in Rats at Millimeter Resolution using Hyperpolarized Magnetic Resonance Relaxometry. Tomography. 2016;2:125–137. doi: 10.18383/j.tom2016.00127. [DOI] [PMC free article] [PubMed] [Google Scholar]
- 18.Milshteyn E, Morze C Von, Reed GD, et al. Development of high resolution 3D hyperpolarized carbon-13 MR molecular imaging techniques. Magn Reson Imaging. 2017;38:152–162. doi: 10.1016/j.mri.2017.01.003. [DOI] [PMC free article] [PubMed] [Google Scholar]
- 19.Scheffler K. A pictorial description of steady-states in rapid magnetic resonance imaging. Concepts M Reson. 1999;11:291–304. doi: 10.1002/(SICI)1099-0534(1999)11:5<291∷AID-CMR2>3.0.CO;2-J. [DOI] [Google Scholar]
- 20.Von Morze C, Larson PEZ, Hu S, Keshari K, Wilson DM, Ardenkjaer-Larsen JH, Goga A, Bok R, Kurhanewicz J, Vigneron DB. Imaging of blood flow using hyperpolarized [13C]urea in preclinical cancer models. J Magn Reson Imaging. 2011;33:692–697. doi: 10.1002/jmri.22484. [DOI] [PMC free article] [PubMed] [Google Scholar]
- 21.Von Morze C, Bok RA, Reed GD, Ardenkjaer-Larsen JH, Kurhanewicz J, Vigneron DB. Simultaneous Multiagent Hyperpolarized 13C Perfusion Imaging. Magn Reson Med. 2014;72:1599–1606. doi: 10.1002/mrm.25071. [DOI] [PMC free article] [PubMed] [Google Scholar]
- 22.Hansen ESS, Stewart NJ, Wild JM, Stødkilde-jørgensen H, Laustsen C. Hyperpolarized 13C,15N2-Urea MRI for Assessment of the Urea Gradient in the Porcine Kidney. Magn Reson Med. 2016;76:1895–1899. doi: 10.1002/mrm.26483. [DOI] [PubMed] [Google Scholar]
- 23.Nielsen PM, Hansen ESS, Nørlinger TS, Nørregaard R, Bertelsen LB, Jørgensen HS, Laustsen C. Renal Ischemia and Reperfusion Assessment With Three-Dimensional Hyperpolarized 13C,15N2-Urea. Magn Reson Med. 2016;76:1524–1530. doi: 10.1002/mrm.26377. [DOI] [PubMed] [Google Scholar]
- 24.Geraghty BJ, Lau JYC, Chen AP, Cunningham CH. Accelerated 3D echo-planar imaging with compressed sensing for time-resolved hyperpolarized 13C studies. Magn Reson Med. 2017;77:538–546. doi: 10.1002/mrm.26125. [DOI] [PubMed] [Google Scholar]
- 25.Park I, Gordon J, Nelson S, Talbott J. Developing In Vivo Perfusion Imaging Methods for Spinal Cord Using Hyperpolarized [13C]t-Butanol and [13C, 15N2]Urea. Proc Intl Soc Mag Reson Med. 2016;24:1137. doi: 10.1016/j.rcl.2010.07.019.2. [DOI] [PubMed] [Google Scholar]
- 26.Park JM, Spielman DM, Josan S, Jang T, Merchant M, Hurd RE, Mayer D, Recht LD. Hyperpolarized 13C-lactate to 13C-bicarbonate ratio as a biomarker for monitoring the acute response of anti-vascular endothelial growth factor (anti-VEGF) treatment. NMR Biomed. 2016;29:650–659. doi: 10.1002/nbm.3509. [DOI] [PMC free article] [PubMed] [Google Scholar]
- 27.Wang JX, Merritt ME, Sherry D, Malloy CR. A general chemical shift decomposition method for hyperpolarized 13C metabolite magnetic resonance imaging. Magn Reson Chem. 2016:665–673. doi: 10.1002/mrc.4435. [DOI] [PMC free article] [PubMed] [Google Scholar]
- 28.Leupold J, Månsson S, Stefan Petersson J, Hennig J, Wieben O. Fast multiecho balanced SSFP metabolite mapping of 1H and hyperpolarized 13C compounds. Magn Reson Mater Physics Biol Med. 2009;22:251–256. doi: 10.1007/s10334-009-0169-z. [DOI] [PubMed] [Google Scholar]
- 29.Von Morze C, Reed G, Shin P, Larson PEZ, Hu S, Bok R, Vigneron DB. Multi-band frequency encoding method for metabolic imaging with hyperpolarized [1-13C]pyruvate. J Magn Reson. 2011;211:109–13. doi: 10.1016/j.jmr.2011.04.007. [DOI] [PMC free article] [PubMed] [Google Scholar]
- 30.Varma G, Wang X, Vinogradov E, Bhatt RS, Sukhatme VP, Seth P, Lenkinski RE, Alsop DC, Grant AK. Selective spectroscopic imaging of hyperpolarized pyruvate and its metabolites using a single-echo variable phase advance method in balanced SSFP. Magn Reson Med. 2016;76:1102–1115. doi: 10.1002/mrm.26004. [DOI] [PMC free article] [PubMed] [Google Scholar]
- 31.Perman WH, Bhattacharya P, Leupold J, Lin AP, Harris KC, Norton VA, Hövener JB, Ross BD. Fast volumetric spatial-spectral MR imaging of hyperpolarized 13C-labeled compounds using multiple echo 3D bSSFP. Magn Reson Imaging. 2010;28:459–465. doi: 10.1016/j.mri.2009.12.003. [DOI] [PMC free article] [PubMed] [Google Scholar]
- 32.Von Morze C, Sukumar S, Reed GD, Larson PEZ, Bok RA, Kurhanewicz J, Vigneron DB. Frequency-specific SSFP for hyperpolarized 13C metabolic imaging at 14.1 T. Magn Reson Imaging. 2013;31:163–170. doi: 10.1016/j.mri.2012.06.037. [DOI] [PMC free article] [PubMed] [Google Scholar]
- 33.Månsson S, Petersson JS, Scheffler K. Fast metabolite mapping in the pig heart after injection of hyperpolarized 13C-pyruvate with low-flip angle balanced steady-state free precession imaging. Magn Reson Med. 2012;68:1894–1899. doi: 10.1002/mrm.24183. [DOI] [PubMed] [Google Scholar]
- 34.Hurwitz AA, Foster BA, Allison JP, Greenberg NM, Kwon ED. The TRAMP mouse as a model for prostate cancer. Curr Protoc Immunol. 2001;Chapter 20(Unit 20.5) doi: 10.1002/0471142735.im2005s45. [DOI] [PubMed] [Google Scholar]
- 35.Larson PEZ, Kerr AB, Leon C, Pauly JM, Vigneron DB. A rapid method for direct detection of metabolic conversion and magnetization exchange with application to hyperpolarized substrates. J Magn Reson. 2012;225:71–80. doi: 10.1016/j.jmr.2012.09.014. [DOI] [PMC free article] [PubMed] [Google Scholar]
- 36.Cunningham CH, Chen AP, Albers MJ, Kurhanewicz J, Hurd RE, Yen YF, Pauly JM, Nelson SJ, Vigneron DB. Double spin-echo sequence for rapid spectroscopic imaging of hyperpolarized 13C. J Magn Reson. 2007;187:357–362. doi: 10.1016/j.jmr.2007.05.014. [DOI] [PubMed] [Google Scholar]
- 37.Xing Y, Reed GD, Pauly JM, Kerr AB, Larson PEZ. Optimal variable flip angle schemes for dynamic acquisition of exchanging hyperpolarized substrates. J Magn Reson. 2013;234:75–81. doi: 10.1016/j.jmr.2013.06.003. [DOI] [PMC free article] [PubMed] [Google Scholar]
- 38.Maidens J, Member S, Gordon JW, Arcak M, Larson PEZ. Optimizing flip angles for metabolic rate estimation in hyperpolarized carbon-13 MRI. IEEE T Med Imaging. 2016;62:1–10. doi: 10.1109/TMI.2016.2574240. [DOI] [PMC free article] [PubMed] [Google Scholar]
- 39.Milshteyn E, Morze C Von, Galen D, Shang H, Shin PJ, Larson PEZ, Vigneron DB. Using a Low Rank plus Sparse Reconstruction Approach to Accelerate 3D Dynamic bSSFP Hyperpolarized Carbon-13 MR Imaging. Proc Intl Soc Mag Reson Med. 2015;24:2329. [Google Scholar]
- 40.Crane JC, Olson MP, Nelson SJ. SIVIC : Open-Source, Standards-Based Software for DICOM MR Spectroscopy Workflows. Int J Biomed Imaging. 2013;2013 doi: 10.1155/2013/169526. [DOI] [PMC free article] [PubMed] [Google Scholar]
- 41.Rosset A, Spadola L, Ratib O. OsiriX: An open-source software for navigating in multidimensional DICOM images. J Digit Imaging. 2004;17:205–216. doi: 10.1007/s10278-004-1014-6. [DOI] [PMC free article] [PubMed] [Google Scholar]
- 42.Svensson J, Månsson S, Johansson E, Petersson JS, Olsson LE. Hyperpolarized 13C MR angiography using trueFISP. Magn Reson Med. 2003;50:256–262. doi: 10.1002/mrm.10530. [DOI] [PubMed] [Google Scholar]
- 43.Hurd RE, Spielman D, Josan S, Yen Y, Pfefferbaum A, Mayer D. Exchange-Linked Dissolution Agents in Dissolution-DNP 13C Metabolic Imaging. Magn Reson Med. 2013;70:936–942. doi: 10.1002/mrm.24544. [DOI] [PMC free article] [PubMed] [Google Scholar]
- 44.Hill DK, Orton MR, Mariotti E, et al. Model Free Approach to Kinetic Analysis of Real-Time Hyperpolarized 13C Magnetic Resonance Spectroscopy Data. PLoS One. 2013;8:e71996. doi: 10.3978/j.issn.2223-4292.2014.02.02. [DOI] [PMC free article] [PubMed] [Google Scholar]
- 45.Bahrami N, Swisher CL, Von Morze C, Vigneron DB, Larson PEZ. Kinetic and perfusion modeling of hyperpolarized 13C pyruvate and urea in cancer with arbitrary RF flip angles. Quant Imaging Med Surg. 2014;4:24–32. doi: 10.3978/j.issn.2223-4292.2014.02.02. [DOI] [PMC free article] [PubMed] [Google Scholar]
- 46.Shang H, Larson PEZ, Kerr A, et al. Multiband RF pulses with improved performance via convex optimization. J Magn Reson. 2016;262:81–90. doi: 10.1016/j.jmr.2015.11.010. [DOI] [PMC free article] [PubMed] [Google Scholar]
- 47.Le Roux P. Simplified model and stabilization of SSFP sequences. J Magn Reson. 2003;163:23–37. doi: 10.1016/S1090-7807(03)00115-0. [DOI] [PubMed] [Google Scholar]