

Abstract
The mammalian dorsal root ganglia (DRG) are located on the dorsal roots of the spinal nerves and contain cell bodies of primary sensory neurons. DRG cells have been classified into subpopulations based on their size, morphology, intracellular markers, response to stimuli, and neuropeptides. To understand the connections between DRG chemical heterogeneity and cellular function, we performed optically guided, high-throughput single cell profiling using sequential matrix-assisted laser desorption/ionization mass spectrometry (MS) to detect lipids, peptides, and several proteins in individual DRG cells. Statistical analysis of the resulting mass spectra allows stratification of the DRG population according to cellular morphology and, presumably, major cell types. A subpopulation of small cells contained myelin proteins, which are abundant in Schwann cells, and mass spectra of several larger cells contained peaks matching neurofilament, vimentin, myelin basic protein S, and thymosin beta proteins. Of the over 1,000 cells analyzed, approximately 78% produced putative peptide-rich spectra, allowing the population to be classified into three distinct cell types. Two signals with m/z 4404 and 5487 were exclusively observed in a cell type, but could not be matched to results of our previous LC-MS analyses.
Keywords: dorsal root ganglia, mass spectrometry, neurochemistry, peptides, single cell analysis
Graphical abstract
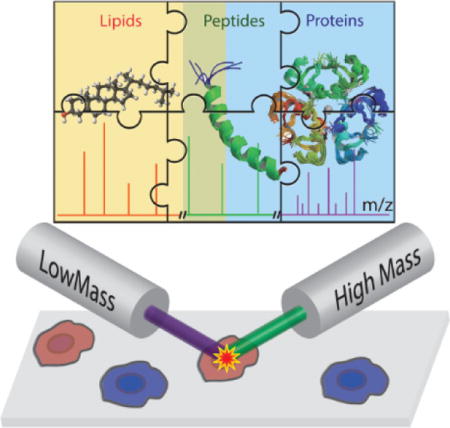
Puzzle of Life: Chemical heterogeneity in more than 1,000 individual rat dorsal root ganglion cells is revealed by sequential matrix-assisted laser desorption/ionization mass spectrometry analyses. Morphologically similar cells yield distinct mass spectral profiles, and so are categorized into distinct cell types, with implications on cell function. An uncommon group of cells containing previously undetected peptides was characterized.
1. Introduction
Dorsal root ganglia (DRG) consist of neuronal cell bodies, myelinated and non-myelinated axons (here termed neurites), cells related to vasculature and blood, immune cells, as well as several types of glia, including satellite cells. DRG are vital for conveying sensory information from the periphery to the spinal cord and brain stem as part of the peripheral sensory-motor system in mammals.[1, 2] Because DRG integrate and discriminate diverse types of sensory inputs, such as proprioception and nociception, efforts to identify and characterize the cell types dedicated to relaying specific kinds of sensory information are critical for understanding fundamental mechanisms of the sensory-motor system. In general, DRG cell populations can be stratified by their anatomy, morphology, and electrophysiology, and also via a range of intracellular markers, from patterns of gene expression to proteome, peptidome, lipidome, and metabolome heterogeneity. In 1978, Fields et al.[3] utilized cell surface markers to classify DRG cellular populations into four cell types: neurons, Schwann cells, fibroblasts, and unidentified flat cells. McMahon and Priestley[1, 4] divided DRG cells into a minimum of three major subclasses based on size and neurochemical content, consisting of small cells (predominantly nociceptors,[2] 10–30 μm) having unmyelinated axons that either (a) express calcitonin gene-related peptide (CGRP) or (b) bind to the lectin Griffonia simplicifolia IB4, and (c) larger cells (25–60 μm in diameter) having high levels of neurofilaments and myelinated axons. The three populations overlap (as some cells belong to multiple groups), suggesting the presence of additional cellular subpopulations. Recently, multiple research groups have revealed more details about the molecular and functional diversity of DRG neurons with the application of single cell transcriptomics/RNA sequencing.[5–7] Notably, Usoskin et al.[7] performed single cell transcriptomics to identify 11 cell types in DRG, two of which were peptidergic. Our MS imaging study of DRG chemical profiles highlighted striking chemical complexity, including the presence of distinct morphologically defined spatio-chemical regions,[8] although at the level of tissue sections. Here, we report label-free, multiplexed detection of endogenous lipids, peptides, and small proteins in populations of individual rat DRG cells.
Single cell metabolomics and peptidomics aim to recognize the similarities and distinctions between individual cells by linking their chemical dynamic profiles to cellular fate, function, homeostatic balance, and other biological phenomena.[9–12] Among the bioanalytical techniques used in single cell metabolomic and peptidomic investigations, mass spectrometry (MS) is at the forefront, owing to its high analyte coverage, low limits of detection (LOD), versatile analyte sampling methods, and unique ability to be coupled with in situ or off-line orthogonal characterizations.[9, 11–20] MS imaging (MSI) focuses on direct analysis of tissue sections to determine the relative abundance and spatial distribution of analytes in tissue sections.[11, 21–25] In addition, multimodal MSI approaches have facilitated detection of diverse analyte classes from the same samples by utilizing different matrices and sequential tissue imaging.[26] Single cell chemical imaging remains relatively specialized due to the limited number of MS technologies capable of routinely providing micron resolution;[25, 27–33] discriminating a typical mammalian cell within an intact tissue slice requires the footprint of the MS probe to be less than 3 μm.[32] To circumvent the challenges of cellular and sub-cellular imaging, several MS-based approaches have been developed. Low density populations of individual cells produced by enzymatic dissociation of different tissues can be deposited on a substrate and processed for MS analysis, significantly reducing cell-to-cell cross contamination, even when using microprobes exceeding cell sizes, albeit at the expense of native tissue context. Populations of individual cells are suitable for subsequent high-throughput MS analysis enabled by fabricated microwell devices[34, 35] and optical imaging.[20, 36–39] Recently, we demonstrated a unique optically guided single cell MS approach to profile hundreds to thousands of cells from different tissues and organs in a single experiment using both secondary ion MS (SIMS)[38] and matrix-assisted laser desorption/ionization (MALDI) MS.[37, 39, 40]
In the current work, we performed mass spectral classification of cell types from sequential MALDI MS analyses of the same cells, revealing heterogeneity in peptides and small proteins. The majority of the detected peptides were tentatively identified in a prior peptidomic study using liquid chromatography (LC) coupled with electrospray ionization (ESI) Fourier transform-ion cyclotron resonance (FT-ICR) MS and tandem MS (MS/MS), in combination with direct tissue analysis using MALDI-TOF MS.[41] Previously unreported signals that appear to be peptides were detected from a rare cell type.
2. Results and Discussion
2.1 Optically Guided Single Cell MALDI MS of DRG Cell Populations for High-Throughput Profiling of Lipids and Peptides
Single cells from enzymatically dissociated DRG from three animals were prepared following an established protocol.[37–40] The dissociated cells were placed onto four indium tin oxide (ITO)-coated conductive glass substrates in three separated regions marked for samples from individual animals (see Figure 1). Additional details can be found in the Experimental section. Each cell was sequentially interrogated twice with a Bruker ultrafleXtreme MALDI-TOF/TOF mass spectrometer. The first set of measurements utilized a 100-μm laser spot size and MS acquisition in reflectron mode optimized for the m/z 400–6,000 mass range, referred to as low molecular (LM) mass analysis. These settings were used previously for single cell profiling of rat pituitary[37] and islets of Langerhans.[39, 40] Next, the same cells were individually re-analyzed with a 50-μm laser spot size with MS acquisition in linear detection mode, optimized for higher molecular weight molecules (m/z 4,000–20,000), and referred to as high molecular (HM) mass analysis. The smaller beam size used for the HM analysis provides a higher laser fluence (at the same laser power and setting), which is necessary for desorbing and ionizing cellular analytes. To ensure that the same target spots/cells were assayed by both LM and HM analyses, the sample slide was not removed until both analyses were finished.
Figure 1.
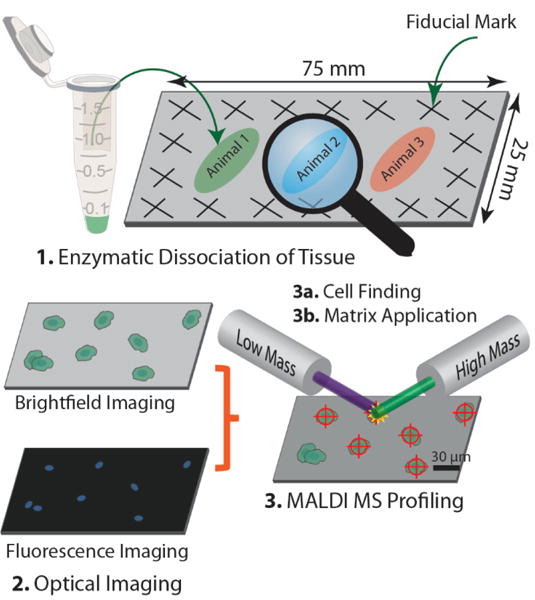
Optically guided high-throughput single cell MS profiling of rat DRG cells. Intact DRG were enzymatically dissociated and stained with a fluorescent nuclear dye. Isolated cells on ITO-coated glass substrates are located with brightfield and fluorescence imaging and targeted for MS analysis.
Figure 2 shows representative mass spectra of single DRG cells randomly selected from the LM analysis, all of which contain peaks corresponding to lipid monomers, dimers, and occasionally, peaks of lipid trimers and some peptides. The average lipid profile of DRG cells obtained from MALDI MS is shown in Figure 2E, which includes predominantly phosphatidylcholines (PCs). The same class of lipids was also primarily observed in a single cell SIMS profiling study using an ionic liquid matrix.[38] We acknowledge that several matrices and nanoparticles have been designed to improve the detection of low-abundance lipid classes.[42] However, since our goal was to detect lipids, peptides, and small proteins in the same cells, we used 2,5-dihydroxybenzoic acid (DHB) as the matrix. The signals with the most abundant intensities correspond to PC(34:1) at m/z 760.6, followed by PC(32:0) at m/z 734.6, and PC(36:1) at m/z 788.6. Similarly, lipid dimer peaks of homo- and heterodimers of PC(34:1) are among the most intense for the m/z 1200–1600 region, identified by accurate molecular masses and MS/MS data (see Supporting Information Figures S1 and S2). The MS/MS data were obtained by randomly ablating a sample surface region containing many cells or cell clusters. Of note, the signal intensity of the heterodimer of PC(36:1) with PC(34:1) is more abundant than that of the heterodimer of PC(32:0) with PC(34:1), although their monomer signal intensities have the opposite intensity relation. Many cells also show mass spectral peaks above m/z 2,000, as discussed below.
Figure 2.
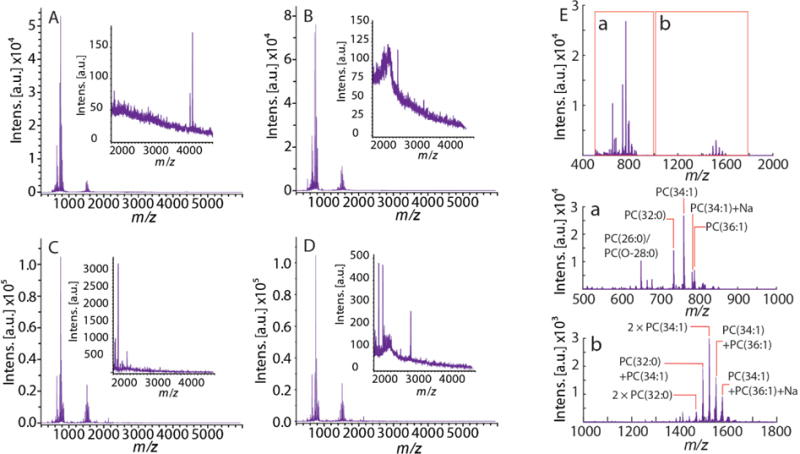
(A–D) Representative mass spectra in the LM range (m/z 400–6000) acquired from single DRG cells. Each inset highlights the m/z range above 2,000. (E) Average lipid profile of DRG cells; (a) lipid monomers and (b) lipid dimers.
2.2 MALDI MS Single Cell Profiling and FT-ICR MS on DRG Analyte Extracts Detects Peptides that Reflect DRG Cell Heterogeneity
The single cell mass spectra obtained from our LM analysis were subjected to principal component analysis (PCA), as shown in Figure 3. The score plot (Figure 3A) shows overlap of data points acquired from cells isolated from different animals, demonstrating low batch-to-batch variation. PC1 primarily separated cells based on differences in the intensity of lipid signals (68.8% of variation explained; see Supporting Information Figure S3), partially reflecting methodological variation in cell targeting accuracy and cell morphology. The PC2 loading plot (Figure 3B) is populated with a series of mass spectral peaks tentatively assigned to peptides, but not lipids, based on their mass range and isotopic distribution. We note that heterogeneity in matrix application and the overall weak intensities of these peaks lowers the precision of m/z measurements.
Figure 3.
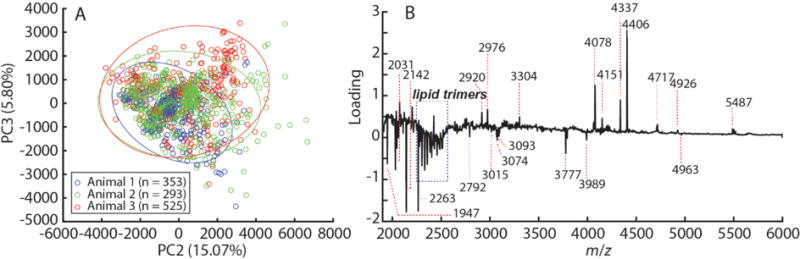
PCA of MS data acquired from populations of single DRG cells. (A) Score plot of data obtained from the LM analysis with 95% confidence ellipses. (B) PC2 loading plot of the m/z >2,000 region showing mass spectral peaks that vary the most in the analyzed data set according to PC2, including numerous peptides. “n” indicates the number of cells examined in each animal.
As such, some of the m/z values derived from the average profile (Figure 3B), especially those at high masses, correspond to the average molecular masses rather than monoisotopic masses. For example, the mass spectral peak at m/z 4406 in Figure 3B has a monoisotopic mass of 4404, as shown in Supporting Information Figure S4. However, there is no signal with m/z 4404 detected in our prior LC-MS peptidomics work on tissue extracts and releasates.[41] Il’ina et al.[43] identified a group of peptides in Wistar rat brain extract, referred to as membrane-tropic homeostatic tissue-specific bioregulators, including a peptide at m/z 4403; unfortunately, the primary sequence of the peptide was not reported, and so this remains unknown. High-mass resolution MALDI MS measurements of the extracts were performed using a Bruker SolariX FT-ICR mass spectrometer. Our results are summarized in Table 1, where the observed molecular masses are matched to the list of peptides from our previous report.[41]
Table 1.
FT-ICR MS measurements of DRG tissue extracts. Peptide identity assignments are based on mass matching with the previous peptidomic characterizations using LC-MS.[41]
| Peptide | Primary sequence | Observed m/z |
Exact m/z | Mass error (ppm) |
|---|---|---|---|---|
| Neurofilament light polypeptide | Y.TSHVQEEQSEVEETIEATK.A | 2174.007 | 2174.0095 | −1.15 |
| Neurofilament medium polypeptide | M.S(+42.01)YTLDSLGNPSAYRRVTETR.S | 2328.162 | 2328.1573 | 2.02 |
| Neurofilament light polypeptide | Y.YTSHVQEEQSEVEETIEATK.A | 2337.079 | 2337.0729 | 2.61 |
| Neurofilament light polypeptide | – | 2359.232a | – | – |
| Neurofilament light polypeptide | Y.TSHVQEEQSEVEETIEATKAEEAK.D | 2702.254 | 2702.2639 | −3.66 |
| Vimentin | L.LIKTVETRDGQVINETSQHHDDLE | 2777.365 | 2777.3700 | −1.80 |
| Neurofilament light polypeptide | Y.YTSHVQEEQSEVEETIEATKAEEAK.D | 2865.317 | 2865.3272 | −3.56 |
| Thymosin beta-10 | M.A(+42.01)DKPDMGELASFDKAKLKKTETQEKN.T | 2964.491 | 2964.4977 | 2.26 |
| Neurofilament medium polypeptide | K.VEAPKLKVQHKFVEEIIEETKVEDEK.S | 3094.656 | 3094.6671 | −3.59 |
| Gamma-synuclein | G.VVRKEDLEPPAQDQEAKEQEE GEEAKSGGD | 3297.528 | 3297.5353 | −2.21 |
| Unidentified | – | 4131.338 | – | – |
| Unidentified | – | 4470.472 | – | – |
| Unidentified | – | 4404.672 | – | – |
| Unidentified | – | 4745.614 | – | – |
| Thymosin beta-4 | M.S(+42.01)DKPDMAEIEKFDKSK LKKTETQEKNPLPSKETIEQEKQAGES | 4961.453 | 4961.4930 | −8.06b |
The “period” in the peptide sequences indicates the cleavage site; residues before and after it are not considered part of the primary sequence used to compute the m/z value. “+42” indicates acetylation. The bolded m/z values were also detected in the single cell profiling experiment.
Signal observed in the prior LC-MS study, but the primary sequence of related compound was not determined.
A high ppm value suggests less confidence in the peptide match.
The FT-ICR MS results indicate that the isotopically resolved ion at m/z 4404.672 corresponds to the averaged peak at m/z 4406 in the TOF MS measurements. The intensity of m/z 4404.672 from the DRG extract was weak, preventing direct MS/MS sequencing. Accurate FT-ICR MS data from this work, along with published information,[41] was used to support the identification of several other peptides observed in our single cell profiling experiments, including vimentin, thymosin beta isoforms, and neurofilaments, in which the peptides from the two latter classes of proteins were also detected in single cell measurements. Peptides derived from gamma-synuclein were also detected in the extracts, but were absent from the single cell data. Other mass spectral peaks detected in the single cell experiments were mass matched to the list of peptides detected in the prior LC-MS study[41] (see Supporting Information Table S1). Many of the peaks observed here are consistent with signals of peptides derived from myelin protein P0 (m/z 1947, 2263, and 3989) and myelin basic protein S (m/z 4337). Myelin basic protein, the second most abundant protein in the central nervous system, is encoded in a large complex of oligodendrocyte lineage genes.[44] Previous studies have shown that myelin proteins are found predominantly in myelinating glial and immune cells. Several functions are attributed to myelin proteins, including maintaining the adhesion of the cytosolic surface of multilayered compact myelin, and interacting with polyanionic proteins such as actin, tubulin, Ca2+-calmodulin, etc.[44, 45] Adult Schwann cells, on the other hand, express negligible levels of myelin glycoprotein P0.[46] Vimentin is another protein that has been found to be abundant in satellite glial cells,[47–49] and in neurons at the early stage of development and following injury.[50–52] Other peptides (m/z 2141, 2920, 3015, and 3093; see Table S1) are likely derived from neurofilament polypeptides found in DRG neurons.[53] Neurofilaments are involved in axonogenesis and neurite extension.[51, 52, 54] Approximately 40% of the rat lumbar DRG neurons are characterized by a high content of phosphorylated heavy-chain neurofilaments.[1, 53, 54]
Dividing the cell population based on the PC2 score allows coarse classification of the cellular population. The mass spectra of cells found on the negative side of PC2 primarily contained peptide peaks in the m/z 2,000–3,000 region, without peaks at higher masses. These species, tentatively assigned to myelin and neurofilament proteins, were often detected together with signals from lipid trimers. One notable peak is m/z 2263, which falls within the lipid trimer mass range (~m/z 2,200–2,500). MS/MS was performed on m/z 2263 to deconvolve the possible contributions of lipid trimers having similar masses (±1 Da). The LIFT-TOF/TOF product-ion mass spectrum of m/z 2263 (±5 Da precursor mass selection window) obtained by random continuous acquisition of data from many cells and cell clusters yielded intense peaks corresponding to lipids (see Supporting Information Figure S5). The fragments are consistent with the precursor ions being a sodiated lipid trimer composed of a PC(34:1) dimer and another lipid with m/z 723.6 (neutral loss to produce a PC(34:1) dimer), for a theoretical m/z of 2264.72. Since it is not possible to isolate m/z 2263.27 (tentatively, a myelin protein P0 fragment) from m/z 2264.72 (a lipid) with the TOF/TOF instrument used here, we cannot assign identity of m/z 2263 signal solely to a peptide fragment. However, the presence of several cells with intense peaks at m/z 2263 in the absence of any other lipid trimers suggests that another component is detectible and is unlikely to be a lipid trimer.
Cells with positive PC2 scores predominantly contained higher mass peaks assigned to peptides derived from thymosin beta-4 (m/z 4716) and myelin basic protein S (m/z 4337). Previous immunohistochemical work showed that thymosin beta-4 is located in both the cell bodies and axons of neurons.[55] As mentioned above, peaks at m/z 4404 and 5487 did not match any entry in the peptide database generated by our prior LC-MS analysis of tissue extracts.[41] Overall, the PC2 loading plot and direct survey of individual mass spectra indicate the presence of heterogeneity in the cellular peptide content, including molecules related to myelin proteins (P0 and basic protein S), neurofilaments, thymosin beta-4, and the uncharacterized peptides at m/z 4404 and m/z 5487.
An alternative explanation for the observed heterogeneity is that the differences in peptide content are due to experimental artifacts; i.e., the sensitivity of detection of high mass peptides is disproportionately affected by spatial cell targeting accuracy, MALDI matrix deposition and crystallization, cell size and/or instrument parameters/performance. To investigate this possibility, we examined individual DRG mass spectra and microscopy images to determine how the MS data correlate with morphological differences (Figure 4). The four examined cells were from the same sample slide, and assayed in the same batch using identical instrument settings. In this case, similar targeting accuracy was achieved.[39, 56] Despite the similarity of the methodological parameters, all four cells displayed mass spectral heterogeneity. Furthermore, cells with mass spectra containing the same major peaks as those shown in Figure 4 were reproducibly found in data sets across animals and batches (Supporting Information Figure S6). These spectra indicate that the observed qualitative differences reflect biological phenotypes rather than analytical uncertainties. Focusing on the representative cells, cell A (Figure 4A and 4E-row 1) is non-circular with a diameter of 15 μm. Its mass spectrum shows intense lipid signals without any peaks above m/z 2,000, except m/z 2264 (myelin protein P0 or a lipid trimer). The size and mostly undetectable peptide content of cell A makes it a candidate for identification as a supporting cell, such as a glia. Cell B (Figure 4B and 4E-row 2) appears to have a nucleus that comprises most of its volume. Interestingly, the mass spectrum from cell B displays intense lipid signals, along with at least four major peaks at m/z 2031, 3777, 3989, and 4963 (Supporting Information Figure S7). As discussed above, the peaks are tentatively assigned to vimentin, transitional endoplasmic reticulum ATPase (TER ATPase), myelin protein P0, and thymosin beta-4, respectively. Cells C and D display larger overall sizes with more distinct membrane boundaries, as seen in their brightfield images (Figure 4E, rows 3 and 4). The morphology of cell C is non-circular with two localized sites exhibiting intense Hoechst fluorescence. These images suggest either that cell C maintained a connection with a supporting cell (marked with a red circle), or that it was mechanically damaged during deposition and part of the nucleus detached from its cell body, evidenced by the faint nuclear stain in the cell body. Cell D is also large and presents diffuse nuclear fluorescence, which we observed regularly with other types of large cells. Both of the latter cells produced mass spectra containing the same major peaks at m/z 4337 and 4404 (Figure 4C, D), suggesting that these tentative peptides are primarily found in large DRG cells. Furthermore, due to the presence of neurofilament-related signals, it is likely that cells C and D are DRG neurons. In addition, cells C and D are 9.7 mm apart on the slide, eliminating the possibility that the detection of peptide signals, especially m/z 4337 and 4404, is biased by cell location on the slide.
Figure 4.
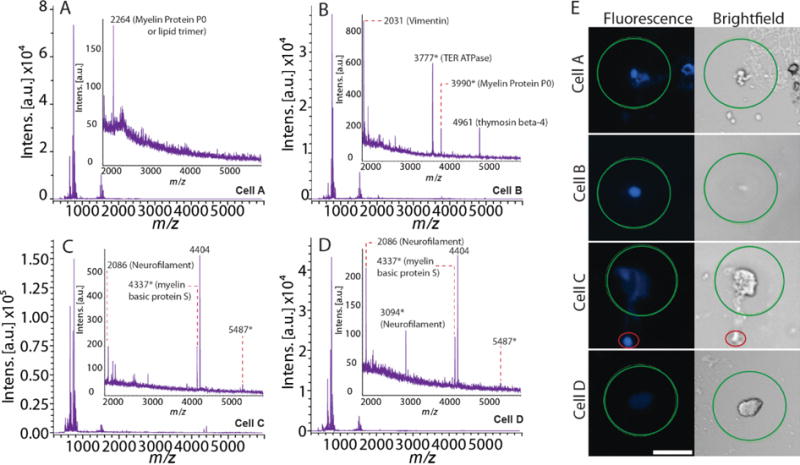
Examples of the biochemical and morphological variability of DRG cells. (A–D) Mass spectra of four different DRG cells; (E) the corresponding cell fluorescence and brightfield images collected from the same animal. The scale bar for all images is 50 μm. The green circle approximates the LM analysis laser footprint (~100 μm). The red circle in the cell C image annotates the nucleus-like structure, as discussed in the main text. Mass spectral peaks are labeled with m/z values, where the asterisk indicates the average molecular mass.
Cells mechanically damaged during sample preparation should have limited effect on the analysis of cellular peptide content. Our work and that of others have demonstrated that treatment with MALDI matrix yields similar results to sample fixation.[57, 58] Cells that rupture would lose much of their peptide content; hence these cells would lack peptide peaks and be excluded from further analysis. Additionally, restricting analysis to cells sufficiently separated from each other ensures that cell-to-cell contamination does not occur. Accordingly, we conclude that the diverse morphology observed between cells is not an indication of disturbance caused by sample treatment.
2.3 Sequential MALDI MS Profiling Improves Analyte Coverage and Detection of High Molecular Mass Species and Reveals Peptide Heterogeneity in Morphologically Similar Cells
As expected, cell morphology does not predict peptide content; cells with morphologies similar to cell D (Figure 4) did not necessarily contain a detectable amount of peptide at m/z 4404. Figure 5A–F presents mass spectra of three cells (cells E, F and G) with similar morphologies (roughly circular with a diameter of ~25 μm) to cell D (Figure 4). Cells E and F have a similar LM peptide content as cells C and D in Figure 4, with the pair of mass spectral peaks at m/z 4337 and m/z 4404, but very minor peaks within the m/z 2,000–3,000 range. On the other hand, cell G, while having a similar morphology, exhibits a chemical profile populated with intense signals of m/z 2142, 2264, and 3094, but no signals at higher masses. This cell’s peptide content is different from the four cells shown in Figure 4, except for m/z 2264, which is common with cell A. Since m/z 2142 and 3094 are tentatively assigned to peptides from neurofilament heavy and medium proteins, respectively, cells G and H in Figure 5 represent a population of neurofilament-rich cells. As mentioned above, neurofilaments play a major role in the developmental regulation of neuronal types in rat DRG.[59]
Figure 5.
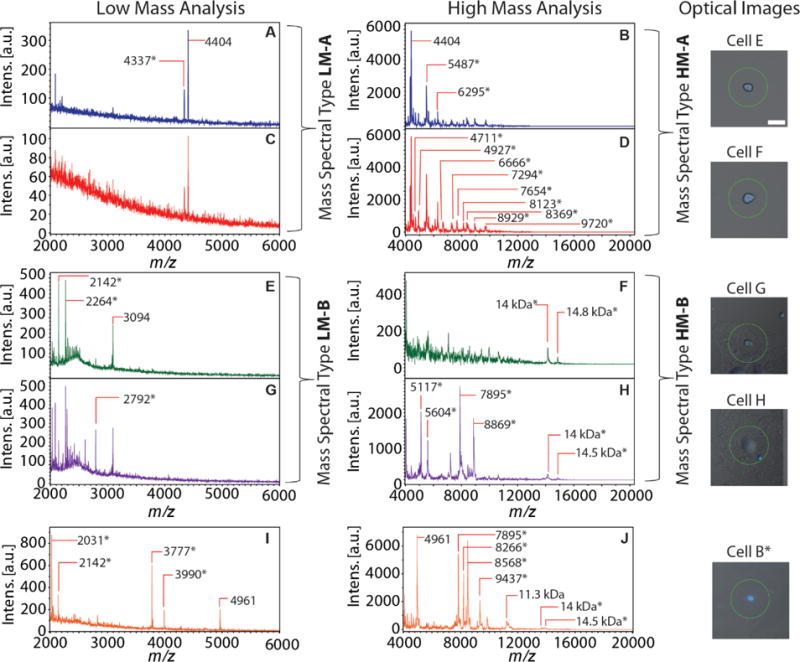
Examples of the biochemical and morphological variability of DRG cells analyzed with sequential (LM followed by HM) MALDI MS profiling. (A–J) Representative mass spectra obtained from sequential MALDI MS profiling of DRG cells. The combined fluorescence and brightfield images of the cells are shown in the right panels. The scale bar is 50 μm. Two MALDI MS (low mass and high mass) analyses were performed on the same cell, corresponding mass spectra shown in the same row and color. Major mass spectral peaks are annotated with m/z values. The last cell (shown in orange, panels I, J), which is cell B from Figure 4, is morphologically and biochemically distinct from the other cells.
We note that a major drawback of LM analysis lies in the low intensities of the mass spectral peaks within the m/z 4,000–6,000 mass range. To circumvent this issue, we performed HM analysis with a method optimized for the m/z 4,000–20,000 mass range at the expense of mass resolution. Following LM analysis, the same cells were subjected to HM analysis to cover the analyte range from m/z 4,000–20,000. The relative signal intensities of peptide peaks in the overlapping region between LM and HM analysis (i.e., m/z 4,000–6,000) increased by at least an order of magnitude. For example, m/z 5487 is barely observed in cells C and D (Figure 4) and is apparently absent in cells E and F (Figure 5) after LM analysis. When the same cells were examined with HM analysis, the mass spectra showed intense signals of m/z 5487 and large signal enhancements for m/z 4337 and 4404. As shown in the right panels of Figure 5, the HM analysis reveals additional heterogeneity between cells E, F and cells G, H, including several smaller peptide signals in Figure 5B, D and polypeptides/small proteins in Figure 5F, H. The apparent peptide and protein content heterogeneity may reflect the existence of multiple DRG cell types, even for those with similar morphologies. Overall, these observations highlight the utility of sequential analyses on the same cells and specifically suggest that the DRG population may be stratified by peptides found exclusively in specific cellular groups. Nevertheless, a thorough, quantitative analysis is necessary to identify these peptide markers, as discussed below.
2.4 Classification of DRG Cells Based on Direct MALDI MS Peptide Profiling
The spectra of the representative cells shown above suggest a cellular classification scheme according to the intensities of selected mass spectral peaks. Visual examination of the mass spectral features shown in Figure 5 suggests that based on peptide content there are at least two DRG subpopulations present. Based on the PC2 loading plot (Figure 3 for LM and Figure S8 for HM), m/z values with high loadings were selected as potential peptide markers as they represent the highest source of variance in the dataset. The pairwise linear correlation coefficients, ρ, were calculated between each putative biomarker for all cell, with p < 0.05 indicating statistical significance. The correlation matrix was plotted where blue and red represent positive and negative correlations, respectively, that are statistically significant. An ideal set of biomarkers would show high, positive correlations with all members of the set and large, negative correlations with all ions outside the set. The potential peptide markers were sorted with hierarchical clustering analysis (HCA), revealing roughly three populations of cells termed A-, B-, and C-type, defined by 19 markers (Figure 6A).
Figure 6.
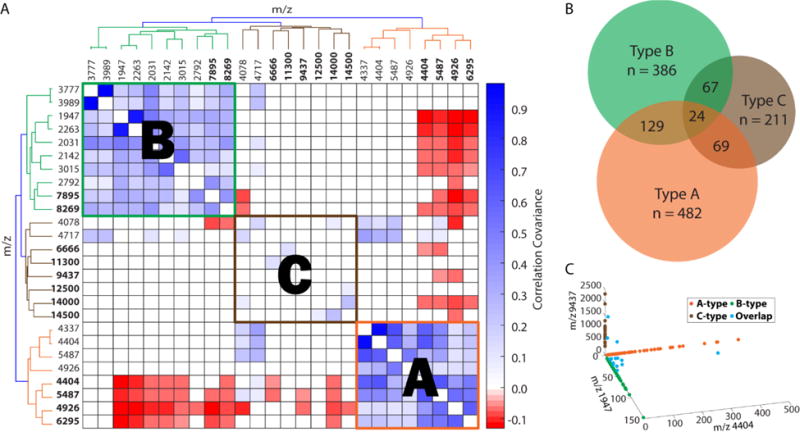
Classification of DRG cells in MALDI MS data sets. (A) Heatmap represents covariance of intensities for m/z values selected from PC2 and sorted via HCA. HM peptide markers are bold. (B) Venn diagram representing results of HCA of acquired mass spectra shows three primary cellular populations, A-type (n = 482), B-type (n = 386), and C-type (n = 211). The size of each set is drawn proportionally to reflect its total number of cells. “n” indicates the total number of cells in each population. (C) Peptide markers are selected for cellular subgroups of A-type (LM m/z 4404), B-type (LM m/z 1947), and C-type (HM m/z 9437), and shared cells (Overlap).
The peptide markers for type A include m/z 4337, 4404, 5487, and 4926 in both LM and HM, and m/z 6295 in HM. For type B, the peptide markers are m/z 1947, 2031, 2142, 2263, 2792, and 3015 in LM, and m/z 7985 and 8269 in HM. For type C, the peptide markers are all in HM: m/z 6666 and 9437, and the tentative proteins at 11.3, 12.5, 14 and 14.5 kDa (see Supporting Information Figure S9 for representative mass spectra of type C cells). Some ions chosen by PCA were excluded due to their positive correlation with markers from other cell types, including m/z 3777 and 3989, which were excluded from type B due to positive correlation with markers in type C, and m/z 4078 and 4717 in type C as they show some significant overlap with markers in type A (Figure 6A).
With the set of ions selected, each cell was tested for membership in the respective group. A cell was considered a member of a given type if the cell contained any peptide markers with a signal-to-noise ratio (S/N) >3. Overall, the peptide markers from three groups successfully classified 919 cells (78% of the total cells analyzed from three animals) into three populations: 498 cells in type A, 386 cells in type B, and 211 cells in type C. Additionally, 129 cells contained both markers of types A and B, 69 cells contained both markers of types A and C, and 67 cells contained both markers of types B and C (Figure 6B). Finally, 24 cells contained peptide markers of all three cell types. With this classification approach, cells sorted into a group may express a single marker, or multiple markers from both LM and HM analyses.
Additional insights are provided by comparing the cellular classifications utilizing markers of LM and HM analyses separately; 89% of the LM-A cells (133 out of 149 cells stratified by LM-A markers) exhibit the markers characteristic for HM-A cells (Figure S10). Since the type A classification is based on the same ions appearing in both LM and HM (e.g., m/z 4404), the significant overlap between LM-A and HM-A is consistent with positive correlation among the markers. The small disparity highlights the difference in optimization between the methods. Other reasons for the disparity may include matrix depletion after LM analysis, leading to inadequate HM signal from some cells, or a decrease in ion suppression (due to lipid removal) after LM analysis, improving analyte detection in HM analysis of other cells. These reasons hold true for all cell types, not just type A. Nonetheless, most cells in LM-A are also in HM-A and vice versa, which indicates a fairly robust repeatability of measurements between these analyses. Since the two analyses were performed sequentially, without removing the samples from the mass spectrometer, this difference is not due to spatial target accuracy.
The type B classification shows a larger disparity between HM and LM analyses, where LM and HM markers do not share common peptides. Only 41% of cells (130 out of 315) in LM-B are also in HM-B. The leaner overlap between the two classes indicates that type B is more heterogeneous.
The type C classification was missed in the original assessment using only mass spectral types (Figure 5). As mentioned above, the two biomarkers of LM-C, m/z 4078 and 4717, have a poor S/N in LM and positively correlate with markers of A-type (Figure 6A). The HM biomarkers, especially m/z 9437, are more prominent and HM analysis also shows enhanced signals of m/z 4078 and 4717 (see Supporting Information Figure S11). As a result, LM-C markers were unable to classify cells as C-type, whereas HM-C markers helped categorize 211 cells.
Taken together, the three cell types account for 78% of the cells analyzed (919 of 1171 cells from three animals). Cells containing none of the peptide markers are typified by a lack of any peptide signal. Presumably the peptide content of the unclassified cells is below the LOD of our instrument. Figure 6C shows a 3D scatter plot of the signal intensities of three distinct peptide markers (m/z 4404 for A-type, m/z 1947 for B-type, and m/z 9437 for C-type), showing good separation between classes for these m/z values.
The peptides or small proteins detected in the HM analysis were not characterized due to the limitations of the TOF/TOF MS/MS instrument at that mass range. Our prior LC-MS study[41] focused on smaller peptides, so sequencing would require additional peptidomic measurements optimized for higher molecular mass species. As a discovery research outcome, the mass spectral types are largely distinct and HCA on the marker correlation matrix demonstrates one method for identifying cellular biomarkers using just single cell MS data sets.
The data shown in Figures 5 and 6 also demonstrate that although MALDI MS consumes analytes, our results show that the remaining single cell material, including the associated amount of MALDI matrix, is sufficient to perform sequential analysis of the same cells. In previous studies on rat cerebellar cells, we demonstrated that MALDI MS measurements can be performed to gain additional chemical information after the cells are analyzed with SIMS.[56] We have also off-line hyphenated MALDI MS with CE-MS via a liquid microjunction surface sampling probe to measure amino acids and dopamine in peptide-profiled individual rodent pancreatic islet α and β cells.[39] The present study illustrates the first example of sequential MALDI MS analysis for improved analyte coverage from lipids to peptides and small proteins at the single cell level.
Several peptides previously reported to be localized within the DRG were not detected, including CGRP, which is expressed in over half of small DRG neurons, along with neuropeptides such as substance P, somatostatin, vasoactive intestinal polypeptide, and galanin.[1, 4] Their absence in our measurements could be caused by analyte stability issues (proteolysis), ion suppression during analyte ionization and detection, analyte loss due to sample rinse, or analytes being present at levels below our LODs. Another possibility is that the fully processed peptides are mostly localized to cell processes that were not targeted in our experiments as we analyzed somata. Moreover, the choice of MALDI matrices may play a key role. For example, we note that substance P is not detected using the DHB dried droplet approach over a range of concentrations from 100 pM to 1 fM. However, when using triple-layer α-cyano-4-hydroxycinnamic acid (CHCA) matrix/sample preparation, we detect substance P over this concentration range (see Supporting Information Figure S12). Nevertheless, variation in matrix layers remains challenging for applications on biological samples, and thus, requires further optimization. Regardless, the detected compounds allow cell type classification. Our work extends the analyte coverage for chemical profiling into the range of small proteins at the level of individual mammalian cells.
Summary and Conclusions
The heterogeneity and chemistry of individual cells are often hidden in the ensemble-average data sets resulting from traditional bulk analysis. Here, optically guided single cell MS profiling was utilized to investigate the chemical content of isolated DRG cells in a high-throughput manner. A unique property of the approach is sequential MALDI MS analyses; we assayed more than 1,000 individual DRG cells and identified lipids, peptides, and small proteins. The chemical content of each cell is represented by two mass spectra, which together cover the mass range from m/z 400 to 20,000. The first LM analysis yielded mass spectral information about lipids and peptides up to m/z 6,000 with high resolution, and the second HM analysis captured high molecular weight polypeptides and small proteins in the same cell up to m/z 20,000. The mass spectra reflect the nature of cell types and morphologies. We also show that although MALDI MS is generally considered destructive for small samples, the remaining cellular material after the initial analysis was sufficient for a second follow-up MS analysis.
As applied to the rodent DRG, our workflow enabled detection of a number of analytes, including several peptides derived from myelin protein P0, myelin basic protein, neurofilaments, vimentin, and thymosin beta, at single cell levels. Small cells tend to contain fewer peptides than large cells, with myelin protein P0 and vimentin among the most common. These are proteins known to be expressed at high concentrations in glial cells.[44–47] In addition, cells appearing as structurally damaged with intact nuclei showed peptide signals putatively assigned to TER ATPase and thymosin beta-4. We also detected uncharacterized putative peptides at m/z 4404 and m/z 5487, together with myelin basic protein S and neurofilament peptides in a subpopulation of large cells. Of note, peptides from neurofilament proteins, which contribute to axonogenesis and neurite growth,[50, 53, 54] were detected in many cells. The identities of these peptides were evaluated by measuring the exact molecular masses of peptides in a tissue extract via FT-ICR MS and matching them to corresponding theoretical data as well as previously published information on DRG neuron chemical profiles. These measurements also revealed more peptides derived from the aforementioned proteins.
The mass spectra were classified into three types, A, B and C, based on different peptide signal profiles, in which types B and C are more chemically heterogeneous than type A. This result could be due to the fact that type-A cells were selected based on the presence of the same ion (m/z 4404) in the results of both LM and HM analyses. We also detected small proteins at 14 kDa that appear to be specific for cell type B. These three mass spectral types account for 78% of the cells analyzed in samples from three animals. In a previous report, Usoskin et al.[7] classified DRG based on neuropeptides, and showed that 11% of DRG cells are neuropeptidergic and express high levels of substance P (Tac1 gene), trkA (Ntrk1), and CGRP. In contrast, our approach is untargeted. Future work will aim to characterize neuropeptides at the single cell level and further refine our subpopulation classification.
Single cell techniques are often evaluated in terms of the number of cells that can be analyzed per experiment (the breadth of cellular profiling) and the number of detected analytes per cell (the depth of cellular profiling). We show that our optically guided MS technique not only assays a large number of cells, but also provides coverage of lipids, peptides, and small proteins in individual cells.
Experimental Section
Chemicals and Matrix Preparation
All chemicals except where stated otherwise were purchased from MilliporeSigma (St. Louis, MO) and used without further purification. DHB matrix solution was prepared by dissolving DHB (99% purity) to 50 mg/mL in 1:1 (v/v) LC-grade ethanol/water and 0.1% trifluoroacetic acid (TFA) solvent.
Sample Preparation
Single cell samples and tissue extracts were prepared from a total of three 2.5–3 month-old male Sprague-Dawley outbred rats (Rattus norvegicus) (www.envigo.com). The animals were housed on a 12-h light cycle and fed ad libitum. Animal euthanasia was performed in accordance with the appropriate institutional animal care guidelines (the Illinois Institutional Animal Care and Use Committee), and in full compliance with federal guidelines for the humane care and treatment of animals. The studies were planned in accordance with the ARRIVE guidelines.[60] Rats were killed by quick decapitation using a sharp guillotine. Rat trunks were placed on ice, where all surgical procedures were performed. Ten to twenty DRG per animal were surgically isolated during the ~10-min dissection procedure and placed into ~5 mL of cold modified Gey’s balanced salt solution (mGBSS) containing (in mM): 1.5 CaCl2, 4.9 KCl, 0.2 KH2PO4, 11 MgCl2, 0.3 MgSO4, 138 NaCl, 27.7 NaHCO3, 0.8 Na2HPO4, 25 HEPES, and 10 glucose, pH 7.2.
Single cell dissociation
The DRG were incubated in 300 μL of 0.25% collagenase P in oxygenated Hank’s balance salt solution (HBSS) for 90 min to remove the surrounding connective tissue and isolate individual neurons. The sample was then centrifuged at 11,000 rpm for 3 min and the supernatant removed. The resulting pellet was washed with 500 μL HBSS. Next, the DRG pellet was treated with 500 μL of 0.25% trypsin in HBSS for 20 min, followed by centrifugation at 11,000 rpm to remove the supernatant. Finally, the DRG pellet was placed in 300 μL of 1% fetal bovine serum (FBS) in HBSS containing 33 μg/mL Hoechst 33342 nuclear stain (Thermo Fisher Scientific, Waltham, MA; 10 μL of 1 mg/mL stock solution). Following a 20-min incubation, DRG were mechanically dissociated by trituration. Cells were stabilized using an equal volume (300 μL) of a mixture of 80% glycerol, 20% mGBSS (v/v), and after 5–10 min, plated on ITO-coated glass slides (25 mm × 75 mm). The samples were then stored at room temperature, in the dark overnight, to allow the cells to adhere onto the ITO-glass surface. Excess glycerol-containing media was removed from the preparations shortly before analysis and the entire substrate was washed with 1 mL of 150 mM ammonium acetate (pH = 10). This wash removes excess glycerol and does not induce observable damage to the cells.[37–40] Optical images of the substrate and cell populations were obtained, followed by matrix application and MS analysis. All steps following washing were performed on the same day to prevent sample degradation and are detailed below.
Samples from each animal were treated in separate Eppendorf tubes (1.5 mL) and divided across a total of four ITO-slides; each slide contained cells from every animal in discrete locations to assess possible batch effects.
Tissue extraction
Isolated DRG were transferred into 1 mL of aqueous salt solution containing 0.15 M NaCl, 1 mM CaCl2, 1 mM HEPES for 4 h at 4°C. The sample was then centrifuged at 6000 rpm for 1 h and the supernatant collected. The supernatant was salted out with dry (NH4)2SO4 in the presence of 0.01 M EDTA and stored for three days at 4°C. The obtained solution was then centrifuged at 11,000 rpm for 1 h and the supernatant was separated from the pellet. The supernatant was desalted by solid phase extraction using a Discovery DSC-18 52603-U tube (MilliporeSigma). The resulting samples were aliquoted and freeze dried using a miVac Duo-Concentrator (GeneVac, Ipswich, UK]).
Optical Imaging and Determination of Sample Coordinates for Individual Cells
Each dispersed cell population on an ITO-coated glass slide was imaged using an Axio Imager M2 (Carl Zeiss, Oberkochen, Germany) in fluorescence and brightfield modes. An X-CITE 120 mercury lamp (Lumen Dynamics, Mississauga, Canada) and a 31000v2 DAPI filter set (Chroma Technology, Irvine, CA) were employed for fluorescence imaging. A 10× objective was used to obtain a mosaic image of the targeted surface with 13% overlap between neighboring images. Images were taken using an AxioCam ICC camera (Carl Zeiss) with a resolution of 1936 × 1460 pixels. The final image was loaded into the lab-built microMS software[56] (available at (http://neuroproteomics.scs.illinois.edu/microMS.htm) for either manual or automatic cell finding. Individual cells (50–200 cells per animal in each replicate) were manually selected from whole slide microscope images. Each cell was selected based on both fluorescence and brightfield images. In some cases, if the fluorescent signal was faint, the cells were still selected if the brightfield image showed a well-defined cell shape. Fiducial marks were used to register the image coordinates to the x,y translation stage coordinate of the mass spectrometers via the microMS software.[56] On the basis of the registration, the cell coordinates were saved in a custom geometry file for the MALDI MS FlexControl software (Bruker, Billerica, MA) for mass spectral acquisition.
Matrix Application
ITO-coated glass slides with dispersed cells were affixed onto a rotating plate for automatic matrix application, as described elsewhere.[40] The distance between the spray tip and the rotating plate was 2 cm, with a nitrogen gas pressure of 50 psi. The solution flow rate was set to10 mL/h, resulting in a matrix coating of 15 mg/cm2, respectively.
MS Measurements of Substance P Standards using CHCA and DHB
Substance P standards were prepared by serial dilution of the stock solution (1 mg/mL in water) to the desired concentrations (100 pM to 1 fM). The matrices for triple-layer application were prepared followed a previous protocol by Li and co-workers.[61, 62] The first layer was formed by pipetting 0.5 μL of 100 mM CHCA in 40/60 v/v methanol/acetone on a polished MALDI steel plate, and allowed to crystallize. The second layer was formed by adding 0.4 μL of saturated CHCA in 30/70 v/v methanol/water. After the second layer was crystallized, 1 μL of substance P standard was plated in the center of the matrix spot and allowed to dry. A gentle wash was then performed using 0.1% TFA in water for 15 s; the liquid was blown off with compressed air. For the DHB dried droplet approach, 1 μL of DHB matrix was plated on the same substrate, immediately followed by 1 μL of substance P standard. The sample spot was allowed to crystallize before analysis.
MS Instrumentation
An ultrafleXtreme MALDI TOF/TOF mass spectrometer (Bruker) with a frequency tripled Nd:YAG solid state laser was used for cell analyte profiling using the optically guided approach. Single cell MALDI MS analysis was performed in two stages. In the first stage (LM analysis), the molecular mass scan window was set to m/z 400–6000 and the laser was operated in the “Ultra” mode, producing a ~100-μm diameter footprint. Each spectrum obtained in TOF reflectron mode represents the summed signals acquired during 1,000 laser shots fired at 1 kHz. In the second stage (HM analysis), the molecular mass window was working in linear TOF mode. The mass range was set to m/z 4,000–20,000 and the laser was operated in the “Small” mode (~50 μm) footprint. The FlexControl AutoXecute feature was utilized with the custom geometry file as previously reported.[37–40]
A 7T SolariX XR FT-ICR mass spectrometer (Bruker) equipped with a dual ESI/MALDI source and managed by the ftmsControl software (v. 2.1.0, Bruker) was used to measure the molecular masses of peptides in the tissue extracts at higher resolution. External linear calibration was performed using perfluoroheptanoic acid (PFHA) clusters prior to MALDI MS analysis. Spectra were acquired in a mass range from 500–15,000, yielding a transient length of 2.4 s. Instrumental parameters of importance include a source funnel RF amplitude of 300 Vpp, TOF delay of 2.8 ms, accumulation hexapole of 1.4 MHz and 2000 Vpp, and ICR sweep excitation of 20%. Spectra were acquired with 150 laser shots using the small laser setting (~40-μm footprint) at 50–80% laser power and a frequency of 1000 Hz. Data was recalibrated in DataAnalysis (v. 4.4, Build 200.55.2969, Bruker) using internal quadratic calibration with PFHA clusters for accurate mass values.
Data Analysis
Acquired spectra were imported into MATLAB (MathWorks, Inc., Natick, MA). Spectral preprocessing consisted of baseline correction, noise-smoothing, normalization, and resampling to a bin width of 0.5 m/z. Mass spectra were normalized with the msnorm function in MATLAB to standardize the area under the curve to the group median. PCA was performed on all cells (both LM and HM) for m/z 400–6,000 (Figure 3) and 4,000–20,000 (see Supporting Information Figure S8), respectively. Peaks of highest variance for each range were selected for targeted spectral-type comparisons. Cells were considered to contain the m/z value if they exhibited a spectral peak with a S/N >3, otherwise the intensity for that m/z was set to 0 for successive analyses. The correlation heatmap was generated with all pairwise combinations of each peptide marker for all cells. The correlations, ρ, were plotted as blue and red gradients for positive and negative correlations, respectively (p ≤ 0.05). Correlations not significantly different than 0 (p > 0.05) are represented as white, whereas the intensity of blue and red represents the magnitude of correlation between peptide markers. The correlation values were clustered by HCA using an unweighted average distance to produce groups of m/z values. Peptide markers possessing both a statistically significant positive correlation within the population and negative correlation (p ≤ 0.05) to those outside of the population were selected as representative peptide markers for A-type, B-type, and C-type cells.
Supplementary Material
Acknowledgments
We gratefully acknowledge support from the National Institutes of Health, Award Number P30 DA018310 from the National Institute on Drug Abuse, Award Number 1U01 MH109062 from the National Institute of Mental Health, and the National Science Foundation, Award No. CHE 16-06791. We also acknowledge support from the National Science Foundation Graduate Research Fellowship Program (T.J.C. and E.K.N.) and the Springborn Fellowship (T.J.C., E.K.N. and J.F.E.). T.J.C. received additional support through the Training Program at Chemistry-Interface with Biology (Grant T32 GM070421).
References
- 1.Priestley JV. In: Encyclopedia of Neuroscience. Squire LR, editor. Academic Press; Oxford: 2009. pp. 935–943. [Google Scholar]
- 2.Lawson SN. Morphological and Biochemical Cell Types of Sensory Neurons, Oxford University Press, Oxford. 1992 [Google Scholar]
- 3.Fields KL, Brockes JP, Mirsky R, Wendon LMB. Cell. 1978;14:43–51. doi: 10.1016/0092-8674(78)90299-4. [DOI] [PubMed] [Google Scholar]
- 4.McMahon SB, Priestley JV. In: The Neurobiology of Pain. Hunt SP, Koltzenburg M, editors. Oxford University Press; Oxford: 2005. pp. 35–64. [Google Scholar]
- 5.Chiu IM, Barrett LB, Williams E, Strochlic DE, Lee S, Weyer AD, Lou S, Bryman G, Roberson DP, Ghasemlou N, Piccoli C, Ahat E, Wang V, Cobos EJ, Stucky CL, Ma QF, Liberles SD, Woolf CJ. Elife. 2014:3. doi: 10.7554/eLife.04660. [DOI] [PMC free article] [PubMed] [Google Scholar]
- 6.Li CL, Li KC, Wu D, Chen Y, Luo H, Zhao JR, Wang SS, Sun MM, Lu YJ, Zhong YQ, Hu XY, Hou R, Zhou BB, Bao L, Xiao HS, Zhang X. Cell Res. 2016;26:967. doi: 10.1038/cr.2016.90. [DOI] [PMC free article] [PubMed] [Google Scholar]
- 7.Usoskin D, Furlan A, Islam S, Abdo H, Lonnerberg P, Lou D, Hjerling-Leffler J, Haeggstrom J, Kharchenko O, Kharchenko PV, Linnarsson S, Ernfors P. Nat Neurosci. 2015;18:145–153. doi: 10.1038/nn.3881. [DOI] [PubMed] [Google Scholar]
- 8.Rubakhin SS, Ulanov A, Sweedler JV. J Am Soc Mass Spectrom. 2015;26:958–966. doi: 10.1007/s13361-015-1128-8. [DOI] [PMC free article] [PubMed] [Google Scholar]
- 9.Rubakhin SS, Romanova EV, Nemes P, Sweedler JV. Nat Methods. 2011;8:S20–S29. doi: 10.1038/nmeth.1549. [DOI] [PMC free article] [PubMed] [Google Scholar]
- 10.Svatos A. Anal Chem. 2011;83:5037–5044. doi: 10.1021/ac2003592. [DOI] [PubMed] [Google Scholar]
- 11.Comi TJ, Do TD, Rubakhin SS, Sweedler JV. J Am Chem Soc. 2017;139:3920–3929. doi: 10.1021/jacs.6b12822. [DOI] [PMC free article] [PubMed] [Google Scholar]
- 12.Chen X, Love JC, Navin NE, Pachter L, Stubbington MJT, Svensson V, Sweedler JV, Teichmann SA. Nat Biotechnol. 2016;34:1111–1118. doi: 10.1038/nbt.3721. [DOI] [PubMed] [Google Scholar]
- 13.Rubakhin SS, Lanni EJ, Sweedler JV. Curr Opin Biotechnol. 2013;24:95–104. doi: 10.1016/j.copbio.2012.10.021. [DOI] [PMC free article] [PubMed] [Google Scholar]
- 14.Qi M, Philip MC, Yang N, Sweedler JV. ACS Chem Neurosci. 2017;9:40–50. doi: 10.1021/acschemneuro.7b00304. [DOI] [PMC free article] [PubMed] [Google Scholar]
- 15.Bergman HM, Lanekoff I. Analyst. 2017;142:3639–3647. doi: 10.1039/c7an00885f. [DOI] [PubMed] [Google Scholar]
- 16.Yang Y, Huang Y, Wu J, Liu N, Deng J, Luan T. TrAC, Trends Anal Chem. 2017;90:14–26. [Google Scholar]
- 17.Li H, Smith BK, Shrestha B, Mark L, Vertes A. Methods Mol Biol. 2015;1203:117–127. doi: 10.1007/978-1-4939-1357-2_12. [DOI] [PubMed] [Google Scholar]
- 18.Gong X, Zhao Y, Cai S, Fu S, Yang C, Zhang S, Zhang X. Anal Chem. 2014;86:3809–3816. doi: 10.1021/ac500882e. [DOI] [PubMed] [Google Scholar]
- 19.Pan N, Rao W, Kothapalli NR, Liu R, Burgett AW, Yang Z. Anal Chem. 2014;86:9376–9380. doi: 10.1021/ac5029038. [DOI] [PubMed] [Google Scholar]
- 20.Lee JK, Jansson ET, Nam HG, Zare RN. Anal Chem. 2016;88:5453–5461. doi: 10.1021/acs.analchem.6b00881. [DOI] [PMC free article] [PubMed] [Google Scholar]
- 21.Stoeckli M, Chaurand P, Hallahan DE, Caprioli RM. Nat Med. 2001;7:493–496. doi: 10.1038/86573. [DOI] [PubMed] [Google Scholar]
- 22.Schwamborn K, Caprioli RM. Nat Rev Cancer. 2010;10:639–646. doi: 10.1038/nrc2917. [DOI] [PubMed] [Google Scholar]
- 23.Bodzon-Kulakowska A, Suder P. Mass Spectrom Rev. 2016;35:147–169. doi: 10.1002/mas.21468. [DOI] [PubMed] [Google Scholar]
- 24.Rocha B, Ruiz-Romero C, Blanco FJ. Nat Rev Rheumatol. 2017;13:52–63. doi: 10.1038/nrrheum.2016.184. [DOI] [PubMed] [Google Scholar]
- 25.Spengler B. Anal Chem. 2015;87:64–82. doi: 10.1021/ac504543v. [DOI] [PubMed] [Google Scholar]
- 26.Kaya I, Brinet D, Michno W, Baskurt M, Zetterberg H, Blenow K, Hanrieder J. ACS Chem Neurosci. 2017;8:2778–2790. doi: 10.1021/acschemneuro.7b00314. [DOI] [PubMed] [Google Scholar]
- 27.Lanni EJ, Rubakhin SS, Sweedler JV. J Proteomics. 2012;75:5036–5051. doi: 10.1016/j.jprot.2012.03.017. [DOI] [PMC free article] [PubMed] [Google Scholar]
- 28.Giesen C, Wang HAO, Schapiro D, Zivanovic N, Jacobs A, Hattendorf B, Schuffler PJ, Grolimund D, Buhmann JM, Brandt S, Varga Z, Wild PJ, Gunther D, Bodenmiller B. Nat Methods. 2014;11:417–422. doi: 10.1038/nmeth.2869. [DOI] [PubMed] [Google Scholar]
- 29.Zavalin A, Yang JH, Haase A, Holle A, Caprioli R. J Am Soc Mass Spectrom. 2014;25:1079–1082. doi: 10.1007/s13361-014-0872-5. [DOI] [PMC free article] [PubMed] [Google Scholar]
- 30.Zavalin A, Todd EM, Rawhouser PD, Yang JH, Norris JL, Caprioli RM. J Mass Spectrom. 2012;47:1473–1481. doi: 10.1002/jms.3108. [DOI] [PubMed] [Google Scholar]
- 31.Rompp A, Guenther S, Takats Z, Spengler B. Anal Bioanal Chem. 2011;401:65–73. doi: 10.1007/s00216-011-4990-7. [DOI] [PubMed] [Google Scholar]
- 32.Kompauer M, Heiles S, Spengler B. Nat Methods. 2017;14:90–96. doi: 10.1038/nmeth.4071. [DOI] [PubMed] [Google Scholar]
- 33.Passarelli MK, Ewing AG. Curr Opin Chem Biol. 2013;17:854–859. doi: 10.1016/j.cbpa.2013.07.017. [DOI] [PMC free article] [PubMed] [Google Scholar]
- 34.Urban PL, Jefimovs K, Amantonico A, Fagerer SR, Schmid T, Madler S, Puigmarti-Luis J, Goedecke N, Zenobi R. Lab Chip. 2010;10:3206–3209. doi: 10.1039/c0lc00211a. [DOI] [PubMed] [Google Scholar]
- 35.Ibanez AJ, Fagerer SR, Schmidt AM, Urban PL, Jefimovs K, Geiger P, Dechant R, Heinemann M, Zenobi R. Proc Natl Acad Sci U S A. 2013;110:8790–8794. doi: 10.1073/pnas.1209302110. [DOI] [PMC free article] [PubMed] [Google Scholar]
- 36.Fujii T, Matsuda S, Tejedor ML, Esaki T, Sakane I, Mizuno H, Tsuyama N, Masujima T. Nat Protoc. 2015;10:1445–1456. doi: 10.1038/nprot.2015.084. [DOI] [PubMed] [Google Scholar]
- 37.Ong TH, Kissick DJ, Jansson ET, Comi TJ, Romanova EV, Rubakhin SS, Sweedler JV. Anal Chem. 2015;87:7036–7042. doi: 10.1021/acs.analchem.5b01557. [DOI] [PMC free article] [PubMed] [Google Scholar]
- 38.Do TD, Comi TJ, Dunham SJB, Rubakhin SS, Sweedler JV. Anal Chem. 2017;89:3078–3086. doi: 10.1021/acs.analchem.6b04819. [DOI] [PMC free article] [PubMed] [Google Scholar]
- 39.Comi TJ, Makurath MA, Philip MC, Rubakhin SS, Sweedler JV. Anal Chem. 2017;89:7765–7772. doi: 10.1021/acs.analchem.7b01782. [DOI] [PMC free article] [PubMed] [Google Scholar]
- 40.Janson ET, Comi TJ, Rubakhin SS, Sweedler JV. ACS Chem Biol. 2016;11:2588–2595. doi: 10.1021/acschembio.6b00602. [DOI] [PMC free article] [PubMed] [Google Scholar]
- 41.Tillmaand EG, Yang N, Kindt CAC, Romanova EV, Rubakhin SS, Sweedler JV. J Am Soc Mass Spectrom. 2015;26:2051–2061. doi: 10.1007/s13361-015-1256-1. [DOI] [PMC free article] [PubMed] [Google Scholar]
- 42.Wu Q, Chu JL, Rubakhin SS, Gillette MU, Sweedler JV. Chem Sci. 2017;8:3926–3938. doi: 10.1039/c7sc00937b. [DOI] [PMC free article] [PubMed] [Google Scholar]
- 43.Il’ina AP, Kulikova OG, Mal’tsev DI, Krasnov MS, Rybakova E, Skripnikova VS, Kuznetsova ES, Buriak AK, Iamskova VP, Iamskov IA. Prikl Biokhim Mikrobiol. 2011;47:135–140. [PubMed] [Google Scholar]
- 44.Boggs JM. Cell Mol Life Sci. 2006;63:1945–1961. doi: 10.1007/s00018-006-6094-7. [DOI] [PMC free article] [PubMed] [Google Scholar]
- 45.Boggs JM, Rangaraj G, Heng YM, Liu YF, Harauz G. Biochim Biophys Acta. 2011;1808:761–773. doi: 10.1016/j.bbamem.2010.12.016. [DOI] [PubMed] [Google Scholar]
- 46.Brunden KR, Ding Y, Hennington BS. J Neurosci Res. 1992;32:507–515. doi: 10.1002/jnr.490320406. [DOI] [PubMed] [Google Scholar]
- 47.Nascimento RS, Santiago MF, Marques SA, Allodi S, Martinez AMB. Braz J Med Biol Res. 2008;41:1011–1017. doi: 10.1590/s0100-879x2008005000051. [DOI] [PubMed] [Google Scholar]
- 48.Perlson E, Hanz S, Ben-Yaakov K, Segal-Ruder Y, Seger R, Fainzilber M. Neuron. 2005;45:715–726. doi: 10.1016/j.neuron.2005.01.023. [DOI] [PubMed] [Google Scholar]
- 49.Menet V, Prieto M, Privat A, Ribotta MGY. Proc Natl Acad Sci U S A. 2003;100:8999–9004. doi: 10.1073/pnas.1533187100. [DOI] [PMC free article] [PubMed] [Google Scholar]
- 50.Wong J, Oblinger MM. J Neurosci Res. 1990;27:332–341. doi: 10.1002/jnr.490270312. [DOI] [PubMed] [Google Scholar]
- 51.Boyne LJ, Fischer I, Shea TB. Int J Dev Neurosci. 1996;14:739–748. doi: 10.1016/s0736-5748(96)00053-6. [DOI] [PubMed] [Google Scholar]
- 52.Dubey M, Hoda S, Chan WKH, Pimenta A, Ortiz DD, Shea TB. J Neurosci Res. 2004;78:245–249. doi: 10.1002/jnr.20146. [DOI] [PubMed] [Google Scholar]
- 53.Perry MJ, Lawson SN, Robertson J. J Neurocytol. 1991;20:746–758. doi: 10.1007/BF01187848. [DOI] [PubMed] [Google Scholar]
- 54.Hoffman PN, Cleveland DW. Proc Natl Acad Sci U S A. 1988;85:4530–4533. doi: 10.1073/pnas.85.12.4530. [DOI] [PMC free article] [PubMed] [Google Scholar]
- 55.Yamamoto M, Yamagishi T, Yaginuma H, Murakami K, Ueno N. Dev Brain Res. 1994;79:177–185. doi: 10.1016/0165-3806(94)90122-8. [DOI] [PubMed] [Google Scholar]
- 56.Comi TJ, Neumann EK, Do TD, Sweedler JV. J Am Soc Mass Spectrom. 2017;28:1919–1928. doi: 10.1007/s13361-017-1704-1. [DOI] [PMC free article] [PubMed] [Google Scholar]
- 57.Agar NY, Yang HW, Carroll RS, Black PM, Agar JN. Anal Chem. 2007;79:7416–7423. doi: 10.1021/ac071460e. [DOI] [PubMed] [Google Scholar]
- 58.Romanova EV, Rubakhin SS, Sweedler JV. Anal Chem. 2008;80:3379–3386. doi: 10.1021/ac7026047. [DOI] [PubMed] [Google Scholar]
- 59.Goldstein ME, Grant P, House SB, Henken DB, Gainer H. Neuroscience. 1996;71:243–258. doi: 10.1016/0306-4522(95)00404-1. [DOI] [PubMed] [Google Scholar]
- 60.Kilkenny C, Browne WJ, Cuthill IC, Emerson M, Altman DG. PLoS Biol. 2010;8:e1000412. doi: 10.1371/journal.pbio.1000412. [DOI] [PMC free article] [PubMed] [Google Scholar]
- 61.Keller BO, Li L. J Am Soc Mass Spectrom. 2001;12:1055–1063. [Google Scholar]
- 62.Keller BO, Li L. J Am Soc Mass Spectrom. 2006;17:780–785. doi: 10.1016/j.jasms.2006.02.012. [DOI] [PubMed] [Google Scholar]
Associated Data
This section collects any data citations, data availability statements, or supplementary materials included in this article.