Abstract
This study presents the theory for liquid–liquid phase separation for systems of molecules modeling monoclonal antibodies. Individual molecule is depicted as an assembly of seven hard spheres, organized to mimic the Y-shaped antibody. We consider the antibody–antibody interactions either through Fab, Fab′ (two Fab fragments may be different), or Fc domain. Interaction between these three domains of the molecule (hereafter denoted as A, B, and C, respectively) is modeled by a short-range square-well attraction. To obtain numerical results for the model under study, we adapt Wertheim’s thermodynamic perturbation theory. We use this model to calculate the liquid–liquid phase separation curve and the second virial coefficient B2. Various interaction scenarios are examined to see how the strength of the site–site interactions and their range shape the coexistence curve. In the asymmetric case, where an attraction between two sites is favored and the interaction energies for the other sites kept constant, critical temperature first increases and than strongly decreases. Some more microscopic information, for example, the probability for the particular two sites to be connected, has been calculated. Analysis of the experimental liquid–liquid phase diagrams, obtained from literature, is presented. In addition, we calculate the second virial coefficient under conditions leading to the liquid–liquid phase separation and present this quantity on the graph B2 versus protein concentration.
Graphical Abstract
1. INTRODUCTION
Information about protein phase behavior in aqueous salt solutions is needed in crystallization and precipitation processes or, as in biology and pharmacy, to avoid an undesired aggregation (see for example refs 1–7) during the various steps of the solution preparation. In past years monoclonal antibodies (mAbs) have emerged as a promising class of proteins useful in treatment of several very serious diseases.8 The problem is that mAbs are prone, as other proteins, to aggregate, making reversible and sometimes irreversible clusters. This process yields several unwanted effects: (i) it decreases mAbs therapeutic efficacy and (ii) increases the formulation viscosity, which then causes problems in the subcutaneous applications, not to mention that it (iii) makes the production process complicated. Researchers from pharmaceutical companies and academic institutions invest lots of effort to solve these challenges and to develop the formulations leading to high concentration of protein (high efficacy) at minimum viscosity; for a recent review, see also refs 9 and 10.
Despite the rapidly increasing number of papers published in this area of research, the process of protein aggregation (and even more that of mAbs) is not well understood. Experimental studies of these systems (here we mention only those most relevant for our present work)11–22 are in the majority. Among theoretical papers, treating the phase behavior of these systems, we have to mention refs 23–25. Authors of these papers used coarse grained computer simulations to get molecular insights on the mAbs association. A somewhat different approach, designed to analyze viscosity data, has recently been published by Schmitt et al.26 Notice that mAbs have a specific (Y-like) shape, which makes the theories based on centrally symmetric interactions less realistic.
In several recent papers we used Wertheim’s theories27,28—in particular his thermodynamic perturbation theory (TPT1)—to study protein solutions including the liquid–liquid phase transition.29–33 It is known34 that interactions leading to correct description of the liquid–liquid phase separation must be directional and of short-range. We showed that Wertheim’s theories are suitable to study phase separations in protein solutions; initially we analyzed experimental data for lysozyme and γIIIa-Crystallin solutions.29 In subsequent papers we extended the theory to molecules modeled as dumbbells30 and to mixtures of two proteins.32 In all cases, the molecules were decorated with attractive sites, allowing a short-range and directional inter-protein attraction. We found this approach very useful: in the spirit of the engineering theories, we needed only a few parameters to be extracted from experiment in order to calculate a spectrum of thermodynamic quantities, such as the second osmotic virial coefficient, liquid–liquid phase diagram, and several others.
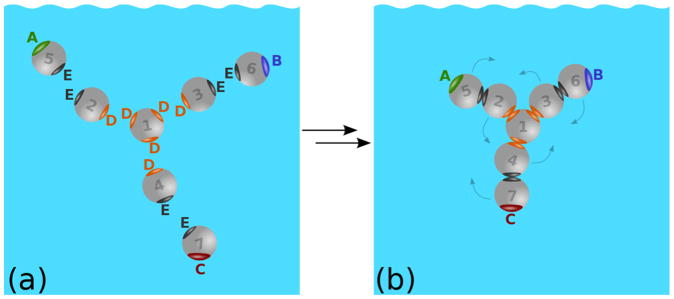
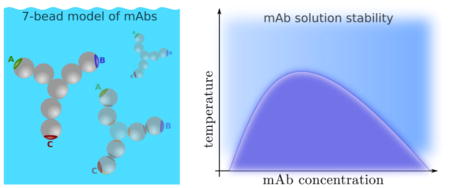
In this study we model the mAbs molecule as an assembly of seven hardspheres.33 The model molecule has a shape of the letter Y, two upper terminals are named fragment antigen-binding domains Fab and Fab′ (in the case of unequal Fab domains), and the bottom one is called the fragment crystallizable, Fc, terminal (see Figure 1). For simplicity we denote Fab by the letter A, Fab′ by B, and the Fc domain by C. Such Y-shaped particles may then interact via the attractive sites A, B, and C to form aggregates. In this way we construct a one-component liquid of mAbs molecules, having fairly realistic shape as well as an internal flexibility possessed by real molecules. The model allows, in conjunction with Wertheim’s thermodynamic perturbation theory (TPT1), calculation of thermodynamic properties.33 It is necessary to emphasize that such an approach is only applicable in the domain of concentrations and pH values where protein does not undergo major conformational changes.35,36
Figure 1.
(a) Hard spheres form model antibody molecules through intramolecular sites D (orange) and E (black). (b) Molecule is formed; A and B sites represent Fab (fragment antigen–binding) regions, and C site the Fc (fragment crystallizable) region.
In the preceding study33 we analyzed experimental viscosities and we did not examine possible phase separations. To fill this gap, our present work explores the liquid–liquid phase separation (LLPS) in aqueous monoclonal antibody solutions. We aim to calculate the coexistence curve between two liquid phases (one poor and one rich on the protein) for the model mAbs described above. As for other proteins, the liquid–liquid phase separation is metastable; from this point on, the molecules may either crystallize or an amorphous precipitate can be formed. Among experimental studies we need to mention the work of Wang et al.14 who evaluated the, so-called “colloidal stability” of antibody solutions in the presence of poly(ethylene glycol). In yet another interesting study,22 which applies to low added salt concentrations, authors use multivalent ions to trigger the phase separation. Several experimental studies11,13,14,18,19,21,22,37 also contain a theoretical analysis. Perhaps the closest model to the one examined here is presented in the simulation study of Sun et al.25
In the continuation of this work, we first examine how different site–site interactions influence the shape of the phase diagram. The fractions of molecules connected by the site i to the site j of another molecule are calculated. The study makes a connection with the available experimental data for the liquid–liquid separation curve and calculates the second virial coefficient under conditions of the phase separation.
2. THEORY AND COMPUTATIONAL DETAILS
2.1. The 7-Bead Model of Antibody Molecule
To construct the Y-shape molecule (see Figure 1), we use seven hard spheres of diameter σ, having attractive short-range sites located on the surface.33 The sites named A are shown in green, sites named B in blue, C in red, D in orange, and sites E are shown in black; only the sites of the same color are allowed to make bonds. Sphere number 1 is at the center of the molecule and has 3 D sites, contacting spheres 2, 3, and 4. Each of these three spheres is in contact with an additional sphere; they are numbered as 5, 6, and 7 (see Figure 1). In the introductory stage we use the D–D and E–E bonds to combine hard spheres into the object, resembling the Y-shape of antibody molecules. An ensemble of such molecules forms a one-component fluid of mAb molecules. Once the molecules are formed, they may interact via the intermolecular sites A (Fab), B (Fab′), and C (Fc). Notice that the number density of hard spheres of type i (i = 1–7) ρi equals the number density of mAb molecules ρ.
The procedure of assembling mAbs from hard spheres, shown schematically in Figure 1, is mathematically formulated by eqs 1 and 2). First we define the short-range interactions between spheres i and j, as
| (1) |
| (2) |
where β = (kBT)−1 and T is the absolute temperature. Here rij denotes the distance between spheres of the type i and j, and Ωi,Ωj their orientations. zDD and zEE are the distances between sites D–D and E–E. Angular brackets 〈…〉Ω1Ω2 denote the orientation average, δ(…) is the Dirac delta function, and δij the Kronecker delta. Kronecker delta symbols, written within the curly brackets {…}, provide rules for the intramolecular bond formations between the spheres i and j, and sites D and E: 1D–D2, 1D–D3, 1D–D4, 2E–E5, 3E–E6, and 4E–E7 (six intra–molecular bonds altogether). Note that each of the sites D and E can be bonded only once. Finally, the molecules representing antibodies are formed upon enforcing conditions and . Within Wertheim’s thermodynamic perturbation theory38–40 the model mAbs molecules are flexible, and the only restriction is the sequence of “bonds” (eqs 1 and 2), connecting hard spheres as shown in Figure 1.
Attractive interactions among mAb molecules are modeled by three additional attractive interaction sites, called A (Fab domain), B (Fab′ domain), and C (Fc domain). These sites permit intermolecular association. The pair potential among the model molecules k and l, ukl, can be written in the form
| (3) |
The primes on the summation signs label the spheres composing antibody molecules k and l. is the hard-sphere potential, while the sums over m and n count the interactions among A, B, and C sites belonging to different molecules. Notice that α(5) = A, α(6) = B, and α(7) = C. Similarly as above, zAA, zAB, zAC, zBB, zBC, and zCC refer to the distances between the pairs of sites. Interactions among the sites A, B, and C in eq 3, , have a form of the site–site square well potentials:
| (4) |
where εAA, εAB = εBA, εAC = εCA, εBB, εBC = εCB, and εCC (all defined as positive) are the square-well depths, and ω is the range of interaction.
2.2. Thermodynamic Perturbation Theory and the Liquid–Liquid Phase Separation
To obtain measurable properties for the model one-component system presented above, we utilize the thermodynamic perturbation theory (TPT1) of Wertheim.27,28,40 This approach proved to be useful in studies of systems of molecules interacting with strong directional forces and has been used in several recent papers.29–33 We apply here the version of the theory adapted for the 7-bead model of mAbs, suggested in our previous paper.33
In thermodynamic perturbation theory the Helmholtz free energy F is written as a sum of the ideal Fid, hard-sphere Fhs, and the association term Fass.
| (5) |
The free energy terms are defined by the following expressions:
| (6) |
| (7) |
| (8) |
where ρ is the number density of antibody molecules, Λ is the de Broglie thermal wavelength,41 ρt = 7ρ, η = πρtσ3/6, is the Percus–Yevick expression for the contact value of the hard-sphere radial distribution function,42 and XA, XB, and XC are the fractions of the particles, which do not bond via sites A, B, and C, respectively. These fractions are calculated as40
| (9) |
| (10) |
| (11) |
where
| (12) |
| (13) |
and i and j can be A, B, or C. Here f̄ij(r) is the orientation average of the Mayer function for the square-well site–site interaction,43 taken over all possible positions of sites A, B, C, D, and E on the beads. The association free energy, given by eq 8, contains the intermolecular association term (in round brackets), and six identical intramolecular terms, each equal to [ ]. The attractive potential εij in eq 13 is specified by the reduced temperature T* = kBT/ε.
Chemical potential μ of the protein species and pressure P, needed in further calculations, is obtained from41
| (14) |
| (15) |
The density derivatives of Fid/V, Fhs/V, and Fass/V are evaluated analytically.44 In the one-component system with two coexisting phases (low density denoted by ρa and high density as ρb), the pressure and chemical potentials of each component must be equal in the equilibrated phases. For a temperature T, these conditions read
| (16) |
| (17) |
The Newton–Ralphson method is used to compute number concentrations of the coexisting dilute and dense phases ρa and ρb. All the calculations are performed in dimensionless energy units.
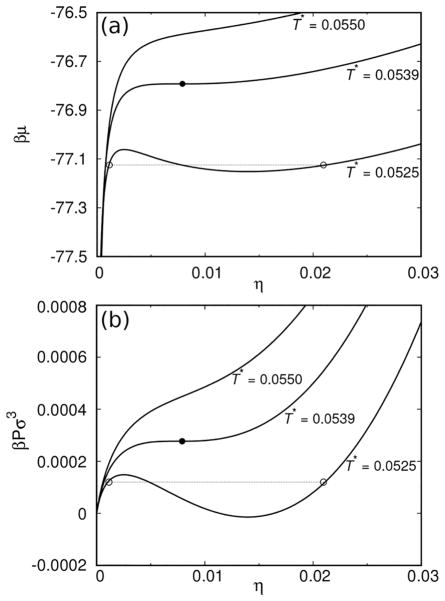
The results of calculations, shown in Figure 2, apply to the case where the attractive interactions between the three sites, A–B, A–C, and B–C are equal to each other: εAB = εAC = εBC = ε (ω = 0.05 σ). First, we show the chemical potential of the protein μ(T) as a function of its concentration in solution (Figure 2a). Three isotherms are shown: (i) one above the reduced critical temperature Tc (top isotherm; T* = 0.0550), (ii) the isotherm at Tc (the middle one; T* = 0.0539), and (iii) the one below Tc (the bottom one; T* = 0.0525), showing typical van der Waals loops. In addition, in panel b of the same figure, we present the graphs of the reduced pressure βPσ3, using the same values of parameters as above.
Figure 2.
(a) Reduced chemical potential βμas a function of the occupied volume, η, at various reduced temperatures, T* = kBT/ε. Top curve is supercritical, the middle one represents the critical isotherm, and the bottom one applies to conditions where phase separation takes place. The values of the reduced temperatures T* are for each graph shown on the figure. The open circles connected by the line denote the equilibrium points, while the full circle denotes the critical conditions. (b) The reduced pressure βPσ3 as a function of the occupied volume η. Notation as for panel (a).
2.3. Fraction of the Molecules Connected by the Site i to the Site j of Another Molecule
Within the model presented above, the Y-shaped molecules interact via sites A, B (Fab and Fab′ fragments), and C (Fc fragment) allowing A–A, A–B, A–C, B–B, B–C, and C–C site–site interactions. Fractions of molecules not bonded via sites A, B, and C (XA, XB, and XC), defined by eqs 9–11, allow calculation of the free energy function and subsequently the thermodynamic properties of interest. Additional information about the system can be obtained by calculating the probability for the sites i and j, belonging to two different molecules, to be connected by a bond. To calculate this quantity, we define fractions of molecules that are bonded via sites A (PA), B (PB), and C (PC) as
| (18) |
| (19) |
| (20) |
where Pi↔j (i, j ∈{A, B, C}) denotes the fraction of molecules that are connected by the site i on the first molecule with the site j on the second one.
| (21) |
| (22) |
We seek the solution of this set of equations in the form of eq 21, which can be rationalized using the analogy with expressions of the statistical mechanics. The denominator of eq 21 defines the partition function for site i as a sum of weights for four accessible states: (i) non-bonded (1), (ii) bonded to site A (ρΔiAXA), (iii) bonded to site B (ρΔiBXB), or (iv) bonded to site C (ρΔiCXC). With the weight in the nominator in eq 21 we get the fraction (probability) of molecules that are bonded from site i to site j. Equation 22 simply follows from the mass action law, and because Δij = Δji, we conclude that Pi↔j = Pj↔i. The last possibility to be considered is the fraction of molecules not bonded through any of the sites A, B, and C. The fraction of such molecules (monomers), P0, is
| (23) |
Graphical illustration of these results is given in the next paragraph.
3. RESULTS AND DISCUSSION
3.1. Site–Site Interactions Shape the Liquid–Liquid Phase Separation Curve
Crystal structures of the complete length mAbs are difficult to obtain and not very many are available.45,46 A successful result, where crystal structures of fragments are combined with computer analysis, is reported by Brandt and co-workers.47 Protein structure, obtained this way, was then used to construct the coarse-grained models used in computer simulations.23 Chaudri et al.23 simulated two different mAbs models and concluded that in the first one (named MAb1) Fab–Fc interactions are equally dominant as Fab–Fab interactions. In contrast to this, the second protein, named MAb2, is characterized by an absence of strong Fab–Fab interactions. This feature results in a more homogeneous distribution of molecules as for the MAb1 species, where clusters are formed.23 In both cases, the Fc–Fc interactions have little impact. It appears that interaction between the antibodies and, consequently, their self-association depends on chemical details of the interacting domains.
In this first study we take an advantage of the fact that our approach is practically analytical and accordingly computationally very efficient. This allows us to explore a range of different interaction possibilities among the relevant domains, which may or may not lead to the liquid–liquid phase separation. While the model presented here is not able to include chemical details of the mAb molecule explicitly, it allows relatively simple and fast calculations of thermodynamic properties, which may be difficult (or even impossible) to obtain through the more realistic computer modeling. Preliminary calculations indicate that at least three attractive intermolecular site–site interactions are needed for the model solution to undergo the liquid–liquid phase separation. Note that this is only the necessary and not also the sufficient condition for the phase separation to occur.
As mentioned before, with three attractive sites A, B, and C, six different site–site interactions are possible. While so far our treatment was general in the numerical calculations from now on we only allow for the A–B, A–C, and B–C site–site interactions to be meaningful, while all the others (A–A, B–B, and C–C interactions) are ignored. This choice is motivated by simplicity, it requires a small number of parameters. Despite this, the model is rich enough to allow an examination of the effect of asymmetry in the site–site interaction to the phase separation curve. In what follows, we explore three different situations: (i) the symmetric case, where εAB = εAC = εBC, varying from ε over 1.1 ε and 1.2 ε to 1.3 ε.; example (ii), where εAB = εAC vary between ε and 1.3 ε, while εBC is fixed at ε; and example (iii), where εAC = εBC = ε, while εAB assumes the values equal to ε, 1.1 ε, 1.2 ε, and 1.3 ε. Notice again that volume physically excluded by molecules η is equal to πρtσ3/6. In all the calculations performed in this section, the intermolecular interaction between the identical sites, εAA = εBB = εCC is assumed to be zero as already mentioned above.
3.1.1. The Symmetric Case: εAB = εAC = εBC vary from ε to 1.3 ε
Two principal parameters of the model are the strength εij and the range of attractive interaction ω among the sites A, B, and C. The results of calculations are for the symmetric case, where εAB = εAC = εBC and for a fixed value of ω, presented in Figure 3. The top panel presents the liquid–liquid phase separation curve as a function of the attractive interaction strength εij. The middle panel shows the fraction of molecules Pi↔j (i, j ∈{A, B, C}) that are connected through site i of the first molecule to site j of the second molecule. Finally, in the bottom panel, we show the fraction of molecules connected via sites A, B, or C. In all cases, we explore the excluded volume, η, dependence of these quantities.
Figure 3.
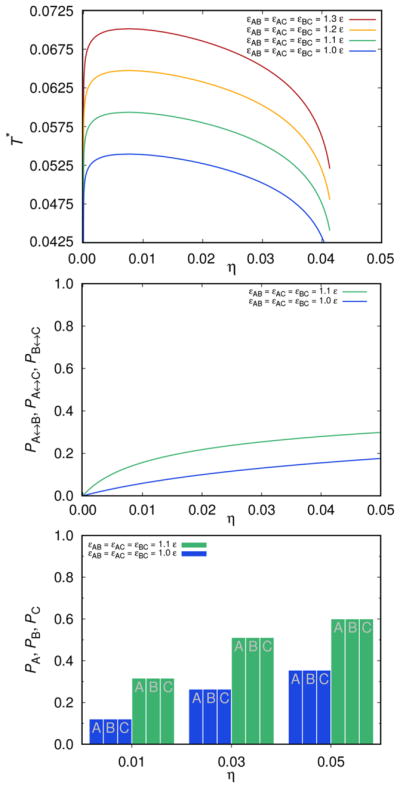
Top panel: liquid–liquid separation curve for the case where εAB = εAC = εBC vary, while ω = 0.05 σ is kept constant. Middle panel: fractions of molecules Pi↔j (i, j ∈{A, B, C}) that are connected through the site i on the first molecule to the site j on the second molecule. Bottom panel: the histogram is showing PA, PB, and PC as a function of the volume fraction η of mAbs; T* = kBT/ε = 0.0675.
As noticed before for globular proteins, an increase of the strength of the attraction (making attraction εij stronger), increases the critical temperature. The same dependence holds true for the variation of the attraction range parameter: increasing ω yields an increase of the critical temperature. This plot is not shown here (see SI for these graphs). One other observation, being in line with experimental findings, is the very low critical concentration (critical η here) of the antibody solutions in comparison with the solutions of globular proteins. In our case, the critical value of η is around 0.008 and does not change much with the strength and range of the protein–protein attraction. Further, the shape of the liquid–liquid separation curve is asymmetric: it is steeper in its low concentration part. Notice that, due to the symmetry of the site–site interaction PA = PB = PC, and the fractions Pi↔j are equal for all three i,j pairs. Of course both of these quantities depend on the interaction strength εij.
3.1.2. The First Asymmetric Case: εBC = ε and εAB = εAC Vary from ε to 1.3 ε
In the next two examples, we examine the effects of the interaction asymmetry on the shape of the liquid–liquid phase diagram. First, in Figure 4, we examine the case where εBC = ε, while εAB = εAC vary from ε to 1.3 ε. We start with the top panel, showing the liquid–liquid separation curves. As we see, the critical temperature follows a similar trend as described in the previous subsection (symmetric case) above: it increases from εAB = εAC = ε (bottom curve, blue) to εAB = εAC = 1.3 ε (top curve, red). An increase of the critical temperature, however, is much less than seen in Figure 3. At the same time, critical η value moves toward smaller values. In the middle panel we present the fraction of molecules Pi↔j (i, j ∈{A, B, C}), connected through sites i and j. As it is easy to notice the effects on the PB↔C (broken lines) are relatively small. Finally, the histogram presented at the bottom panel of this figure, shows the fractions of molecules connected via the sites A, B, and C. Due to the interaction energy values (εAB = εAC > εBC), we have PA > PB = PC. For strong attraction and high η values, PA exceeds the value 0.9.
Figure 4.
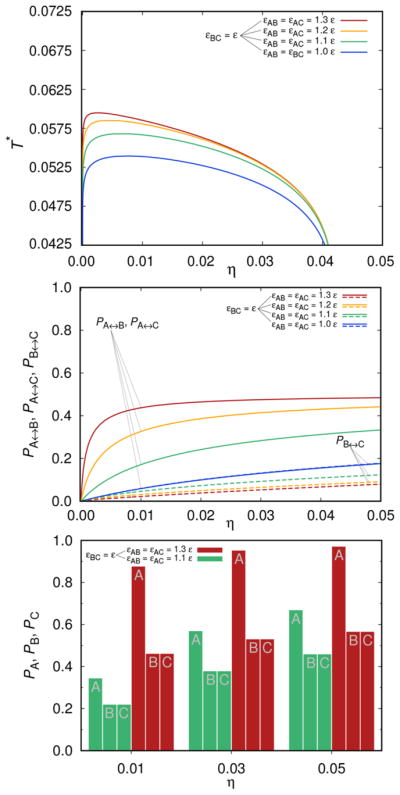
Top panel shows the liquid–liquid separation curve: εBC = ε and constant, while εAB = εAC vary in the range from ε, 1.1 ε, 1.2 ε, to 1.3 ε (εAA = εBB = εCC = 0). Middle panel shows how the probability Pi↔j (i, j ∈{A, B, C}) varies with the attraction strength. Bottom panel: the histogram is showing PA, PB, and PC as a function of the volume fraction η of mAbs; kBT/ε = 0.0675.
3.1.3. The Second Asymmetric Case: εAC = εBC = ε and εAB varies from ε to 1.3 ε
In the top panel of Figure 5 we show the liquid–liquid separation curve variations for the situation where εAC = εBC is fixed to ε, while εAB assumes the values equal to ε, 1.1 ε, 1.2 ε, and 1.3 ε. Here the situation is more complex and can be summarized as follows: (i) critical temperature does not change monotonically with the εAB increase; it first increases and then decreases, being the lowest for the strongest attraction studied here, where εAB = 1.3 ε. (ii) The critical volume fraction η decreases with the εAB increase. In general (iii) the shape of the liquid–liquid separation curve changes with the energy variation more dramatically than for the examples shown before. As expected, the effects of the energy variations on PA↔C = PB↔C (broken lines) are much smaller than on PA↔B.
Figure 5.
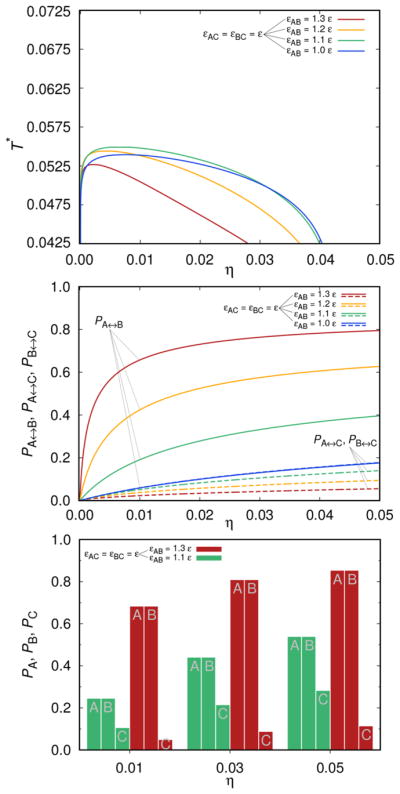
Same as for previous two figures except that εAC = εBC = ε, while εAB varies in the range ε, 1.1 ε, 1.2 ε, and 1.3 ε. Top panel shows the liquid–liquid separation curves, the middle panel Pi↔j, and the bottom one PA, PB, and PC. Again kBT/ε = 0.0675 and ω = 0.05 σ.
So what is the reason for the critical conditions in Figure 5 to behave differently with respect to the energy increase as those presented above? The critical temperature is expected to rise with the strength of the attractive interaction among the molecules, as demonstrated in Figures 3 and 4. Also in the case presented in this subsection the critical temperature first rises with the strength of the attractive interaction (see green and yellow curves, where εAB is equal 1.1 and 1.2 ε) but then, with further increase of the attraction (red curve; εAB = 1.3 ε), it decreases. In our view, the reason is that by favoring the εAB interaction we favor the formation of pairs and chains on the expense of the branched structures, which decreases the critical temperature. It is topology of clusters which influences the critical conditions. For the extreme situation with εAB much greater than εAC = εBC, where chains and clusters of two molecules prevail, we expect even to lose the two-phase behavior.
At the end we also wish to briefly comment on the fraction of monomers, P0, not shown in the figures above. This quantity monotonically decreases with the increasing strength of interaction and fraction of occupied volume η in all three cases discussed in the subsections 3.1.1–3.1.2.
3.2. Analysis of the Experimental Liquid–Liquid Phase Diagrams
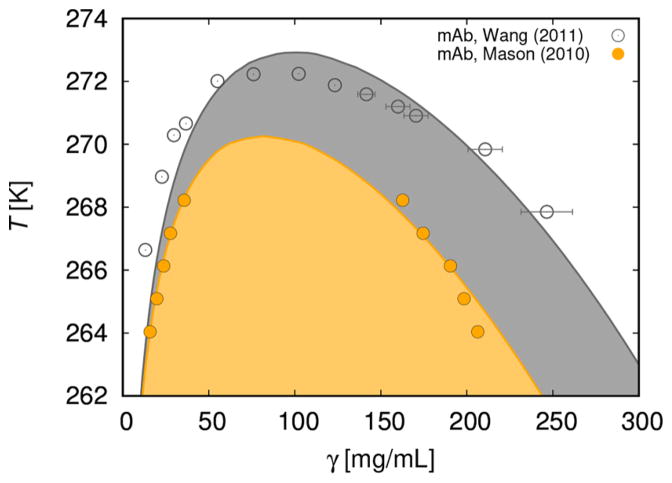
In this section (Figure 6) we use the 7–bead model to analyze experimental data for the liquid–liquid phase separation curve. For this purpose we choose the measurements of Mason and co–workers11 (example 1 is shown in their Figure 2) and of Wang et al.37(example 2). Symbols denote experimental data and lines our calculations. For the first case11 a reasonably good agreement between measurements and calculations is obtained assuming that εAC = εBC = 4104 K kB, εAB = 4730 K kB and for the second37 εAC = εBC = 4172 K kB, εAB = 4416 K kB. In both cases ω = 0.18 nm. Using these parameters, we can reproduce the main experimental features of mAbs solutions: critical concentration is several times lower than for globular proteins and the shape of the curve is a bit asymmetric. More exactly, for example 1, the calculated critical concentration is around γ = 80 mg/mL and the critical temperature is slightly above 270 K. The values, suggested by experiment,11 are 87.1 ± 4.0 mg/mL for the critical concentration, while Tc is 268.5 K.
Figure 6.
Liquid–liquid separation curve temperature (in Kelvin) versus protein concentration γ given in mg/mL: calculated (full line), symbols denote experimental data. Example 1:11 εAC = εBC = 4104 K kB and εAB = 4730 K kB. Example 2:37 εAC = εBC = 4172 K kB and εAB = 4416 K kB. In both cases, σ = 1.7 nm (estimated from the specific molar volume suggested to be 0.728 mL/g50), while ω = 0.18 nm. The two-phase region is indicated by the shaded area.
In example 2 we analyze the measurements of Wang et al.37 (Figure 6). The solution has higher critical temperature than the one studied in the example 1. To get agreement with experimental data, we need to assume that εAC = εBC = 4172 K kB and εAB = 4416 K kB. For this solution the experimental value of Tc is 272.4 ± 0.1 K, and the critical concentration γ is 90 ± 9 mg/mL. The calculated values are 272.9 K and 98 mg/mL. We wish to stress that we compare two different antibodies, studied at very different experimental conditions. The first one is examined11 at low ionic strength (22 mM) of potassium phosphate at pH = 7.1 (supposedly close to the pI of this antibody) and the second one37 in 0.1 M Tris–HCl buffer at pH = 7.4 (pI of this mAb is 8.8). For this reason, the need to use different fitting parameters in examples 1 and 2 is not a surprise.
In one of our previous papers,29 we analyzed the liquid–liquid phase diagrams for lysozyme in phosphate buffer (pH 6.0, ionic strength 0.6 M)48 and for γIIIa-Crystallin (pH 7.1, phosphate buffer of concentration 0.24 M).49 The critical temperatures above which we find the one–phase regions were estimated to be 274 ± 2 K for lysozyme and 312 ± 2 K for γIIIa Crystallin. Obviously these critical temperatures are not much different from those of the mAb molecules analyzed above. On the other hand, globular proteins have much higher critical concentrations than solutions of monoclonal antibodies: for lysozyme it is around 230 and for γIIIa-Crystallin around 300 mg/mL. Low values of critical concentrations in mAbs solutions can be attributed to the shape and size (perhaps also the flexibility) of these molecules.11,22,37
3.3. The Second Virial Coefficient
It has been suggested that protein aggregation propensity can be predicted from dilute-solution measurements. One such example is the second virial coefficient, known also to be a predictor for protein crystallization.51–55 Recently we examined the behavior of two important coefficients, giving information about binary interactions, that is, B22 and the Huggins constant from the viscosity equation.33 The results, showing an excellent correlation between these two coefficients, are in line with the findings of Tomar et al.9 stating, that large positive second virial coefficient is suggestive of low viscosity of antibody solutions up to 150 mg/mL.
The second virial osmotic coefficient B22 is defined as56
| (24) |
Note that P in a one-component system plays the role of the osmotic pressure (in the literature most often denoted by Π), M2 the molar mass of protein, and R the gas constant. B22 can be obtained from eq 24 at low mass concentrations γ. The hypothesis of a “crystallization slot” (i.e., the region where protein crystallization is most likely to occur), proposed by George and Wilson51 to be in the range from −2 × 10⁻⁴ to −8× 10⁻⁴ cm3 mol g−2, has been experimentally confirmed for globular proteins with molar masses around 14 kDa. The situation with antibody solutions appears to be different. Thermodynamic connection of B22 with phase behavior of these solutions has been examined by Rakel et al.18,19 as also by other authors.11,12,57 Rakel et al. determined the B22 values for several antibody molecules varying the pH, as also the concentration and nature of added salt in solution. Their conclusion is that crystallization probability and measured second virial coefficients values are not correlated well enough to make solid predictions about crystallization. In their opinion, this finding can be, at least in part, attributed to the specific shape of antibodies having considerably larger surface area than globular proteins of similar molecular mass. In agreement with these studies Lewus and co-workers57 concluded that the osmotic second virial coefficient does not provide clear information to predict the crystallization.
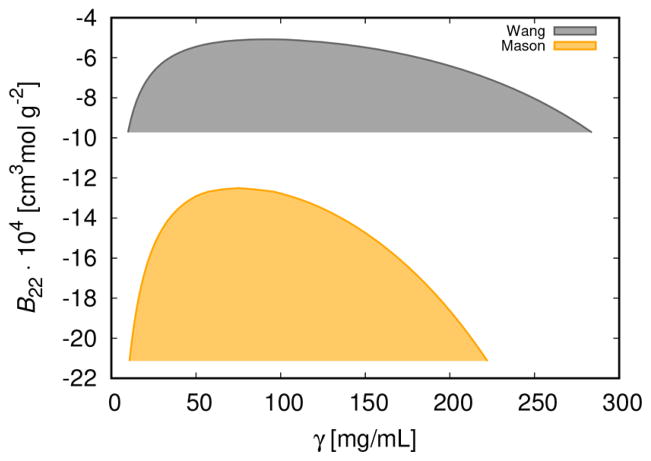
The trends in protein phase behavior have their origin in the protein–protein interaction, which is reflected in the second virial coefficient. Because B22 is the function of temperature only, we can transform graphs in Figure 6 into B22 versus γ graphs, shown in Figure 7. This type of graph is called the “universal” phase diagram.58 For the first example11 (bottom curve), the calculated value of B22 at critical conditions appears to be considerably more negative than for the second one,37 where it is about −5.1 × 10⁻⁴ cm3 mol g−2. It seems that both the asymmetry in interactions as well as their magnitude affect this quantity.
Figure 7.
Second virial coefficient, B22, as a function of γ. The parameters are as for Figure 6.
4. CONCLUSIONS
Theoretical studies of mAbs solutions are challenging due to the specific shape and flexibility of these molecules. In this contribution we present a theoretical approach, which treats the model antibody molecule as an assembly of seven equal-in-size hard spheres, organized to mimic the shape of the letter Y. In this way the model goes beyond many previous studies, treating protein molecules as structureless rigid spheres. The interaction between the molecules is possible through the Fab (A), Fab′ (B), and Fc (C) domains, which are in this calculation approximated by the attractive square-wells.
Using a relatively simple Hamilton function, coupled with Wertheim’s thermodynamic perturbation theory, we constructed the free energy of the one component fluid of Y-like molecules. The theory is used to calculate various properties, for example, the liquid–liquid phase separation curve and the second virial coefficient, as well as some more microscopic properties, reflecting the connectivity of the sites. Effects of varying the attractive energy between the tips of the Y-shaped molecule on the critical conditions is investigated. It appears that critical protein concentration is only marginally sensitive on the strength of the attractive interaction. In contrast to this, the asymmetry in energy parameter ε may cause either decrease or an increase of the critical temperature, depending on how the attraction is distributed between the three sites.
Next, we use the theory to analyze published experimental data for the liquid–liquid separation curves of two different antibodies. In agreement with measurements, we found the critical mAbs concentration to be much lower than in case of globular proteins. Notice that in this exploratory analysis of experiments, we only allowed for the A–B, A–C, and B–C interaction to take place, while the A–A, B–B, and C–C inter–molecular interactions are set to zero. This can be part of the reason why the agreement between the experimental and calculated liquid–liquid phase separation curves is only qualitative. An alternative choice, where A–A, B–B, A–C, and B–C pair interactions are the most important, has been suggested in literature.59 For different mAbs molecules, however, different pairs of interactions may be dominant. In order to make a more realistic judgment of which site–site interaction are the most relevant under given experimental conditions, more experimental studies, if possible supported by computer simulations, are needed. Finally we use the energy parameters extracted from the temperature–concentration graphs to construct the B22–protein concentration (B22–γ) dependence.
The study demonstrates that Wertheim’s thermodynamic perturbation theory is able to study fluids of complex molecules. While the theory cannot compete with computer simulations in describing the microscopic picture, it provides a way to efficiently test simple models through calculation of thermodynamic properties. In the next study, we plan to examine the phase separation induced by the non-adsorbing polymer and to develop a more realistic model of solution, previously proposed for solutions of globular proteins,60 where ions and water molecules will be included in the picture. We hope that the present work will stimulate further theoretical studies, fostering better understanding of clustering of monoclonal antibodies in aqueous solutions.
Supplementary Material
Acknowledgments
This study was supported by the Slovenian Research Agency fund (ARRS) through Programs P1–0201 and P2–0152, by the National Institutes of Health (NIH) USA research grant 5R01GM063592–15, and Young Researchers Program (M. K.) of the Republic of Slovenia. The authors acknowledge fruitful discussions with Professors Tomaž Urbič and Yura V. Kalyuzhnyi.
Footnotes
Notes
The authors declare no competing financial interest.
The Supporting Information is available free of charge on the ACS Publications website at DOI: 10.1021/acs.jpcb.7b11458.
Effect of the range of square-well potential ω on the liquid–liquid phase separation (PDF)
References
- 1.Wang W. Protein aggregation and its inhibition in biopharmaceutics. Int J Pharm. 2005;289:1–30. doi: 10.1016/j.ijpharm.2004.11.014. [DOI] [PubMed] [Google Scholar]
- 2.Gunton JD, Shiryayev A, Pagan DL, editors. Protein Condensation: Kinetic Pathways to Crystallization and Disease. Cambridge University Press; Cambridge, U.K: 2007. [Google Scholar]
- 3.Amin S, Barnett GV, Pathak JA, Roberts CJ, Sarangapani PS. Protein aggregation, particle formation, characterization & rheology. Curr Opin Colloid Interface Sci. 2014;19:438–449. [Google Scholar]
- 4.Ahnert SE, Marsh JA, Hernández H, Robinson CV, Teichmann SA. Principles of assembly reveal a periodic table of protein complexes. Science. 2015;350:2245. doi: 10.1126/science.aaa2245. [DOI] [PubMed] [Google Scholar]
- 5.James S, Quinn MK, McManus JJ. The self assembly of proteins; probing patchy protein interactions. Phys Chem Chem Phys. 2015;17:5413. doi: 10.1039/c4cp05892e. [DOI] [PubMed] [Google Scholar]
- 6.Fusco D, Charbonneau P. Soft matter perspective on protein crystal assembly. Colloids Surf, B. 2016;137:22–31. doi: 10.1016/j.colsurfb.2015.07.023. [DOI] [PubMed] [Google Scholar]
- 7.McManus JJ, Charbonneau P, Zaccarelli E, Asherie N. The physics of protein self–assembly. Curr Opin Colloid Interface Sci. 2016;22:73–79. [Google Scholar]
- 8.Elbakri A, Nelson PN, Abu Odeh RO. The state of antibody therapy. Hum Immunol. 2010;71:1243–1250. doi: 10.1016/j.humimm.2010.09.007. [DOI] [PubMed] [Google Scholar]
- 9.Tomar DS, Kumar S, Singh SK, Goswami S, Li L. Molecular basis of high viscosity in concentrated antibody solutions: Strategies for high concentration drug product development. mAbs. 2016;8:216–228. doi: 10.1080/19420862.2015.1128606. [DOI] [PMC free article] [PubMed] [Google Scholar]
- 10.Lee CC, Perchiacca JM, Tessier PM. Toward aggregation-resistant antibodies by design. Trends Biotechnol. 2013;31:612–620. doi: 10.1016/j.tibtech.2013.07.002. [DOI] [PubMed] [Google Scholar]
- 11.Mason BD, Zhang-van Enk J, Zhang L, Remmele RL, Zhang J. Liquid-liquid phase separation of a monoclonal antibody and nonmonotonic influence of Hofmeister anions. Biophys J. 2010;99:3792–3800. doi: 10.1016/j.bpj.2010.10.040. [DOI] [PMC free article] [PubMed] [Google Scholar]
- 12.Saito S, Hasegawa J, Kobayashi N, Kishi N, Uchiyama S, Fukui K. Behavior of monoclonal antibodies: Relation between the second virial coefficient (B2) at low concentrations and aggregation propensity and viscosity at high concentrations. Pharm Res. 2012;29:397–410. doi: 10.1007/s11095-011-0563-x. [DOI] [PubMed] [Google Scholar]
- 13.Wang Y, Lomakin A, Latypov RF, Laubach JP, Hideshima T, Richardson PG, Munshi NC, Anderson KC, Benedek GB. Phase transitions in human IgG solutions. J Chem Phys. 2013;139:121904. doi: 10.1063/1.4811345. [DOI] [PMC free article] [PubMed] [Google Scholar]
- 14.Wang Y, Latypov RF, Lomakin A, Meyer JA, Kerwin BA, Vunnum S, Benedek GB. Quantitative evaluation of colloidal stability of antibody solutions using PEG-induced liquid-liquid phase separation. Mol Pharmaceutics. 2014;11:1391–1402. doi: 10.1021/mp400521b. [DOI] [PubMed] [Google Scholar]
- 15.Li L, Kumar S, Buck PM, Burns C, Lavoie J, Singh SK, Warne NW, Nichols P, Luksha N, Boardman D. Concentration dependent viscosity of monoclonal antibody solutions: Explaining experimental behavior in terms of molecular properties. Pharm Res. 2014;31:3161–3178. doi: 10.1007/s11095-014-1409-0. [DOI] [PubMed] [Google Scholar]
- 16.Li W, Prabakaran P, Chen W, Zhu Z, Feng Y, Dimitrov DS. Antibody aggregation: Insights from sequence and structure. Antibodies. 2016;5:19–41. doi: 10.3390/antib5030019. [DOI] [PMC free article] [PubMed] [Google Scholar]
- 17.Roberts D, Keeling R, Tracka M, van der Walle CF, Uddin S, Warwicker J, Curtis R. Specific ion and buffer effects on protein–protein interactions of a monoclonal antibody. Mol Pharmaceutics. 2015;12:179–193. doi: 10.1021/mp500533c. [DOI] [PubMed] [Google Scholar]
- 18.Rakel N, Baum M, Hubbuch J. Moving through three-dimensional phase diagrams of monoclonal antibodies. Biotechnol Prog. 2014;30:1103–1113. doi: 10.1002/btpr.1947. [DOI] [PubMed] [Google Scholar]
- 19.Rakel N, Bauer KC, Galm L, Hubbuch J. From osmotic second virial coefficient (B22) to phase behavior of a monoclonal antibody. Biotechnol Prog. 2015;31:438–451. doi: 10.1002/btpr.2065. [DOI] [PubMed] [Google Scholar]
- 20.Esfandiary R, Hayes DB, Parupudi A, Casas-Finet J, Bai S, Samra HS, Shah AU, Sathish HA. A systematic multitechnique approach for detection and characterization of reversible self–association during formulation development of therapeutic antibodies. J Pharm Sci. 2013;102:62–72. doi: 10.1002/jps.23369. [DOI] [PubMed] [Google Scholar]
- 21.Dear BJ, Hung JJ, Truskett TM, Johnston KP. Contrasting the influence of cationic amino acids on the viscosity and stability of a highly concentrated monoclonal antibody. Pharm Res. 2017;34:193–207. doi: 10.1007/s11095-016-2055-5. [DOI] [PubMed] [Google Scholar]
- 22.Reiche K, Hartl J, Blume A, Garidel P. Liquid-liquid phase separation of a monoclonal antibody at low ionic strength: Influence of anion charge and concentration. Biophys Chem. 2017;220:7–19. doi: 10.1016/j.bpc.2016.08.003. [DOI] [PubMed] [Google Scholar]
- 23.Chaudhri A, Zarraga IE, Kamerzell TJ, Brandt JP, Patapoff TW, Shire SJ, Voth GA. Coarse–grained modeling of the self–association of therapeutic monoclonal antibodies. J Phys Chem B. 2012;116:8045–8057. doi: 10.1021/jp301140u. [DOI] [PubMed] [Google Scholar]
- 24.Buck PM, Chaudhri A, Kumar S, Singh SK. Highly viscous antibody solutions are a concequence of network formation caused by domain–domain electrostatic complementarities: Insights from coarse–grained simulations. Mol Pharmaceutics. 2015;12:127–139. doi: 10.1021/mp500485w. [DOI] [PubMed] [Google Scholar]
- 25.Sun G, Wang Y, Lomakin A, Benedek GB, Stanley HE, Xu L, Buldyrev SV. The phase behavior study of human antibody solution using multi-scale modeling. J Chem Phys. 2016;145:194901. doi: 10.1063/1.4966972. [DOI] [PubMed] [Google Scholar]
- 26.Schmit JD, He F, Mishra S, Ketchem RR, Woods CE, Kerwin BA. Entanglement model of antibody viscosity. J Phys Chem B. 2014;118:5044–5049. doi: 10.1021/jp500434b. [DOI] [PubMed] [Google Scholar]
- 27.Wertheim MS. Fluids with highly directional attractive forces. III. Multiple attraction sites. J Stat Phys. 1986;42:459–476. [Google Scholar]
- 28.Wertheim MS. Fluids with highly directional attractive forces. IV. Equilibrium polymerization. J Stat Phys. 1986;42:477–492. [Google Scholar]
- 29.Kastelic M, Kalyuzhnyi YV, Hribar-Lee B, Dill KA, Vlachy V. Protein aggregation in salt solutions. Proc Natl Acad Sci U S A. 2015;112:6766–6770. doi: 10.1073/pnas.1507303112. [DOI] [PMC free article] [PubMed] [Google Scholar]
- 30.Kastelic M, Kalyuzhnyi YV, Vlachy V. Fluid of fused spheres as a model for protein solution. Condens Matter Phys. 2016;19:23801. [Google Scholar]
- 31.Janc T, Kastelic M, Bončina M, Vlachy V. Salt–specific effects in lysozyme solutions. Condens Matter Phys. 2016;19:23601. [Google Scholar]
- 32.Kastelic M, Kalyuzhnyi YV, Vlachy V. Modeling phase transitions in mixtures of β–γ lens crystallins. Soft Matter. 2016;12:7289–7298. doi: 10.1039/c6sm01513a. [DOI] [PMC free article] [PubMed] [Google Scholar]
- 33.Kastelic M, Kalyuzhnyi YV, Dill KA, Vlachy V. Controlling the viscosities of antibody solutions through control of their binding sites. J Mol Liq. 2017 doi: 10.1016/j.mol-liq.2017.11.106. [DOI] [PMC free article] [PubMed] [Google Scholar]
- 34.Kern N, Frenkel D. Fluid-fluid coexistence in colloidal systems with short-ranged strongly directional attraction. J Chem Phys. 2003;118:9882–9889. [Google Scholar]
- 35.Sarangapani PS, Hudson SD, Jones RL, Douglas JF, Pathak JA. Critical examination of the colloidal particle model of globular proteins. Biophys J. 2015;108:724. doi: 10.1016/j.bpj.2014.11.3483. [DOI] [PMC free article] [PubMed] [Google Scholar]
- 36.Prausnitz JM. The fallacy of misplaced concreteness. Biophys J. 2015;108:453. doi: 10.1016/j.bpj.2014.11.3486. [DOI] [PMC free article] [PubMed] [Google Scholar]
- 37.Wang Y, Lomakin A, Latypov RF, Benedek GB. Phase separation in solutions of monoclonal antibodies and the effect of human serum albumin. Proc Natl Acad Sci U S A. 2011;108:16606–16611. doi: 10.1073/pnas.1112241108. [DOI] [PMC free article] [PubMed] [Google Scholar]
- 38.Wertheim MS. Fluids with highly directional attractive forces. I. Statistical thermodynamics. J Stat Phys. 1984;35:19–34. [Google Scholar]
- 39.Wertheim MS. Fluids with highly directional attractive forces. II. Thermodynamic perturbation theory and integral equations. J Stat Phys. 1984;35:35–47. [Google Scholar]
- 40.Chapman WG, Jackson G, Gubbins KE. Phase equilibria of associating fluids chain molecules with multiple bonding sites. Mol Phys. 1988;65:1057–1079. [Google Scholar]
- 41.Hansen JP, McDonald IR, editors. Theory of Simple Liquids. Elsevier; Boston: 2006. [Google Scholar]
- 42.Lebowitz JL. Exact solution of generalized Percus–Yevick equation for a mixture of hard spheres. Phys Rev. 1964;133:A895–A899. [Google Scholar]
- 43.Wertheim MS. Fluids of dimerizing hard spheres, and fluid mixtures of hard spheres and dispheres. J Chem Phys. 1986;85:2929–2936. [Google Scholar]
- 44.Kalyuzhnyi YV, Hlushak SP. Phase coexistence in polydisperse multi–Yukawa hard–sphere fluid: High temperature approximation. J Chem Phys. 2006;125:034501. doi: 10.1063/1.2212419. [DOI] [PubMed] [Google Scholar]
- 45.Stura EA, Feinstein A, Wilson IA. Crystallization and preliminary crystallographic data for an antiprogesterone monoclonal antibody Fab′ and steroid-Fab′ complexes. J Mol Biol. 1987;193:229–231. doi: 10.1016/0022-2836(87)90642-5. [DOI] [PubMed] [Google Scholar]
- 46.Wun KS, Miles LA, Crespi GA, Wycherley K, Ascher DB, Barnham KJ, Cappai R, Beyreuther K, Masters CL, Parker MW, et al. Crystallization and preliminary X-ray diffraction analysis of the Fab fragment of WO2, an antibody specific for the Abeta peptides associated with Alzheimer’s disease. Acta Crystallogr, Sect F: Struct Biol Cryst Commun. 2008;64:438–441. doi: 10.1107/S1744309108011718. [DOI] [PMC free article] [PubMed] [Google Scholar]
- 47.Brandt JP, Patapoff TW, Aragon SR. Construction, MD simulation, and hydrodynamic validation of an all-atom model of a monoclonal IgG antibody. Biophys J. 2010;99:905–913. doi: 10.1016/j.bpj.2010.05.003. [DOI] [PMC free article] [PubMed] [Google Scholar]
- 48.Taratuta VG, Holschbach A, Thurston GM, Blankschtein D, Benedek GB. Liquid–liquid phase separation of aqueous lysozyme solutions: Effects of pH and salt identity. J Phys Chem. 1990;94:2140–2144. [Google Scholar]
- 49.Broide ML, Berland CR, Pande J, Ogun OO, Benedek GB. Binary–liquid phase separation of lens protein solutions. Proc Natl Acad Sci U S A. 1991;88:5660–5664. doi: 10.1073/pnas.88.13.5660. [DOI] [PMC free article] [PubMed] [Google Scholar]
- 50.Nishi H, Miyajima M, Nakagami H, Noda M, Uchiyama S, Fukui K. Phase separation of an IgG1 antibody solution under low ionic strength condition. Pharm Res. 2010;27:1348–1360. doi: 10.1007/s11095-010-0125-7. [DOI] [PubMed] [Google Scholar]
- 51.George A, Wilson WW. Predicting protein crystallization from a dilute–solution property. Acta Crystallogr, Sect D: Biol Crystallogr. 1994;50:361–365. doi: 10.1107/S0907444994001216. [DOI] [PubMed] [Google Scholar]
- 52.Neal BL, Asthagiri D, Velev OD, Lenhoff AM, Kaler EW. Why is the osmotic second virial coefficient related to protein crystallization? J Cryst Growth. 1999;196:377–387. [Google Scholar]
- 53.Bonneté F, Finet S, Tardieu A. Second virial coefficient: Variations with crystallization conditions. J Cryst Growth. 1999;196:403–414. [Google Scholar]
- 54.Vliegenthart GA, Lekkerkerker HNW. Predicting the gas-liquid critical point from the second virial coefficient. J Chem Phys. 2000;112:5364–5369. [Google Scholar]
- 55.Ruppert S, Sandler SI, Lenhoff AM. Correlation between the osmotic second virial coefficient and the solubility of proteins. Biotechnol Prog. 2001;17:182–187. doi: 10.1021/bp0001314. [DOI] [PubMed] [Google Scholar]
- 56.McMillan WG, Mayer JE. The statistical thermodynamics of multicomponent systems. J Chem Phys. 1945;13:276–305. [Google Scholar]
- 57.Lewus RA, Levy NE, Lenhoff AM, Sandler SI. A comparative study of monoclonal antibodies. 1. Phase behavior and protein–protein interactions. Biotechnol Prog. 2015;31:268–276. doi: 10.1002/btpr.2011. [DOI] [PMC free article] [PubMed] [Google Scholar]
- 58.Haas C, Drenth J. The protein–water phase diagram and the growth of protein crystals from aqueous solution. J Phys Chem B. 1998;102:4226–4232. [Google Scholar]
- 59.Calero-Rubio C, Saluja A, Roberts CJ. Coarse–grained antibody models for “weak” protein –protein interactions from low to high concentrations. J Phys Chem B. 2016;120:6592–6605. doi: 10.1021/acs.jpcb.6b04907. [DOI] [PubMed] [Google Scholar]
- 60.Kalyuzhnyi YV, Vlachy V. Explicit–water theory for the salt–specific effects and Hofmeister series in protein solutions. J Chem Phys. 2016;144:215101. doi: 10.1063/1.4953067. [DOI] [PMC free article] [PubMed] [Google Scholar]
Associated Data
This section collects any data citations, data availability statements, or supplementary materials included in this article.


