Abstract
Dynamic gadoxetic-acid enhanced magnetic resonance imaging (MRI) allows investigation of liver function through observation of the perfusion and uptake of contrast agent in the parenchyma. Voxel-by voxel quantification of contrast uptake rate (k1) from dynamic gadoxetic-acid enhanced MRI through the standard dual-input two-compartment model could be susceptible to over fitting variance in the data. The aim of this study is to develop a linearized but more robust model. To evaluate estimated k1 values using this linearized analysis, high temporal resolution gadoxetic- acid enhanced MRI scans were obtained in 13 exams, and k1 maps were created using both the models. Comparison of liver k1 values estimated from the two methods produced a median correlation coefficient of 0.91 across the 12 scans that could be used. Temporally sparse clinical MRI data with gadoxetic acid uptake were also used to create k1 maps of 27 exams using the linearized model. Of 20 scans, the created k1 maps were compared to overall liver function as measured by indocyanine green (ICG) retention, and yielded a correlation coefficient of 0.72. In the 27 k1 maps created via the linearized model the mean liver k1 value was 3.93 ±1.79 mL/100mL/min, consistent with prior studies. The results indicate that the linearized model provides a simple and robust method for assessing the rate of contrast uptake that can be applied to both high-temporal resolution dynamic contrast enhanced MRI and typical clinical multi-phase MRI data and that correlates well with both the results of two-compartment analysis and independent whole liver function measures.
Graphical Abstract
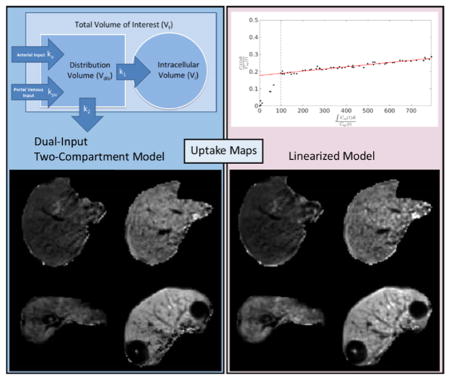
This study used the uptake of gadoxetic acid contrast into the hepatocytes as a means of quantifying liver function. A linearized form of the dual-input two-compartment model was developed to estimate the uptake robustly and efficiently. The resulting function maps were compared to the full dual-input two-compartment model, and to whole liver function quantified via indocyanine green.
1. Introduction
Regional and global liver function measures are critical for guiding treatments for intrahepatic cancers, including surgical resection, radiofrequency or microwave ablation, and radiation therapy, to preserve liver function and prevent organ failure1. Mapping both baseline regional liver function, and early change after liver-directed therapy is critical to predict permanent treatment effects on liver function and reduce the probability of liver failure after intervention. Further, accurate liver function mapping could allow for precise customization of treatment planning that carefully accounts for present and future regional liver function2,3.
Various methods currently exist for determining regional liver function. Positron emission tomography (PET) and single positron emission computed tomography (SPECT), with radioactive hepatobiliary tracers, have been developed for direct measurement of regional liver function3–5. MRI-based methods benefit from both superior resolution and the absence of a radiation dose during the assessment scans. Using dynamic contrast enhanced (DCE) MRI with vascular contrast agents, perfusion parameters have been calculated from a dual-input single-compartment model of the liver, in which portal venous perfusion was considered as a surrogate for liver function6. However, use of a hepatobiliary contrast agent allows direct assessment of liver function through contrast uptake in liver parenchyma. Gadoxetic acid, marketed in the United States as Eovist, and as Primovist in Europe, is a hepatobiliary MRI contrast agent7. It is distinguished from vascular agents in that it is taken up into the liver cells, allowing more direct interrogation of liver function. Using this agent, hepatic extraction fraction (HEF) can be estimated to assess liver function. While HEF is directly related to uptake rate, it cannot isolate uptake rate from the effects of plasma flow. Semi-quantitative measures such as relative enhancement (RE) and enhancement relative to spleen similarly cannot differentiate between uptake rate and plasma flow, while additionally either ignoring fluid enhancement or assuming its uniform conformity to fluid enhancement in the spleen8. A dual-input two-compartment model of liver function can be used to directly estimate the uptake rate, but the model requires high temporal resolution images to adequately characterize the concentration curves used as inputs, can have as many as 6 unknown parameters, and may be susceptible to over fitting variance in the data 9.
This study develops and applies a linear model based on the dual-input two compartment model of liver function. Ideally, this model can be used to estimate both flow dependent and independent measures of liver function with decreased computational complexity and susceptibility to variance as compared to the dual-input two-compartment model. To this end we compare the results of the developed model to the dual-input two-compartment model as applied to high-temporal resolution gadoxetic-acid enhanced MRI data, and to indocyanine green (ICG) retention in livers with corresponding clinical temporally-sparse MRI data. Through simulations we also assess the impact of failure to capture the peak of the arterial input function on the estimate of uptake. This allows us to confirm the correspondence of our approach to the two-compartment model for liver function, and to an independent and reliable measure of whole liver function found in the extraction by the liver of ICG10, while confirming the applicability to low temporal resolution clinical datasets.
2. Methods and Materials
2.1 Dual-Input Two-Compartment Model
2.1.1 Model Description
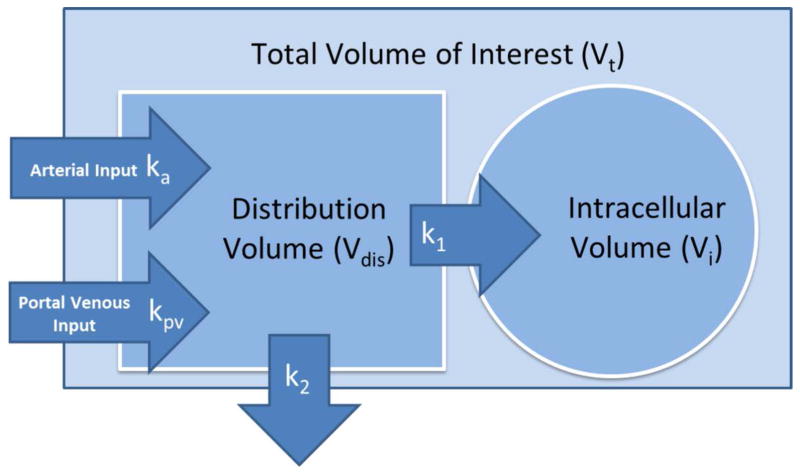
The dual-input two-compartment (DITC) pharmacokinetic (PK) model of gadoxetic acid in the liver9 is illustrated in figure 1. This model describes the hemodynamics of gadoxetic acid (hepatic arterial and portal venous perfusion), and contrast uptake of hepatocytes. In this model, after injection of a bolus of gadoxetic acid, the contrast circulates in the blood by flowing in from both hepatic artery and portal vein into the sinusoids, distributing in the space of Disse and flowing out through the central and hepatic veins. This assumes fast exchange between the sinusoids and the space of Disse. Meanwhile, hepatocytes take up the contrast through the sinusoid membrane. The contrast uptake of hepatocytes is assumed to be unilateral, by omitting the minor efflux of the contrast back to sinusoids in the initial retention period11. This model also omits the slow and delayed excretion process.
Figure 1.
A dual-input two-compartment pharmacokinetic model of gadoxetic acid in the liver.
If we consider a voxel or a volume of interest with a total volume of Vt, the total amount of contrast in the voxel is a sum of the amounts of contrast in the extracellular and intracellular spaces, and can be described by the following equations:
| (1) |
| (2) |
where Vdis is the distribution volume of blood; Ct, Cdis, Ca, and Cpv are contrast concentrations as a function of time in the respective total, distribution, arterial, and portal vein volumes; τa and τpv describe respective arrival time delays of the arterial and portal vein input functions at each voxel; ka and kpv describe the normalized arterial and portal venous flow rates, and k2 is the normalized flow rate leaving the volume of interest through the central vein. k1 is the normalized rate of uptake of contrast to the intracellular space. The distribution volume includes the Space of Disse and sinusoids. We also define a fractional distribution volume of . The derivation and a detailed description of equations are given in the appendix.
Ct, Ca, and Cpv are measurable from the intensity of dynamic contrast enhanced MRI at regions or voxels of hepatic tissue, artery, and portal vein respectively. As a result, equations (1) and (2) have 6 unknown variables (ka, kpv, τa, τpv, k1 and vdis) to be determined.
2.1.2 Optimization
To determine the 6 unknown variables in equations (1) and (2), the cost function
| (3) |
is optimized. Here Ĉt is the estimate of Ct given by the model in equation (1) with guessed values of ka, kpv, τa, τpv, k1 and vdis during the optimization process. T is the temporal interval between time points and Nt is the total number of time points in the DCE curves. This study used the Nelder Mead Simplex algorithm to perform the optimization.
2.2 Linear single-input two-compartment model
2.2.1 Rationale
Since fitting the DITC PK model requires the optimization of 6 parameters, it is susceptible to overfitting of variations due to noise, and also is time consuming when fitting a long dynamic series of data in the whole liver. Estimating k1 (the contrast uptake rate of hepatocytes) requires a long time period of observation of the contrast accumulation in hepatocytes. The hemodynamic changes after the initial transient time following the contrast bolus injection become slow. This offers an opportunity to solve the problem in a different manner, producing a computationally simpler problem and, ideally, reducing susceptibility to variation. Assumptions used in the derivation and formula are described in the following subsections
2.2.2 Assumptions & Formulation
The change in the total amount of contrast in the distribution volume in a voxel is:
| (4) |
which is equation (2) in the derivative form. Given the long acquisition period for observation of gadoxetic-acid uptake in hepatocytes, after a few circulations of the contrast bolus in the blood (t > tp), the contrast concentration in the portal vein blood is eventually equal to that in the arterial blood, Ca(t) = Cpv(t). Under this condition, equation (4) can be re-written as:
| (5) |
where kt = (ka+kpv) = (1-Hct)k2, the normalized total blood flow rate in Vt, and Hct is hematocrit. Equation (5) can be re-arranged as:
| (6) |
Substituting Cdis in equation (6) into the second term in equation (6), equation (6) can be further re-written as:
| (7) |
where the first term depends upon Ca, the second term depends upon the first derivative of Ca, the third term depends upon the second derivative of Ca, and so on. If the second derivative of Ca is small enough to be neglected, substituting equation (7) into equation (1) and re-arranging the terms, we have:
| (8) |
Equation (8) can be considered as the linear problem y = ax1 +bx2 +cx3, where y = (1 − Hct)Ct(t), and . A linear least squares (LLS) fit can estimate coefficients of a, b and c. k1, k2 and vdis can be solved from the coefficients (see appendix B).
If the second term (related to the first derivative of Ca) in equation (7) can be neglected, we have:
| (9) |
Again, equation (9) is a linear problem, y = ax1+bx2, where y = (1 − Hct)Ct(t), and , which can be solved by LLS fitting. In this case, . Note that there is no assumption made relating to k1 and k2; and but k2 and vdis cannot be solved. Also, equation (9) can be re-arranged to be:
| (10) |
which is a form of the Patlak analysis12. Note that k1 can be calculated by slope/intercept, and is not affected by the relationship between k1 and k2, which is different from the Patlak analysis. The intercept in the Patlak analysis is called veff and is usually greater than the true blood distribution volume. The intercept in our case, , is smaller than vdis. However, if we assumed that k2≫k1, vdis can be estimated by the intercept. Note that we only used the assumptions:Ca(t) = Cpv(t) and that there is slow contrast change in the blood after t > tp, to derive these equations. We will call it the linearized single-input two-compartment (LSITC) model hereafter.
2.2.3 Optimization
Optimization of equation (10) involves first computing the vector x and the set of vectors y (one for each voxel). Additionally, tp (or xp corresponding to tp) needs to be determined. Based on the assumptions of the model, x and y will be linearly related after xp, suggesting a linearity test is needed. If it is assumed that xp is relatively consistent throughout the liver a single test can be performed, reducing noise effects and saving computation time.
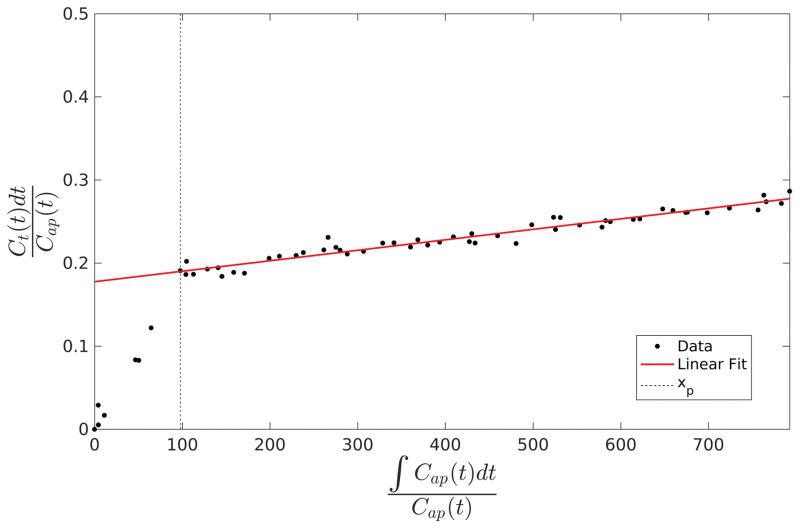
To obtain xp, the vectors y are averaged over all voxels within the liver to form a single vector. The two singular values of the centered data matrix [x y] after the tested xp are acquired by the singular value decomposition. The tested xp is varied within a time interval between the arterial peak and 2 min before the last data point. The ratio of the first singular value to the second is calculated to determine the linearity of the relationship. xp is then chosen to maximize this ratio. Figure 2 illustrates the behavior of the y vector before and after xp in a region of interest. However, in cases with sparse temporal sampling the process can be simplified by setting tp based on the DCE data with high temporal sampling.
Figure 2.
An example of the relationship between the vectors y and x in equation (10) from a volume of interest in the liver. Note that the linear assumptions of the model only bear out after the transition point xp.
After selection of xp total least squares regression is performed for each voxel using the data after xp to minimize the impact of errors in both x and y. The slope of the resulting fit is divided by the intercept to determine the value of k1 in the voxel. In cases where the intercept is less than 0.02, k1 is set to zero to prevent values from blowing up. This is also justified in that a low intercept, corresponding to a sufficiently low vdis will effectively preclude meaningful levels of uptake in the voxel.
2.3 Evaluation
This study evaluates the performance of the LSITC model, with reference to the results of 6 parameter optimization of the established DITC model, simulated data based on the DITC model, global liver function assessment through indocyanine green (ICG) retention in the plasma, and a comparison to literature values.
2.3.1 Data Acquisition
In order to compare the results of the proposed LSITC model with the DITC model, 3D volumetric DCE MRI of the liver were acquired during the intravenous injection of a single standard dose of gadoxetic acid using a Golden-Angle Radial sampling VIBE sequence on a 3T scanner (Skyra, Siemens Healthineer) in a prospective protocol approved by University of Michigan Institutional Review Board. A total of 14 exams from 13 patients with intrahepatic cancers prior to radiation therapy were acquired during free breathing. Demographic, pathological, and clinical Child Pugh scores of this group of patients (called Group 1) are provided in table 1. Note that 54% of the patients had Child Pugh scores of 5, indicating good liver function. In this group of the patients, 3D DCE images were acquired with temporal resolutions of 3.5 to 10 seconds and total acquisition times of 4 to 24 minutes, and covered the whole liver with 64 to 72 slices with slice thicknesses of 2.6 to 4.5 mm and in-plane resolution of 2.1×2.1 mm to 2.4×2.4 mm (192×192 pixels). These scans will be referred to as high temporal resolution (HTR) scans. The high temporal resolution scans could be fitted to both the DITC model and the LSITC model, allowing comparison of the results obtained from the two methods.
Table 1.
The demographic, pathological, and clinical Child Pugh scores for the patient groups used.
| Characteristic | Group 1 (HTR) n=13 |
Group 2 (LTR) n=19 |
Total n=32 |
|---|---|---|---|
| Median Age (range) | 60.7 (56.5 – 72.0) | 61.1 (52.7 – 78.9) | 61.0 (52.7 – 78.9) |
|
| |||
| Gender | |||
|
| |||
| Male | 10 (77%) | 14 (74%) | 24 (75%) |
| Female | 3 (23%) | 5 (26%) | 8 (25%) |
|
| |||
| Cirrhosis | |||
|
| |||
| Positive | 8 (62%) | 16 (84%) | 24 (75%) |
| Negative | 5 (38%) | 3 (16%) | 8 (25%) |
|
| |||
| Histology | |||
|
| |||
| Hepatocellular carcinoma | 9 (69%) | 18 (95%) | 27 (84%) |
| Adenocarcinoma | 2 (15%) | 1 (5%) | 3 (9%) |
| Intrahepatic cholangiocarcinoma | 1 (8%) | 0 (0%) | 1 (3%) |
| Solitary fibrous tissue | 1 (8%) | 0 (0%) | 1 (3%) |
|
| |||
| Baseline Child Pugh | |||
|
| |||
| 5 | 7 (54%) | 5 (26%) | 12 (38%) |
| 6 | 4 (31%) | 7 (37%) | 11 (34%) |
| 7 | 0 (0%) | 5 (26%) | 5 (16%) |
| 8 | 1 (8%) | 1 (5%) | 1 (3%) |
| 9 | 1 (8%) | 0 (0%) | 1 (3%) |
| Missing | 0 (0%) | 1 (5%) | 1 (3%) |
In addition, the proposed LSITC model was applied to clinical multi-phase MRI with gadoxetic acid in 19 patients, which was approved by a retrospective protocol of University of Michigan Cancer Center. Demographic, pathological, and clinical Child Pugh scores of this second group of patients are provided in table 1. Pre- and post-RT scans were acquired from 19 patients, for a total of 40 scans. Each patient had been diagnosed with HCC. The scans were comprised of 3D volumetric multi-phase MRI of the liver during the intravenous injection of a single standard dose of gadoxetic acid on either a 1.5 T GE or a 1.5T Philips scanner. Each exam consisted of a pre-contrast volume, three-phase (arterial and portal vein phases) volumes that were each spaced approximately 20 seconds apart, and hepatobiliary phase volumes at approximately 10 and 20 minutes post contrast, for a total of 6 time points. Each acquisition was obtained during a breath hold. 3D MRI had 88 to 124 slices per volume with 256×256 pixels to 512×512 pixels in the plane. The pixel size varied from 0.7×0.7 mm to 1.4×1.4 mm within each slice, with the slice thickness consistently 2 mm. These scans will be referred to as low temporal resolution (LTR) scans. However, due to changes in flip angle between phases in the scan (particularly in the late phases) and image quality issues, the set of usable scans was only 27 of the original 40. ICG retention exams were carried out near the time of the scan for 20 of the 27 scans, without RT or any other treatment having taken place in the meantime. The ICG retention score as a quantitative overall liver function assessment was measured as the percentage of the original ICG dose remaining 15 minutes after injection, as described previously10, with higher plasma retention signifying poorer liver function. The patients in this second group had a median baseline ICG retention of 37.2%, with minimum and maximum retention scores of 9.8% and 50.2%.
2.3.2 Image pre-processing
For the clinical LTR multi-phase images, interpolation was carried out on the image volumes that had different spatial resolutions between the volumes. All 3D multi-phase LTR MRI volumes in an exam were co-registered using a robust, over-determined image registration method13. For all volumes the aorta was contoured from the aortic split to the liver up 3 cm. The 100 voxels within this region that had the highest contrast just before the arterial concentration peak were averaged to form the arterial input function (AIF). For the HTR DCE data, the portal vein was also contoured and selected by the same process to obtain the portal vein input function (PVIF). In both cases relative enhancement was used to create the input functions:
| (13) |
where C(iT) describes the relevant concentration at time point i, given a sampling interval of T, and SIi and SIprecontrast are the average signal intensities in the given region of interest at time point i, and prior to contrast enhancement respectively. The same calculation was performed for each voxel in the liver.
2.3.3 Evaluation metrics
k1 maps were obtained from the HTR DCE series using both the established DITC model and the proposed LSITC model. The k1 maps obtained from the DITC approach were used as a reference standard in the evaluation of the LSITC approach.
The first evaluation was to assess the similarity and deviation between the two resulting k1 maps within the liver. The similarity was tested by the linear correlation coefficient between the two k1 maps. The deviation was evaluated by the weighted mean absolute percent error (WMAPE), where we define the voxel-wise weighted absolute percent error (WAPE) as
| (14) |
Where i and n are voxel indices, and N is the total number of voxels considered. It should be noted that this metric places higher weight on accuracy for larger measurements. In this case the DITC model uptake rates are the reference values.
The second evaluation was to assess the validity of the LSITC model as applied to the clinical multi-phase LTR MRI data. Due to the low temporal resolution of approximately 20 seconds, the arterial input function peak could be missed or averaged over 20-second sampling. The sampling of the arterial peak affects the integral of the arterial input function in equation (10). Considering that the integral is over a long time period of 10 to 20 minutes, the effect of the arterial peak on the k1 estimation could be small. To evaluate it, a tissue concentration curve with a temporal resolution of 1/s was simulated by direct application of the DITC model, subject to the input of reasonable parameter values and blood concentration curves. To mimic the LTR multi-phase MRI data, a subsampled curve was created by removing all points after the 1st pre contrast point and prior to the peak of the arterial input function. This curve was used to assess the error inherent in neglecting to sample the upswing in the arterial function, even when the image was perfectly timed to correspond to the peak. In order to evaluate the additional bias incurred by mistiming the peak, an additional concentration curve was created by removing all post-contrast data until 20 seconds after the arterial peak. This mimics a 20-second delay in the ideal time to image the arterial peak. For each of these three cases, the primary metrics were the correlation coefficients and WMAPE. The error in the k1 estimation could represent an upper bound on the error incurred by missing the arterial peak, since acquisition delays longer than this would be easily visually recognizable.
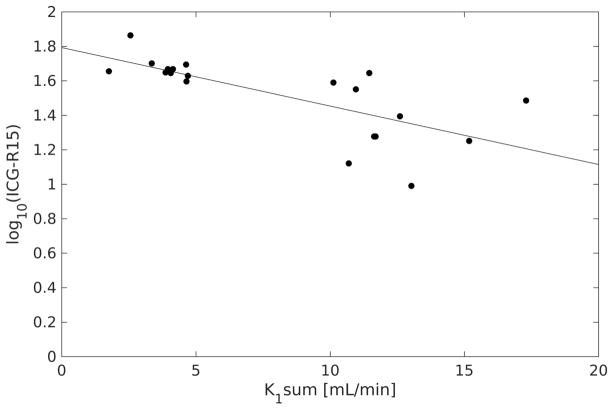
The third assessment involved the application of the LSITC approach to the clinical multi-phase MRI data and comparison to global liver function as measured by the ICG retention rates. These clinical scans were much sparser temporally than those seen in the HTR DCE scans and so fitting with the full DITC model was impractical. The metric for evaluation was the correlation coefficient between the sum of the estimated K1 values over the contoured liver volume by the LSITC approach and the log of the ICG retention score, where K1 = k1Vdis. In the sum of K1 over the whole contoured liver volume, outliers having K1 values above the 95th or below the 5th percentiles were rejected to remove edge effects. Additionally, large vessels were excluded by rejecting voxels where vdis was greater than 0.4. The inclusion of the volume term ensures both uptake rate and plasma flow are accounted for. The summation of a regional measure of liver function to allow comparison to a global function such as ICG is not new.14
The final assessment involved comparison of the k1 values obtained in the HTR DCE, and LTR multi-phase MRI data sets to reported values of k1 in the liver from prior studies.
3. Results
3.1 k1 estimations by the LSITC model vs. DITC model
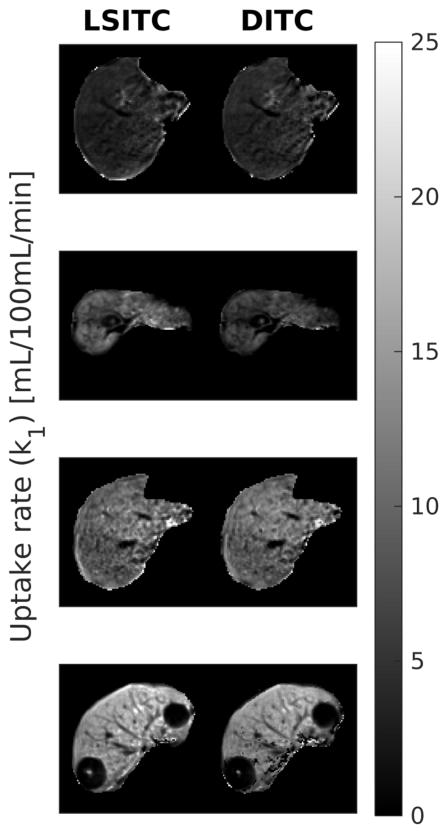
Maps of k1 values estimated from the liver HTR DCE scans using both the LSITC and DITC models are shown in figure 3.
Figure 3.
Example slices of the k1 maps estimated from the HTR DCE scans of four patients by the linearized single-input two-compartment model (left) and dual-input two-compartment model (right). Note that the units are mL/100mL/min.
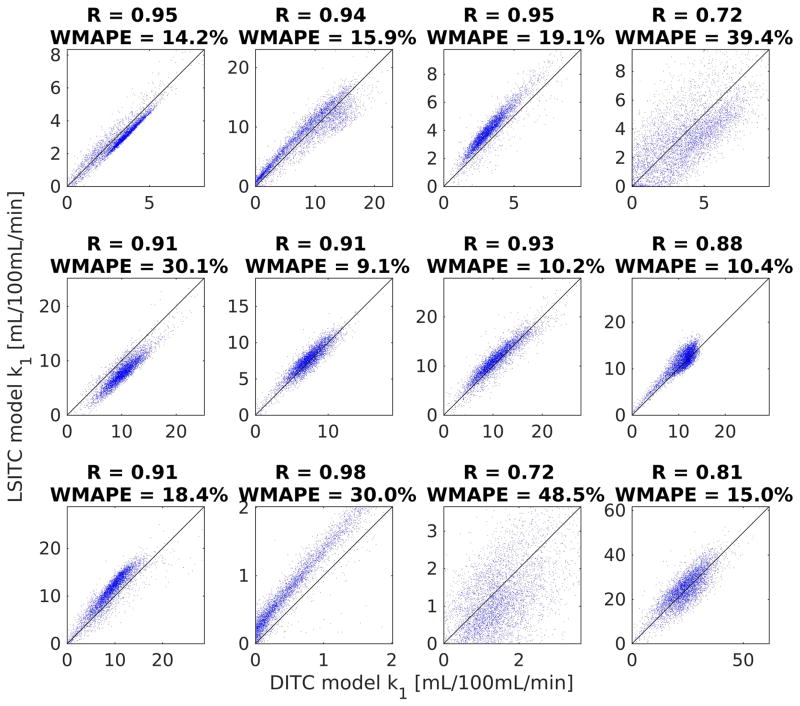
The linear correlations between the k1 maps estimated by the two models are shown in figure 4. The correlation was calculated in a randomly selected 5000 voxels within each liver, restricted to the voxels where vdis was above the 25th and below the 75th percentiles, and the k1 values were greater than 0.01 mL/100mL/min. (In one patient who was a candidate for the liver transplant and had very poor liver function, there was a small volume in the liver that had the non-zero k1 values, leaving little volume for analysis. Thus, this patient was excluded from the analysis described here). The correlation coefficients ranged from 0.98 to 0.76 with a median of 0.91. The WMAPEs ranged from 9.0% to 39.4% with a median of 17.2%. Note that either estimate can be considered as the ground truth.
Figure 4.
Scatter plot of the k1 values estimated by the two models for the 8 patients. The k1 values in the horizontal axis were estimated from the dual-input 2-compartment model and the ones in the vertical axis from the linearized single-input two-compartment model.
The estimated transition times (tp) when the varied from 10 to 313 seconds as measured from the peak of the arterial input function, with a median value of 58 seconds. The computation speed of the LSITC approach was approximately 1000 times faster than the dual-input two-compartment model, taking a few seconds per exam while the DITC model fitting took several hours per exam.
3.2 k1 estimation by simulation of missing the arterial peak
To simulate DCE data, composite input curves were first created by averaging the respective AIF and PVIF after matching the arterial peaks and re-sampling the time curves from all patients. The composite functions converged approximately 75 seconds after the arterial peak. To reduce noise the input data at least 5 min subsequent to the arterial peak was replaced by a double exponential fit.
Simulated parameters were randomly chosen but uniformly distributed over the ranges shown in table 2, while τa and τpv were assumed to be 0 seconds. Using these values and the composite input concentration curves (AIF and PVIF), the resulting tissue concentration curves were calculated using the dual-input two-compartment model.
Table 2.
The ranges of the parameter values for the simulation, where kpvp = kpv(1-Hct) and kap = ka(1-Hct).
| Parameter | Minimum Value | Maximum value | |
|---|---|---|---|
| vdis | 10 | 20 | % |
| kpvp+ kap | 50 | 300 | mL/100mL/min |
| kpvp | 0.5(kpvp+ kap) | (kpvp+ kap) | mL/100mL/min |
| k1 | 0 | 0.1(kpvp+ kap) | mL/100mL/min |
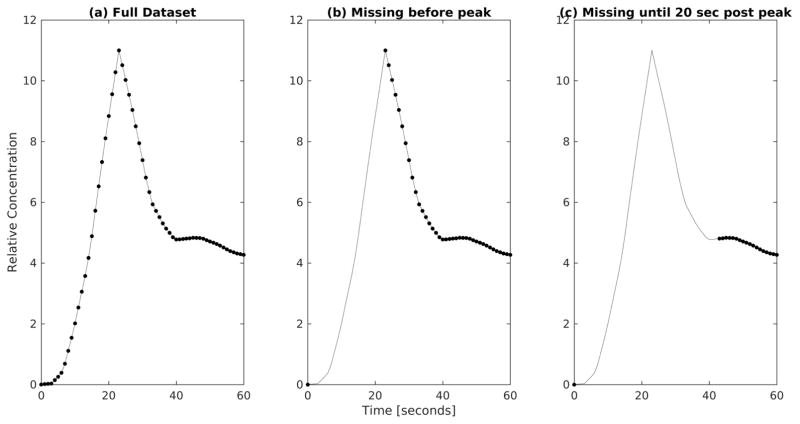
To assess the potential error and variance incurred by missing the arterial peak during the clinical multi-phase MRI scan, the resulting tissue and arterial functions (figure 5a) were then subsampled to remove all points prior to the arterial peak, apart from one pre contrast reference scan (figure 5b). Furthermore, the data points acquired 20 seconds after the arterial peak (including the peak) were removed from the simulated curve and AIF to mimic a possible further delayed acquisition in the clinical data (figure 5c).
Figure 5.
Early section of the AIFs to demonstrate subsampling used to investigate delays in acquisition. a) shows an AIF with the full dataset, b) shows an AIF with missing data points prior to the arterial peak, and c) shows an AIF with missing data points up to 20 seconds after the arterial peak.
For each scenario tp was assumed to be 60 seconds post peak. The simulation was run 10,000 times per case. A strong correlation was found between the LSITC results and input simulation values. Without noise, correlation coefficients remained above 0.99 for all three cases including the case with an acquisition delay of 20 seconds after the arterial peak.
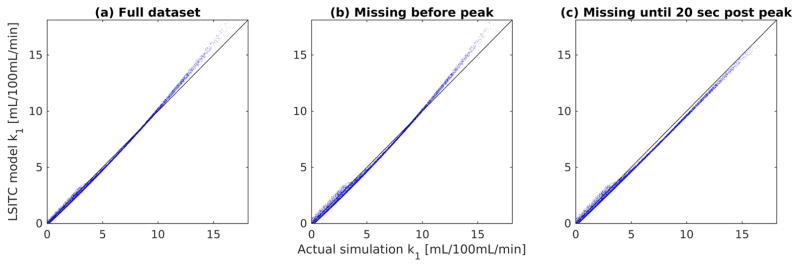
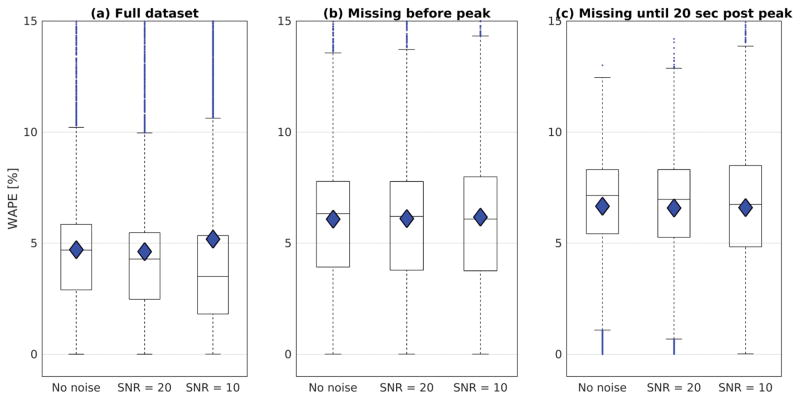
Results showed similar distributions for estimates of k1, regardless of the acquisition delay (see figure 6 and figure 7). The WAPE in the noise free simulations was 4.7 ± 3.2% (mean ± standard deviation) for the full dataset, and then shifted to 6.1 ± 3.6% for the data missing time points before the arterial peak and to 6.7 ± 2.4% for the data missing time points up to 20 s after the arterial peak. The WAPE changed little when introducing white Gaussian noise to the generated Ct functions. Note that missing the early time points in the dynamic curves caused a maximum change in the WAPE of 2% (from 4.7% to 6.7% without noise), suggesting other effects predominate in the k1 estimation errors. Based on these results we would expect similar levels of systematic error resulting from delayed or averaged capture of the arterial peak in the LTR multi-phase data.
Figure 6.
Plots of the input k1 values against the k1 values obtained by LSITC model. The correlation coefficient was R = 0.999, 0,998 and 0.999 for the full dataset (a), the dataset missing time points prior to the arterial peak (b), and the dataset missing time points up to 20 seconds after the arterial peak (c) respectively.
Figure 7.
Boxplots for the WAPE in the LSITC model results relative to the simulated values at 3 noise levels for the three simulated datasets: a) the full dataset, b) the dataset missing data points prior to the arterial peak, and c) the dataset missing data points up to 20 seconds after the arterial peak. The median values are indicated by the horizontal line, the mean is indicated by the diamond, and error bars are 1.5 times the interquartile range.
3.3 k1 estimation from the clinical MRI and comparison with ICG retention
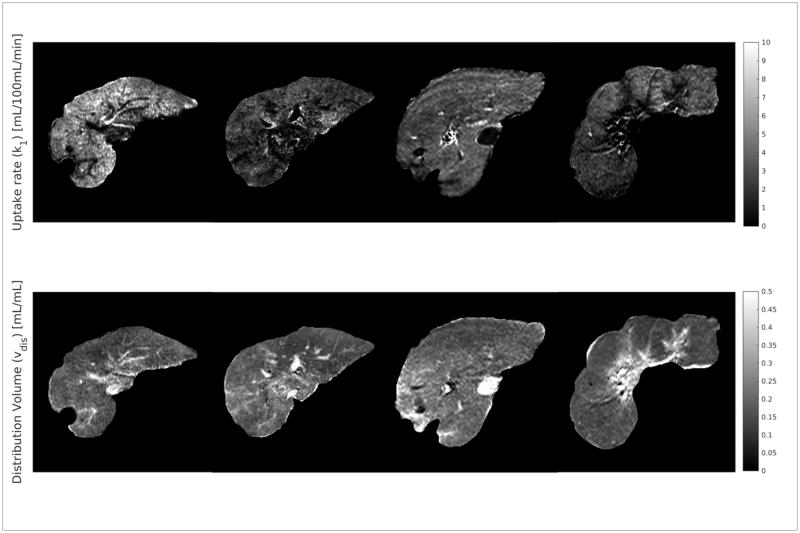
Maps of k1 and vdis were estimated from the clinical LTR multi-phase MRI of 27 exams using the LSITC model. Example k1 and vdis maps are shown in figure 8. For the 20 clinical scans with accompanying ICG retention scores, the scores were compared to the K1 values (K1 = k1Vdis) summed over the contoured liver volume (figure 9). Voxels with vdis greater than 0.4 were rejected to omit vasculature, and K1 values less than the 5th or greater than the 95th percentile were rejected to avoid outliers and edge effects. Since the log of ICG retention is inversely proportional to the rate of clearance in the liver, a linear relationship is expected. The sum of K1 values were significantly correlated to the log of ICG retention values with a correlation coefficient of R = −0.72 (p=0.0004, n = 20).
Figure 8.
Example maps of k1 and vdis in the assessed livers. Notice that high values of vdis can be seen to correspond to vasculature.
Figure 9.
Plot of the log of ICG retention at 15 minutes against the sum of K1 values in the contoured total liver volume. R = −0.72 (p = 0.0004, n = 20).
3.4 Comparison to Literature values
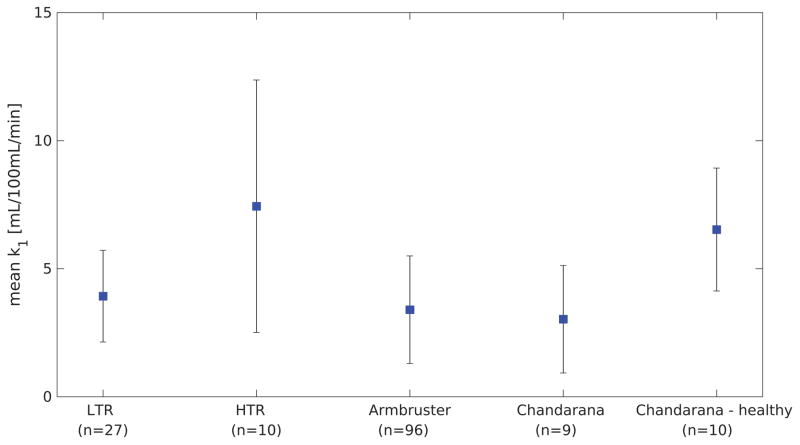
Maps of k1 values were generated for the 27 multi-phase LTR liver scans by the LSITC model. In each of the 27 k1 maps the mean value was calculated over the volume with vdis less than 0.4 and with k1 values in the central 90th percentile of k1 value for the liver. The mean value across all multi-phase LTR scans was 3.93 ±1.79 mL/100mL/min. Using the same process for the HTR DCE based maps the mean uptake was measured as 9.17 ± 8.23 mL/100mL/min, across all HTR DCE scans, and 7.44 ± 4.93 mL/100mL/min after removal of an outlier more than twice as large as any other mean uptake. It should be noted that the outlier was also the scan with the shortest total duration.
This is fairly consistent with the prior literature. Previous studies have found mean uptake rates of 3.4 ± 2.1 in background regions of livers with metastases, 3.03 ± 2.1 in cirrhotic livers, and 6.53 ± 2.4 in healthy livers, as seen in figure 1015,16.
Figure 10.
This plot shows the mean values obtained in several studies for background liver uptake rate of gadoxetic acid in cancerous livers, and a group of healthy livers for reference. Error bars indicate the standard deviation. The HTR values are based on a removed outlier.
4. Discussion
This study developed a LSITC model to quantify k1 from dynamic gadoxetic acid enhanced MRI in the liver, and evaluated the results by comparisons to an established uptake model, and measure of whole liver function. The k1 values estimated by the LSITC and DITC analysis of the HTR DCE MRI data had a close median correlation (R = 0.91). Application of the LSITC approach to LTR multi-phase MRI data gave similar results to prior studies and correlated relatively well (R = −0.72) with the results of ICG retention exams. Furthermore, concerns about the impact of delayed imaging of the arterial peak were addressed by simulations showing less than 3% related error. The results indicate that the LSITC model is a simple analog to the dual-input two-compartment model, and correlates well with independent scores of liver function. Since this technique can be applied to clinically typical multi-phase data, it presents the possibility of quantitative liver assessment without large changes to existing clinical workflow.
There are several possible sources of error in the determination of k1 via the LSITC model set forth here. It should first be noted that unlike the Patlak model, the ratio of k1 to k2 should not impact the estimate of k1, since the k2 dependent term cancels in equation (10) when dividing slope by intercept. However, this term will impact the estimate of vdis and K1, with both underestimated. This also suggests a more complete linear model where equation (8) is fit to determine k1, k2 and vdis, allowing a more accurate estimate of K1 (see appendix B).
The model assumes that after tp, Cpv = Ca. In most of the measured input curves Ca and Cpv were very similar within less than a minute of the arterial peak. In some cases this held true after a constant correction factor, i.e. Cpv × constant = Ca. This could reflect differences in Hct between Ca and Cpv. In quantification of Ca and Cpv, native T1 of plasma was not considered since images for T1 quantification are almost never acquired in clinical liver scans. However, native T1 of plasma should be the same for Ca and Cpv. This omission should not contribute to the difference between Ca and Cpv. In general, it is anticipated that the peak of Cpv is shallower and broader than that of Ca, since the bolus of contrast travels through the vascular systems of intestines and spleen before it slowly returns to the portal vein through the mesenteric vein and splenic vein. In some patients, this contrast return seems to be slower than in others. This could be a factor contributing to difference between Ca and Cpv even after the typical time tp. However, partial volume effects and motion could also affect the measurement of Cpv, causing apparent differences between Cpv and Ca that do not reflect the actual contrast concentrations. The simplified form of the model also neglects dCa/dt from equation (8). Since dCa/dt will generally be negative, and decreasing in magnitude after tp, we expect this to result in a small overestimate of vdis and k1. The possibility of flow related enhancement causing a mischaracterization of AIF can be considered as well. Selecting the AIF values from an Aorta contour within 3 cm of the aortic split to the liver ensured the blood in the voxels used were far from the edge of the FOV, and had experienced multiple repetitions within the excitation volume. This minimizes the impact of flow related enhancement on the AIF, making this an unlikely source of error in AIF, or cause for differences between AIF and PVIF. The estimate of xp could also impact the final solution. Choosing xp too early would be expected to cause an underestimate of vdis, and an overestimate of k1. In the absence of noise even a very late estimate of xp should have little impact on the result. However, with noise we would expect additional uncertainty in the result as we estimate the slope and intercept from fewer data points.
In the LTR clinical data we assumed the last three points after enhancement were after tp. This was necessary to have an overdetermined solution, but may not have been accurate in some voxels or livers. The time post arterial peak for the first point in the fit varied between 36 and 290 seconds. The median time was 48 seconds. This can be compared to the optimal tp times chosen in the HTR data, which had a median of 65 seconds. It should be noted that the peak in the LTR clinical data was assumed to coincide with the start of the first post contrast image, so it is possible that there is a hidden delay relative to the physiological arterial peak. Another possible source of error is the sparsity of the clinical data which causes an underestimate of the integral of Ca, and thus an underestimate of the values for x. We would expect this error to increase as the timing of the 1st post contrast measurement was delayed past the peak, but the change in error in the simulation was relatively minor, indicating other effects predominate.
Both the LSITC and DITC models omit several notable features. Firstly, the models omit the excretion of contrast from the hepatocytes into the bile. It was assumed that the rate of excretion is negligible over the timeframe of the exams. Deviations from this assumption would cause error in k1 and thus impact the total functional estimate. However, this would not impact the comparison between the two models, or effect error in the simulated case. Secondly, the DITC model includes only one extracellular compartment, which may not be valid in tumors or other pathological tissues where movement between the capillary bed and the space of Disse is relatively slow. This would again impact both models. The impact could be assessed by comparison to a dual-input three compartment model.17
Contrast concentration for all exams was calculated using relative enhancement. Relative enhancement has been found to correlate linearly with the concentration in a given tissue, though this relationship breaks down at sufficiently high contrast concentrations.17 However, even if we assume perfect linearity and that all plasma and all liver voxels had uniform respective native T1 values, the direct use of relative enhancement as relative concentration will introduce a constant bias term in the uptake rate based on the native T1 in plasma relative to liver tissue. This would not impact the correlation with liver function and could be fixed through a correction constant with knowledge of the ratio of native liver and plasma T1. If we further consider differences in native T1 across the liver we would expect additional error even in the relative voxel wise uptake rate. This could be fixed by characterizing the precontrast T1 with an additional sequence before contrast injection. Ideally this would allow for more accurate quantification of concentration, but does introduce clinical inconvenience and complicates analysis.
In all real data; noise, motion and other random variation contributed to error in the input curves, and the tissue curves. Random variation will be especially harmful in cases where relatively few data points are used in the estimate of k1. Motion effects are especially apparent at the edges of the liver and liver vasculature. In these locations slight motion can cause apparent jumps in uptake as a motion artefact.
Further work can be done to improve k1 quantification. For example, the impact of noise and motion could be lessened by the introduction of spatial regularization to the creation of the k1 map. The full model from equation (8) can be used if k2, or vdis are parameters of interest, though it should be noted that the LSITC model cannot replace the DITC model when arterial or portal venous perfusion are parameters of interest. An evaluation of the impact of omission of native T1 on k1 estimation across the population of patients will be conducted. Additional work should also use larger and more varied data sets to further characterize the relationship between liver function and uptake as measured by the LSITC model. Further analysis should also consider tissues in which the DITC model is insufficient and include comparison to a dual-input three compartment model.17
5. Conclusion
This work proposes and validates the LSITC model for assessing liver function based on the uptake rate of gadoxetic acid. Validation was obtained relative to the17 predictions of the accepted dual-input two-compartment model, and independent measurements of whole liver function. The LSITC approach allows the creation of a spatially resolved quantitative image of liver function, using standard clinical acquisitions, and removes the requirement for impractical, high temporal resolution scans.
Supplementary Material
Acknowledgments
This work is supported in part by NIH grants of R01 CA132834 and P01 CA059827. The authors thank Siemens Healthineer for providing the Radial VIBE pulse sequence, and Charles Mayo, Ph.D. for automated Epic data searches.
References
- 1.Johnson PJ, Berhane S, Kagebayashi C, et al. Assessment of liver function in patients with hepatocellular carcinoma: a new evidence-based approach-the ALBI grade. J Clin Oncol. 2015;33(6):550–558. doi: 10.1200/JCO.2014.57.9151. [DOI] [PMC free article] [PubMed] [Google Scholar]
- 2.Wu VW, Epelman MA, Wang H, et al. Optimizing global liver function in radiation therapy treatment planning. Phys Med Biol. 2016;61(17):6465–6484. doi: 10.1088/0031-9155/61/17/6465. [DOI] [PMC free article] [PubMed] [Google Scholar]
- 3.Bennink RJ, Cieslak KP, van Delden OM, et al. Monitoring of Total and Regional Liver Function after SIRT. Front Oncol. 2014:4. doi: 10.3389/fonc.2014.00152. [DOI] [PMC free article] [PubMed] [Google Scholar]
- 4.Wang H, Feng M, Frey KA, Ten Haken RK, Lawrence TS, Cao Y. Predictive Models for Regional Hepatic Function Based upon 99mTc-IDA SPECT and Local Radiation Dose for Physiological Adaptive RT. Int J Radiat Oncol Biol Phys. 2013;86(5):1000–1006. doi: 10.1016/j.ijrobp.2013.04.007. [DOI] [PMC free article] [PubMed] [Google Scholar]
- 5.Sørensen M, Mikkelsen KS, Frisch K, Villadsen GE, Keiding S. Regional metabolic liver function measured by 2-[18F]fluoro-2-deoxy-d-galactose PET/CT in patients with cirrhosis. J Hepatol. 2013;58(6):1119–1124. doi: 10.1016/j.jhep.2013.01.012. [DOI] [PMC free article] [PubMed] [Google Scholar]
- 6.Cao Y, Wang H, Johnson TD, et al. Prediction of Liver Function by Using Magnetic Resonance-based Portal Venous Perfusion Imaging. Int J Radiat Oncol Biol Phys. 2013;85(1):258–263. doi: 10.1016/j.ijrobp.2012.02.037. [DOI] [PMC free article] [PubMed] [Google Scholar]
- 7.Bormann RL, da Rocha EL, Kierzenbaum ML, Pedrassa BC, Torres LR, D’Ippolito G. The role of gadoxetic acid as a paramagnetic contrast medium in the characterization and detection of focal liver lesions: a review. Radiol Bras. 2015;48(1):43–51. doi: 10.1590/0100-3984.2013.1794. [DOI] [PMC free article] [PubMed] [Google Scholar]
- 8.Yamada A. Quantitative Evaluation of Liver Function Within MR Imaging. In: El-Baz AS, Saba L, Suri J, editors. Abdomen and Thoracic Imaging. Springer US; 2014. pp. 233–251. [DOI] [Google Scholar]
- 9.Sourbron S, Sommer WH, Reiser MF, Zech CJ. Combined quantification of liver perfusion and function with dynamic gadoxetic acid-enhanced MR imaging. Radiology. 2012;263(3):874–883. doi: 10.1148/radiol.12110337. [DOI] [PubMed] [Google Scholar]
- 10.Stenmark MH, Cao Y, Wang H, et al. Indocyanine Green for Individualized Assessment of Functional Liver Reserve in Patients Undergoing Liver Radiation Therapy. International Journal of Radiation Oncology • Biology • Physics. 2013;87(2):S26–S27. doi: 10.1016/j.ijrobp.2013.06.073. [DOI] [Google Scholar]
- 11.Van Beers BE, Pastor CM, Hussain HK. Primovist, Eovist: what to expect? J Hepatol. 2012;57(2):421–429. doi: 10.1016/j.jhep.2012.01.031. [DOI] [PubMed] [Google Scholar]
- 12.Patlak CS, Blasberg RG. Graphical Evaluation of Blood-to-Brain Transfer Constants from Multiple-Time Uptake Data. Generalizations. J Cereb Blood Flow Metab. 1985;5(4):584–590. doi: 10.1038/jcbfm.1985.87. [DOI] [PubMed] [Google Scholar]
- 13.Johansson A, Balter J, Feng M, Cao Y. An Overdetermined System of Transform Equations in Support of Robust DCE-MRI Registration with Outlier Rejection. Tomography: A Journal for Imaging Research. 2016;2(3):188–196. doi: 10.18383/j.tom.2016.00145. [DOI] [PMC free article] [PubMed] [Google Scholar]
- 14.Yoneyama T, Fukukura Y, Kamimura K, et al. Efficacy of liver parenchymal enhancement and liver volume to standard liver volume ratio on Gd-EOB-DTPA-enhanced MRI for estimation of liver function. Eur Radiol. 2014;24(4):857–865. doi: 10.1007/s00330-013-3086-5. [DOI] [PubMed] [Google Scholar]
- 15.Chandarana H, Block TK, Ream J, et al. Estimating liver perfusion from free-breathing continuously acquired dynamic gadolinium-ethoxybenzyl-diethylenetriamine pentaacetic acid-enhanced acquisition with compressed sensing reconstruction. Invest Radiol. 2015;50(2):88–94. doi: 10.1097/RLI.0000000000000105. [DOI] [PMC free article] [PubMed] [Google Scholar]
- 16.Armbruster M, Zech CJ, Sourbron S, et al. Diagnostic accuracy of dynamic gadoxetic-acid–enhanced MRI and PET/CT compared in patients with liver metastases from neuroendocrine neoplasms. J Magn Reson Imaging. 2014;40(2):457–466. doi: 10.1002/jmri.24363. [DOI] [PubMed] [Google Scholar]
- 17.Sommer WH, Sourbron S, Huppertz A, Ingrisch M, Reiser MF, Zech CJ. Contrast agents as a biological marker in magnetic resonance imaging of the liver: conventional and new approaches. Abdom Imaging. 2012;37(2):164–179. doi: 10.1007/s00261-011-9734-9. [DOI] [PubMed] [Google Scholar]
Associated Data
This section collects any data citations, data availability statements, or supplementary materials included in this article.


