ABSTRACT
Defining the baseline bacterial microbiome is critical to understanding its relationship with health and disease. In broiler chickens, the core microbiome and its possible relationships with health and disease have been difficult to define, due to high variability between birds and flocks. Presented here are data from a large, comprehensive microbiota-based study in commercial broilers. The primary goals of this study included understanding what constitutes the core bacterial microbiota in the broiler gastrointestinal, respiratory, and barn environments; how these core players change across age, geography, and time; and which bacterial taxa correlate with enhanced bird performance in antibiotic-free flocks. Using 2,309 samples from 37 different commercial flocks within a vertically integrated broiler system and metadata from these and an additional 512 flocks within that system, the baseline bacterial microbiota was defined using 16S rRNA gene sequencing. The effects of age, sample type, flock, and successive flock cycles were compared, and results indicate a consistent, predictable, age-dependent bacterial microbiota, irrespective of flock. The tracheal bacterial microbiota of broilers was comprehensively defined, and Lactobacillus was the dominant bacterial taxon in the trachea. Numerous bacterial taxa were identified, which were strongly correlated with broiler chicken performance across multiple tissues. While many positively correlated taxa were identified, negatively associated potential pathogens were also identified in the absence of clinical disease, indicating that subclinical dynamics occur that impact performance. Overall, this work provides necessary baseline data for the development of effective antibiotic alternatives, such as probiotics, for sustainable poultry production.
IMPORTANCE Multidrug-resistant bacterial pathogens are perhaps the greatest medical challenge we will face in the 21st century and beyond. Antibiotics are necessary in animal production to treat disease. As such, animal production is a contributor to the problem of antibiotic resistance. Efforts are underway to reduce antibiotic use in animal production. However, we are also challenged to feed the world's increasing population, and sustainable meat production is paramount to providing a safe and quality protein source for human consumption. In the absence of antibiotics, alternative approaches are needed to maintain health and prevent disease, and probiotics have great promise as one such approach. This work paves the way for the development of alternative approaches to raising poultry by increasing our understandings of what defines the poultry microbiome and of how it can potentially be modulated to improve animal health and performance.
KEYWORDS: antibiotic free, broilers, chickens, microbiome, performance, poultry
INTRODUCTION
Microbiome science holds great promise for the future of biological therapeutics in animal production, yet many challenges exist in the development of these products. One of the primary challenges thus far has been defining the baseline microbiome of the animal and how this baseline may be modulated. A number of recent studies on the bacterial microbiota of broiler chickens have primarily focused on poultry pathogens and their effects on the host. Not surprisingly, such infectious microorganisms have been shown to exert a potentially negative impact on the broiler microbiome (1–3). Beyond virulent pathogens themselves, vaccines against these pathogens can also exert a detrimental effect on broiler microbiota (4). Feed additives or changes in feed composition have also been shown to confer considerable effects on the gastrointestinal microbiota of poultry and are associated with enhancements in performance parameters (5–9). Furthermore, antibiotic supplementation has long been known to confer beneficial effects on bird performance and health, but this practice also has an impact on the avian microbiota and the emergence of drug-resistant bacteria (10–13). This point has resulted in the reduction or elimination of antibiotic use in commercial poultry worldwide. In the absence or reduction of antibiotic use, there is a pressing need to more comprehensively understand the role of the broiler microbiome in both positive and negative aspects of overall health. This includes understanding its baseline succession and core microbial players. There has been some focus on the successional changes in the broiler microbiome over time and how these are impacted by intervention strategies (14–16). Correlations between broiler weight and microbiota composition have been explored, but generally the scope of these studies has been relatively small (17).
While the gastrointestinal broiler microbiome has been studied in detail, the respiratory broiler microbiota has only been characterized in small studies conducted in Pakistan (n = 14) (18, 19) and the United Kingdom (n = 15) (20). Also, most studies thus far have focused on either the cecum or ileum in the gastrointestinal tract, but not on both (21). Similarly, the litter environment has been fairly well studied, but fewer studies have included comparisons to tissues from the bird itself (22, 23). In this study, we sought to take a more holistic approach to defining the associations between the poultry bacterial microbiota and performance, using multiple sample types from both the bird and its environment across ages, from multiple concurrent and successive flocks, and within a vertically integrated and antibiotic-free broiler system.
RESULTS
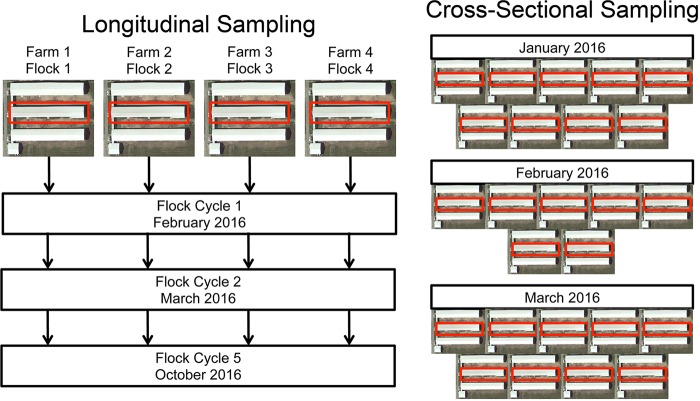
Flocks from four commercial barns on different farms within the same vertically integrated broiler chicken company were followed longitudinally and concurrently in this study (Fig. 1). Each barn housed three successive flocks, resulting in 12 flocks that were followed weekly from days 0 to 42 of age. From these flocks, sampling was performed to collect cecum, ileum, trachea, cloacal swabs, and litter from the barn environment. Additionally, cross-sectional sampling of 25 flocks of different ages was performed at a single time point to gain representation of additional flocks. From 2,309 total samples processed and sequenced using the 16S rRNA gene's V4 hypervariable region, 2,159 samples were retained following removal of samples due to low sequencing output. After filtering of operational taxonomic units (OTUs) not classified as bacteria and those classified as Cyanobacteria (which likely represented chloroplast DNA from plant material in feed), removal of OTUs with counts less than 10 and rarefaction to 5,000 reads per sample, 5,937 OTUs were retained for downstream analyses.
FIG 1.
Sampling strategy. A total of 29 barns carrying 37 flocks were sampled, and each icon represents a barn within a farm. A total of 12 flocks were sampled by following four barns longitudinally for three grow-out cycles, and 10 birds per flock and per time point were sampled (left). A total of 25 random flocks of different ages were sampled in a cross-sectional fashion using six birds per flock (right). Each flock sampled came from a geographically distinct farm within a single vertically integrated broiler company.
Sample type exerts the greatest effect on the bacterial microbiota.
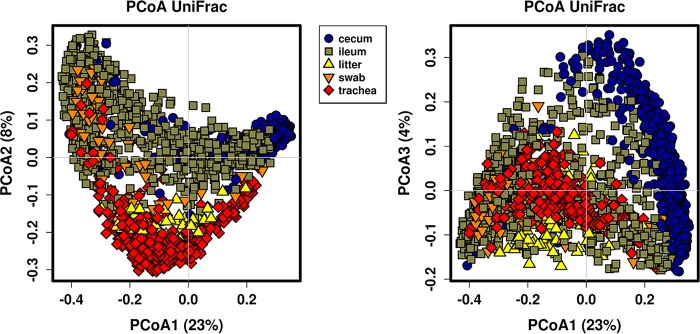
Sample type (cecum, ileum, litter, or trachea) exerted the most significant effect on the bacterial microbiota in this study (Table 1; P < 0.001 and R = 0.636). When examining sample type using principal-coordinate analysis (PCoA) with unweighted UniFrac metrics, trachea/litter samples separated from ileum/cecum samples on principal coordinates PCoA1 and PCoA2 (Fig. 2). In analysis of coordinate PCoA1 versus coordinate PCoA3, ileum and cecum samples separated (Fig. 2). Litter and trachea samples somewhat resembled one another but were clearly distinct from gut samples. Also, cloacal swab samples somewhat resembled ileum samples, but were distinct from cecum samples.
TABLE 1.
Comparative effects of flock, flock cycle, sample type, and age on the bacterial microbiota
| Variable | Age (day no.) | Sample typea |
|||||||
|---|---|---|---|---|---|---|---|---|---|
| Cecum |
Ileum |
Trachea |
Litterb |
||||||
| P | R | P | R | P | R | P | R | ||
| Flock | 7 | <0.001 | 0.053 | 0.02 | 0.037 | 0.002 | 0.105 | ||
| 14 | <0.001 | 0.066 | 0.175 | 0.013 | <0.001 | 0.265 | |||
| 21 | <0.001 | 0.134 | 0.19 | 0.011 | <0.001 | 0.108 | |||
| 28 | <0.001 | 0.095 | 0.05 | 0.027 | <0.001 | 0.12 | |||
| 35 | 0.004 | 0.078 | 0.004 | 0.094 | <0.001 | 0.124 | |||
| 42 | <0.001 | 0.298 | <0.001 | 0.118 | 0.004 | 0.057 | |||
| Flock cycle | 7 | <0.001 | 0.493 | <0.001 | 0.582 | <0.001 | 0.625 | ||
| 14 | <0.001 | 0.373 | <0.001 | 0.635 | <0.001 | 0.447 | |||
| 21 | <0.001 | 0.39 | <0.001 | 0.567 | <0.001 | 0.431 | |||
| 28 | <0.001 | 0.279 | <0.001 | 0.443 | <0.001 | 0.202 | |||
| 35 | <0.001 | 0.446 | <0.001 | 0.522 | <0.001 | 0.299 | |||
| 42 | <0.001 | 0.254 | <0.001 | 0.429 | <0.001 | 0.24 | |||
| All ages | <0.001 | 0.307 | <0.001 | 0.086 | <0.001 | 0.252 | <0.001 | 0.488 | |
For all sample types together, P < 0.001 and R = 0.636.
Note that litter samples were excluded from flock and cycle analyses due to smaller sample sizes.
FIG 2.
Principal-coordinate analysis of samples using unweighted UniFrac measures of beta diversity. Samples are colored by sample type.
Predictable core bacterial microbiota exist within each sample type and are mainly driven by bird age and temporal effects.
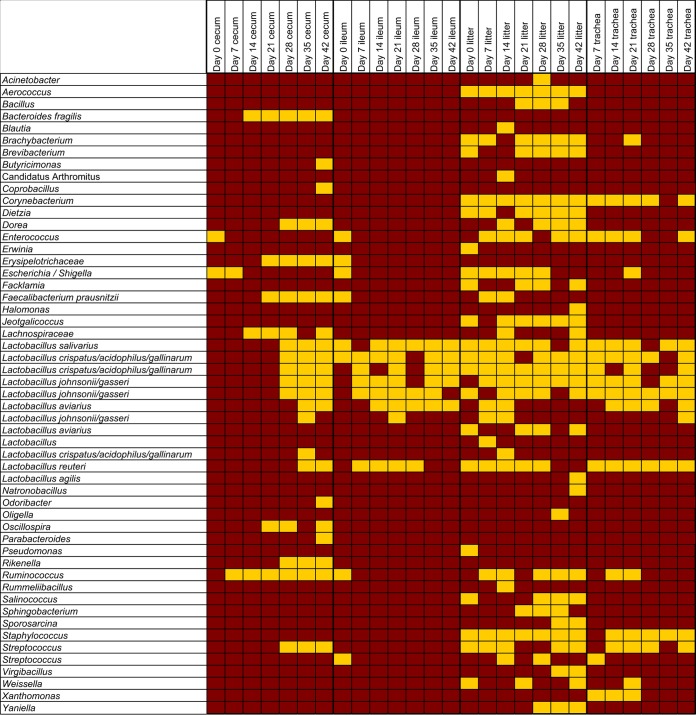
All sample types examined (ileum, cecum, trachea, and litter) exhibited clear and significant shifts in microbiota profile by age (P < 0.05 using analysis of similarity [ANOSIM]; Table 1). Similar patterns of microbiota succession by age were observed in all flocks and flock cycles studied (see Fig. S1 in the supplemental material). Inclusion of cecum and ileum samples from 150 birds from 25 additional flocks confirmed that patterns of age succession are highly consistent and predictable across farms and time (see Fig. S2 in the supplemental material). A predictable core microbiota, which was defined as the OTUs present in at least 90% of the samples for each age and sample type examined, was observed in all sample types; this core microbiota was successive by age (Fig. 3). In general, all sample types contained OTUs classified as Lactobacillus as a member of their core microbiota. These included OTUs classified as Lactobacillus salivarius, Lactobacillus crispatus/acidophilus/gallinarum (multiple species were included because the resolution of the 16S V4 rRNA amplicon did not distinguish between these species), Lactobacillus johnsonii/gasseri, Lactobacillus aviarius, and Lactobacillus reuteri. These taxa were core at most time points in the ileum, litter, and tracheal samples, whereas they were not core to the cecal samples until 28 days of age. Also, OTUs classified as L. johnsonii/gasseri and L. aviarius were core only after 7 and 14 days of age, respectively, similar to patterns we previously observed in the turkey ileum (24). Note that the absence of an OTU as core does not indicate that it was absent from samples or disappeared at these time points; it simply means that >90% of the samples for that time point did not possess the OTU.
FIG 3.
Core OTUs of the broiler microbiota. Classification of OTUs identified as core (present in >90% of samples) was performed by sample type and bird age. Gold indicates core taxa, and maroon indicates noncore taxa. Names listed more than once (e.g., L. aviarius) represent multiple OTUs classified as that taxon.
In addition to lactobacilli, the core cecum microbiota also included OTUs classified as Bacteroides, Dorea, Erysipelotrichaceae, Escherichia/Shigella, Faecalibacterium, Lachnospiraceae, Oscillospira, Rikenella, Ruminococcus, and Streptococcus at multiple ages. The trachea included OTUs classified as Corynebacterium, Enterococcus, Ruminococcus, Staphylococcus, Streptococcus, and Xanthomonas as core members at multiple ages. The litter samples included numerous additional OTUs as core members (Fig. 3). Linear discriminant analysis effect size (LefSe) analysis was performed on the top 50 OTUs to identify taxa that distinguish each sample type (across all ages), and heat map analysis of the top 500 OTUs supported these findings (see Fig. S3 and S4 in the supplemental material). Additionally, this analysis showed that cloacal swab samples contained OTUs classified as Enterococcus cecorum and unclassified Enterobacteriaceae. among others, as distinguishing features, and that an OTU classified as division “Candidatus Arthromitus” was a distinguishing feature of ileum samples.
Flock cycle effects outweighed individual flock effects.
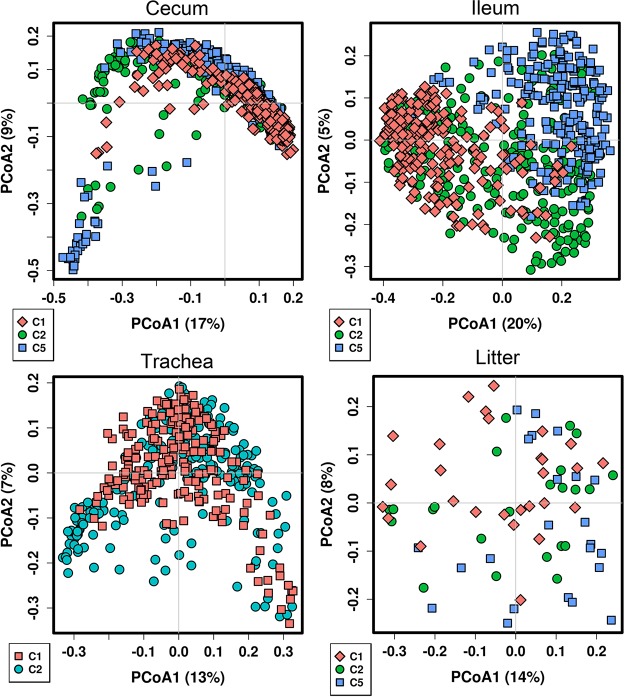
Samples were compared by flock, representing four different flocks grown at the same time in different locations, and by flock cycle, representing successive flocks grown in the same barn across time. When comparing flocks, significant differences (P < 0.05 using ANOSIM; Table 1) were observed between flocks at all bird ages in the cecum and ileum, and between all ages except days 14 to 28 in the ileum. However, the strength of this effect was comparatively small (R values of 0.011 to 0.298), and distinct clustering by flocks was not evident in PCoA plots of unweighted UniFrac values (see Fig. S5 in the supplemental material). In contrast, the effect of flock cycle was much stronger, with all sample types and ages differing significantly (P < 0.001) by flock cycle, with a strong (R values of 0.202 to 0.635) and visible effect in PCoA (Fig. 4). When comparing each sample type across individual flock cycles, all cycles displayed similar successional changes by bird age. However, in the ileum samples, day 28 samples “fell out” of clustering in cycle 2, and day 35 samples did so in cycle 3. These samples coincided with documented mortality due to Escherichia coli infection during these time points within these flocks.
FIG 4.
Effects of successive flock cycles on the broiler microbiota. Principal-coordinate analysis of samples was performed using unweighted UniFrac measures of beta diversity. Samples are colored by flock cycle (C).
Broiler microbiota is highly correlated with bird performance.
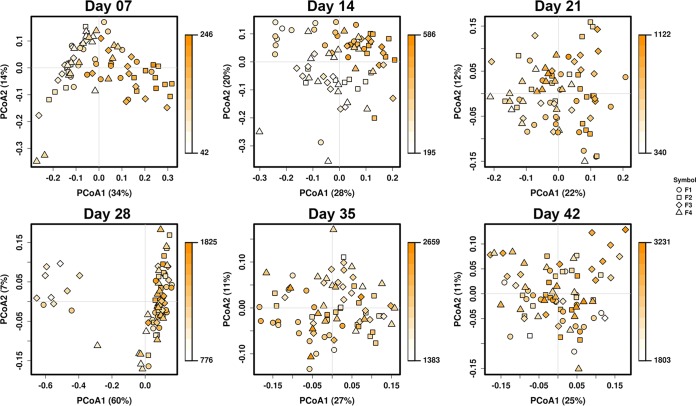
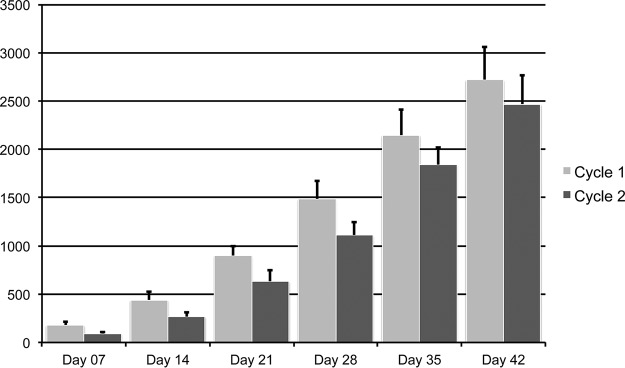
Correlations were sought between bacterial taxa at the genus level and bird weight at the time of sampling. This analysis only included flock cycles 1 and 2, due to sampling constraints, but included all four different flocks from each flock cycle. In all tissues, significant correlations were observed at the bacterial community level of all sample types examined (cecum, ileum, and trachea), using weighted UniFrac beta diversity as a measure, with samples categorized by individual bird weight to account for taxonomic abundance correlated with performance (Fig. 5; see also Fig. S6 and S7 in the supplemental material). These correlations were observed at early time points in the growth cycles, mainly at days 7 and 14 of age (P < 0.001 at days 7 and 14 in all sample types, using ANOSIM). Correlations were not driven by flock, since the four flocks intermixed in the PCoA examining correlations with weight (Fig. 5; see also Fig. S6 and S7 in the supplemental material). However, the correlations were in part driven by flock cycle 1 and cycle 2 (see Fig. S8 in the supplemental material). This is supported by weight data collected at the flock level at time of processing (Table 2) and by individual bird weight data collected at sampling (Fig. 6). Both comparisons indicate that bird weights and overall flock weights were higher for cycle 1 flocks than for cycle 2 flocks (P < 0.001 for both comparisons). This effect was observed across the four flocks studied. While performance differed between flock cycles, livability (percentage of flock surviving through processing; Table 3) and plant condemnations (percentage of bird condemnations at processing; Table 4) were not significantly different between flock cycles.
FIG 5.
Correlations between broiler weight and its cecal microbiota. Principal-coordinate analysis of cecum samples from flock cycles 1 and 2 was performed. Samples are colored by total body weight and scaled to minimum and maximum weights for each sampling age. Sample shapes represent the four different flocks (F) sampled during each flock cycle.
TABLE 2.
Total flock weights by flock cycle
| Cycle | Total flock wt (lbs) for: |
||||
|---|---|---|---|---|---|
| Flock |
All flocksa (n = 183) | ||||
| 1 | 2 | 3 | 4 | ||
| 1 | 60,675 | 58,145 | 56,942 | 59,743 | 57,887 ± 7,801 |
| 2 | 51,419 | 47,225 | 49,088 | 48,005 | 51,679 ± 5,135 |
| 5 | 54,882 | 50,592 | 51,917 | 49,791 | 49,851 ± 4,434 |
Includes all available data from 183 flocks for the respective flock cycle within the vertically integrated system.
FIG 6.
Individual bird weights in flock cycles 1 and 2 by age. Weights are displayed in grams. Error bars depict standard deviations.
TABLE 3.
Flock livability (percentage of total original flock alive at processing) by flock cycle
| Cycle | Flock livability (%) for: |
||||
|---|---|---|---|---|---|
| Flock |
All flocksa (n = 183) | ||||
| 1 | 2 | 3 | 4 | ||
| 1 | 92.4 | 86.5 | 87.3 | 88.8 | 89.5 |
| 2 | 94.6 | 85.2 | 86 | 86.9 | 90.3 |
| 5 | 94.1 | 87.8 | 92.8 | 91.6 | 90.1 |
Includes all available data from 183 flocks for the respective flock cycle within the vertically integrated system.
TABLE 4.
Plant condemnations (percentage of total flock) by flock cycle
| Cycle | Plant condemnations (%) for: |
||||
|---|---|---|---|---|---|
| Flock |
All flocksa (n = 183) | ||||
| 1 | 2 | 3 | 4 | ||
| 1 | 0.08 | 0.15 | 0.2 | 0.28 | 0.71 |
| 2 | 0.07 | 0.1 | 0.27 | 0.09 | 0.34 |
| 5 | 0.06 | 0.15 | 0.29 | 0.24 | 0.36 |
Includes all available data from 183 flocks for the respective flock cycle within the vertically integrated system.
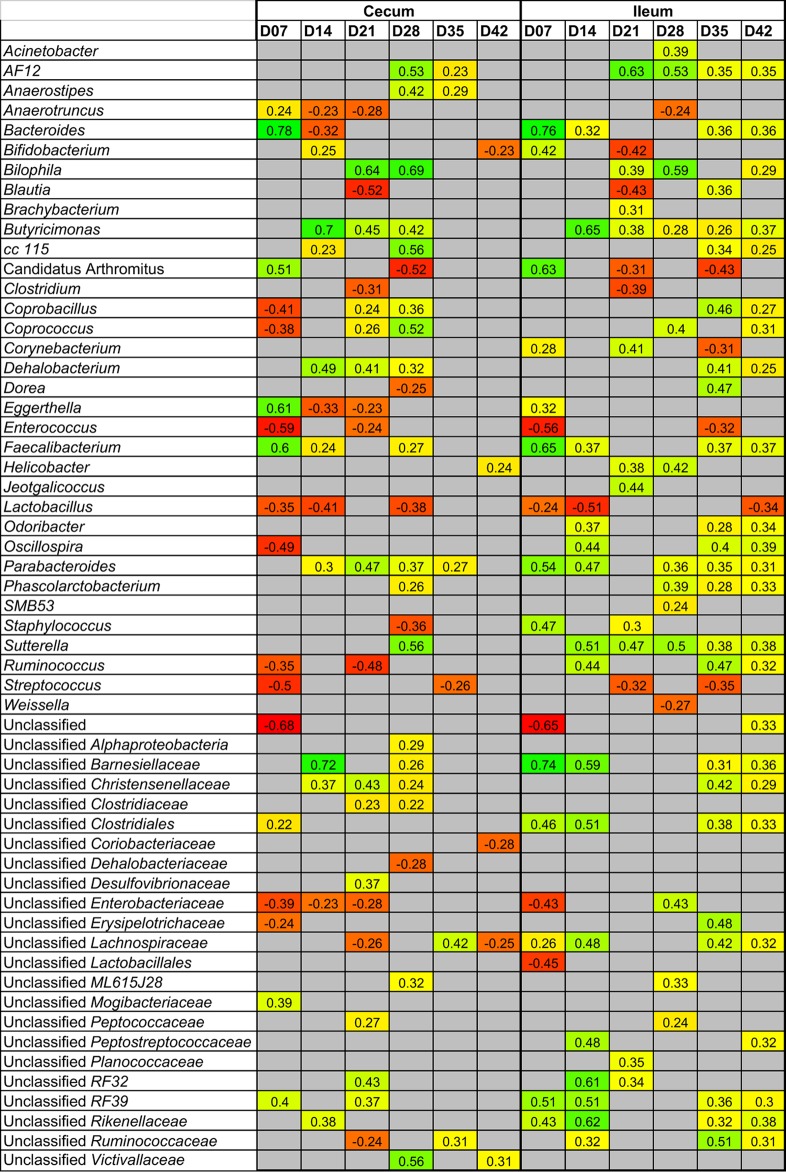
Numerous genus-level taxa were identified in the gastrointestinal tract that were significantly correlated, both positively and negatively, with performance (Fig. 7). As with beta diversity measurements, the greatest correlations were identified at earlier ages. In the cecum, the taxa most positively correlated with bird weight included Bacteroides (day 7), Bilophila (days 21 and 28), Butyricimonas (days 14 to 28), division “Candidatus Arthromitus” (day 7), Eggerthella (day 7), and Faecalibacterium (day 7). The taxa most negatively correlated with bird weight included Anaerotruncus (days 7 to 12), Bacteroides (day 14), Blautia (day 21), division “Candidatus Arthromitus” (day 28), Clostridium (day 21), Coprobacillus (day 7), Coprococcus (day 7), Eggerthella (days 14 and 21), Enterococcus (days 7 and 21), Lactobacillus (days 7, 14, and 21), Oscillospira (day 7), Staphylococcus (day 28), Ruminococcus (days 7 and 21), Streptococcus (days 7 and 35), and unclassified Enterobacteriaceae (days 7 to 21). Similar correlations were observed in the ileum.
FIG 7.
Genus-level taxa in the ileum and cecum correlated with broiler weight. Positively associated taxa (P < 0.05) are colored shades of yellow-green, with numbers indicating Spearman's correlation, while negatively associated taxa are colored shades of orange-red. Gray indicates a nonsignificant value.
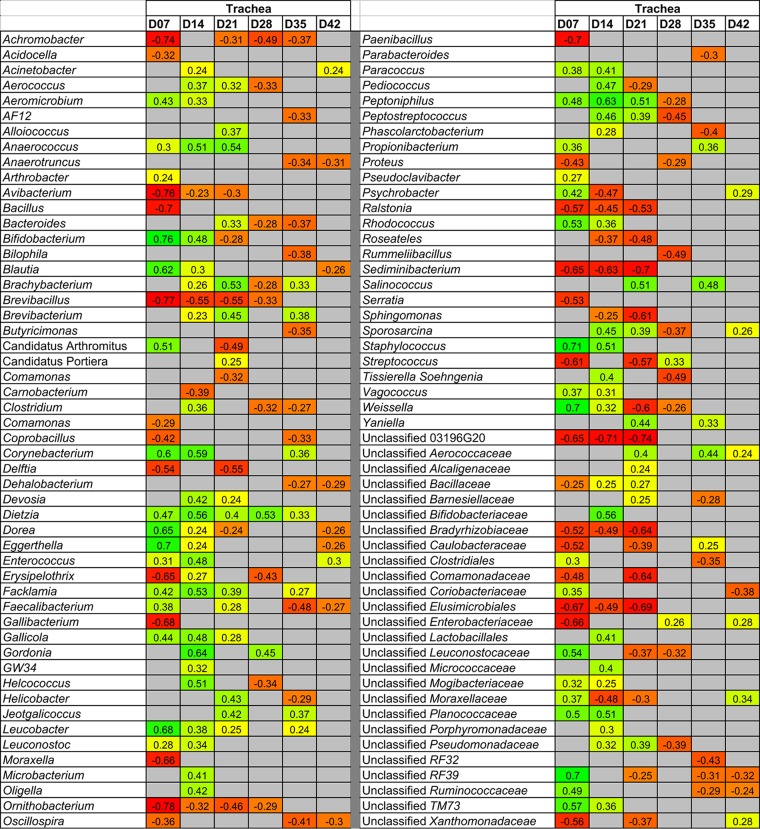
In the trachea, an even greater number of statistically significant correlations between genus-level taxa and broiler weight were observed (Fig. 8). Again, the majority of these associations were observed at early ages. Included among the most positively correlated taxa were Anaerococcus (days 7 to 21), Bifidobacterium (days 7 and 14), Blautia (days 7 and 14), division “Candidatus Arthromitus” (day 7), Corynebacterium (days 7 and 14), Dietzia (days 7 to 35), Dorea (day 7), Eggerthella (day 7), Facklamia (days 7 to 21), Gordonia (days 14 and 28), Leucobacter (days 7 to 21 and 35), Peptonophilus (days 7 to 21), Rhodococcus (days 7 and 14), Staphylococcus (days 7 and 14), and Weissella (days 7 and 14). Bacterial taxa negatively correlated with broiler weight in the trachea included Achromobacter (day 7 and 21 to 35), Avibacterium (days 7 to 21), Bacillus (day 7), Brevibacillus (days 7 to 28), Delftia (days 7 and 21), Erysipelothrix (days 7 and 28), Gallibacterium (day 7), Moraxella (day 7), Ornithobacterium (days 7 to 28), Paenibacillus (day 7), Ralstonia (days 7 to 21), Sediminibacterium (days 7 to 21), and Streptococcus (days 7 and 21).
FIG 8.
Genus-level taxa in the trachea correlated with broiler weight. Positively associated taxa (P < 0.05) are colored shades of yellow-green with a number indicating Spearman's correlation, while negatively associated taxa are colored shades of orange-red. Gray indicates a nonsignificant value.
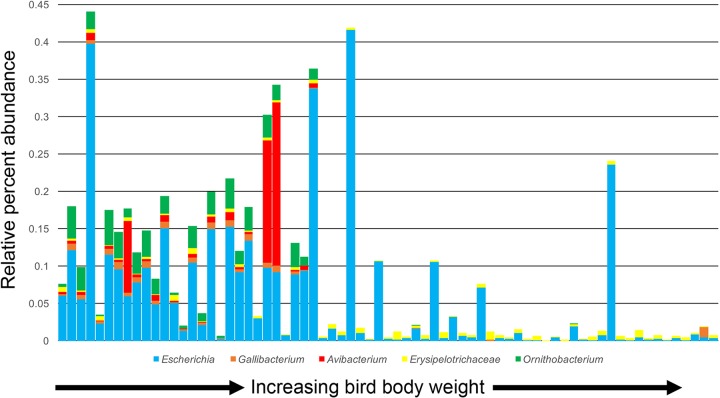
Because of the large number of correlations between bacterial genera and weight, we further explored if such correlations were driven more by flock cycle differences, or if such correlations represented true gradients in genus abundance, irrespective of flock cycle. We observed that many of the negative correlations with performance involving potential pathogens were driven by flock cycle, where they were abundant at early ages in birds from flock cycle 2 (lower weights) and absent at early ages in birds from flock cycle 1 (higher weights) (Fig. 9). Included among bacterial taxa displaying this pattern were Escherichia/Shigella, Ornithobacterium, Avibacterium, and Gallibacterium. We confirmed that dominant OTUs within these genera were indeed bacterial species pathogenic to poultry (e.g., Ornithobacterium rhinotracheale, Avibacterium paragallinarum, and Gallibacterium anatis). Other genera displayed gradients of relative abundance across flock cycles, indicating that these taxa may be broader indicators of bacterial taxa correlated with bird performance (see Fig. S9 and S10 in the supplemental material).
FIG 9.
Cooccurring potential pathogens in the trachea of 7-day-old broilers. Each stacked bar depicts an individual bird, and bars are ordered by total bird weight.
The broiler tracheal microbiota is dominated by Lactobacillus.
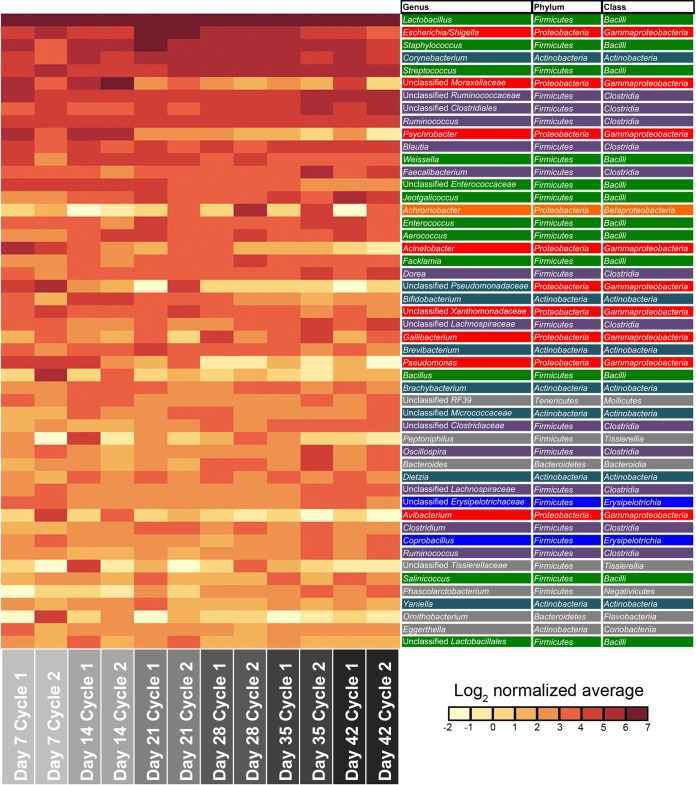
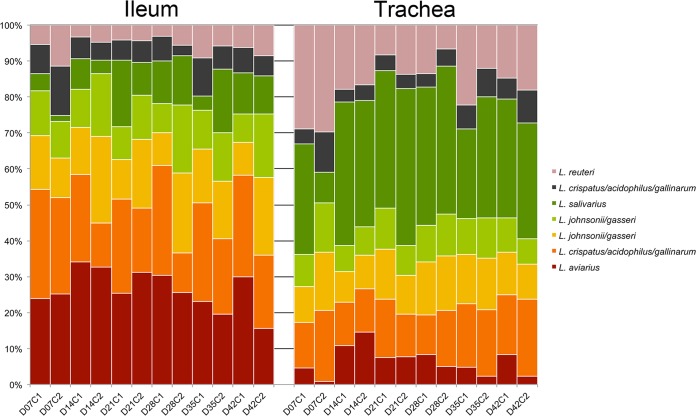
Since few studies have examined the broiler tracheal bacterial microbiota, this was further examined using the dominant taxa identified across tracheal samples (Fig. 10). The 10 most dominant genus-level tracheal taxa identified in this study, representing >75% of the total tracheal bacterial sequences, were classified as Lactobacillus, Escherichia/Shigella, Staphylococcus, Corynebacterium, unclassified Moraxellaceae, unclassified Ruminococcaceae, unclassified Clostridiales, Ruminococcus, Psychrobacter, and Blautia. Because the occurrence of Lactobacillus in the trachea was of interest, we further examined the relative proportion of OTUs classified as Lactobacillus in the trachea versus that found in the ileum (Fig. 11). The relative abundances of the dominant Lactobacillus species were significantly different between the two tissues (P < 0.05). Specifically, an OTU classified as L. aviarius was of lower relative abundance in the trachea, while OTUs classified as L. reuteri and L. crispatus/acidophilus/gallinarum were of higher relative abundance.
FIG 10.
Dominant bacterial taxa in the broiler chicken trachea. The top 50 most abundant genus-level taxa across all tracheal samples (top to bottom) are displayed in a log2-normalized heat map. Classifications are displayed to the right, with colors indicating a bacterial class that occurs more than once. Gray indicates a bacterial class that occurs only once.
FIG 11.
Ecology of lactobacilli differs in the broiler chicken ileum and trachea. Proportions of normalized counts of the top seven OTUs classified as Lactobacillus are displayed across day of age (D) and flock cycle (C).
DISCUSSION
The purpose of this study was to perform comprehensive sampling within a vertically integrated, antibiotic-free broiler system. This was done in a manner to better define the broiler microbiome, and to define what factors have the greatest impact on the broiler microbiome. Finally, this study was performed with a design aimed at identifying bacterial taxa associated with broiler performance in a natural commercial flock setting.
Not surprisingly, sample type had the greatest impact on microbiota. This has been reported in several previous studies (13, 15, 24). A notable result from this study was that cloacal swab microbiota is not directly reflective of those of either cecum or ileum samples, and actually most closely represents that of litter samples. This suggests that fecal/cloacal swabs are not a good sample choice when tissues proximal to the cloaca are of interest. This is supported by a recent study in ostriches that also found cloacal swabs to be similar to fecal samples and dissimilar to ileum or cecum samples (25) and by a previous study comparing cecal content and fecal swabs that identified significant differences in alpha and beta diversity between the two sample types (26).
This study examined flocks from four barns from geographically distinct farms. These barns were followed concurrently for three successive flock cycles. Our results indicate a significant flock-to-flock effect within the same flock cycle and a significant flock cycle effect. However, the effect of flock cycle greatly outweighed the within-cycle flock-to-flock effect. In fact, the flock-to-flock effect was the smallest of all effects examined, including those of sample type, age, flock cycle, and flock itself. Also interesting was that flock performances in these randomly selected barns mimicked one another across successive grow outs, and that these patterns were extended across the entire system. Differences in performance between flock cycles occurred in the absence of differences in mortality or disease. This points to one of several possible factors impacting broiler performance within a vertically integrated system that could have system-wide effects. One possibility is that environmental factors differed between flock cycles due to climate. Another possibility is that systematic changes, such as changes in nutrition or management, had an impact across the barns within the system. A third possibility is that the hatchery supplying these barns had an impact on the incoming chicks that impacted their resulting microbiota through vertical transmission of microbes, stress to the chicks during the hatching process, or transfer stress. We cannot rule out any of these possibilities, except to say that diet and intervention strategies were generally consistent during this study. No antibiotics were used on any of the flocks examined, and no major disease outbreaks occurred during the sampling period. Therefore, the most likely contributors to flock cycle variation were the climate and the hatchery. Seasonal differences could also impact feed and environmental pathogen prevalence, so these cannot be ruled out. Additional sampling would be required to determine which factors contributed to these observed differences.
The core broiler microbiota defined here is similar to that of previous studies, including those that have defined the core microbiota of feces and litter (27). Prior to this study, sampling of respiratory tissues in broilers has been limited (18–20). PCoA and core microbiota analysis suggest that the tracheal microbiota is distinct from those of gut and litter samples, but seems to be partially reflective of both. This differs from what one would expect from mammals and likely reflects the barn environment, where birds are constantly exposed to litter dust and the microbes contained within. Of course, it is also dependent on what bacteria will actually colonize in the trachea. The data from this study indicate that the tracheal microbiota is not simply a reflection of exposure to the litter environment; rather, it results from a combination of exposure to the litter environment and preferential selection for microbes from that environment with the capacity to colonize. This is perhaps best exemplified by L. aviarius, which is abundant in the litter and ileum and significantly less abundant in the trachea. L. aviarius is one of the few lactobacilli that are strict anaerobes (24, 28, 29). Therefore, one would not expect L. aviarius to colonize the trachea. This also enables possible discernment between colonizing and transient tracheal bacteria based upon relative abundance. Since we find lower levels of L. aviarius in the trachea, this represents what are very likely to be transient levels of the bacteria and could also represent a potential cutoff between transient and colonizing species.
There were very strong correlations between genus-level bacterial taxa and bird weight as a measure of performance. This study establishes such correlations across multiple sample types. Notably, a number of potential pathogens were negatively associated with performance in the young broiler. In the gut, these included Clostridium, Enterococcus, and unclassified Enterobacteriaceae, the last of which in our experience typically signifies E. coli or associated Enterobacteriaceae. There are bacterial species within each of these groups that cause important broiler diseases, including Clostridium perfringens (necrotic enteritis and clostridial dermatitis) (30), Enterococcus cecorum (kinky back disease) (31), and avian pathogenic E. coli (colibacillosis) (32). However, the resolution of methods used in this study cannot necessarily discriminate between pathogenic species and those that could be beneficial (for example, species of Clostridium), so we cannot say for certain if these OTUs represent specific pathogens. With that said, we did explore the dominant OTUs for each potentially pathogenic genus, using BLAST searches against NCBI's 16S rRNA reference database. This confirmed that the dominant OTU from genus Clostridium displayed the greatest similarity with C. perfringens, the dominant OTU from genus Enterococcus was classified as E. cecorum, and the dominant OTU from unclassified Enterobacteriaceae displayed greatest similarity with Escherichia. This lends support to the idea that these could represent pathogenic bacterial species, accounting for negative correlations with performance.
Similarly, a number of potential respiratory pathogens in the trachea were found to be negatively correlated with performance, including Avibacterium, Erysipelothrix, Gallibacterium, and Ornithobacterium. Again, bacterial species within these groups cause significant diseases of poultry, including Avibacterium paragallinarum (infectious coryza) (33), Erysipelothrix rhusiopathiae (erysipelas) (34), Gallibacterium anatis (peritonitis) (35), and Ornithobacterium rhinotracheale (Ornithobacterium rhinotracheale respiratory disease) (36). OTU-based analysis again supported that pathogenic species may be the dominant OTUs in our data set for each genus mentioned above. Interestingly, no birds at the time of sampling displayed any lesions or other signs of clinical disease, and mortalities and plant condemnations did not differ between flock cycles. This underscores the potential importance of these pathogens lurking in the barn environment, causing subclinical stress or disease/dysbiosis, and subsequently impacting broiler performance. Another interesting finding was the consistently negative correlation between Lactobacillus abundance and bird weights. This has been previously reported (37), and it deserves further study, since many probiotic applications in poultry are Lactobacillus-based.
Other potentially interesting taxa were correlated with performance. For example, Achromobacter in the trachea was negatively correlated with performance across multiple time points. Achromobacter is very closely related to Bordetella avium, an important respiratory pathogen of poultry (38). Brevibacillus was among the taxa in the trachea most negatively correlated with performance. A species of Brevibacillus is commonly used as a feed additive in poultry because it is pathogenic toward house flies (39). While these could be entirely different bacterial species, it is worth noting that we should consider not only known pathogens, but also bacteria that have not been traditionally considered pathogens.
On a positive note, there may be hidden gems in these data that provide opportunity for further study. Several bacterial taxa were either highly positively correlated with performance in young birds or consistently correlated with performance over time. These include Bacteroides, Butyricimonas, division “Candidatus Arthromitus,” Faecalibacterium, Parabacteroides, and Sutterella in the gut, and Bifidobacterium, division “Candidatus Arthromitus,” Corynebacterium, Dietzia, Facklamia, Leucobacter, Staphylococcus, and Weissella in the trachea. Most of these organisms have not been explored for probiotic application in poultry. However, some have previously been correlated with performance. For example, another study identified Faecalibacterium as being correlated with enhanced feed conversion rates in chickens (37). Butyricimonas and Bacteroides have been reported as core components of the poultry microbiota in other studies (15, 21, 40, 41), and perhaps deserve attention for their possible probiotic capabilities. Division “Candidatus Arthromitus” is well known for its immunomodulatory capabilities and has previously been identified as a strong biomarker of performance in commercial turkeys (24). Interestingly, some taxa, such as division “Candidatus Arthromitus,” display positive correlations at early ages with weight and negative correlations at later ages. This would be expected for bacterial taxa that fluctuate in relative abundance over time. That is, early emergence of the taxa may be positively correlated with weight, while the same taxa may emerge later in lower-performing birds and thus would then be negatively correlated with weight.
Some limitations to this study exist. First, it was limited to a single poultry company and a single genetic line of broiler chickens. Also, while the study examined multiple flocks across successive grow-out cycles, it was limited to a specific time frame between 2015 and 2016. Extending the time frame of sampling might have yielded additional observations related to the cycle-specific effects, and examining additional companies and genetic lines of birds would have helped to determine how the results translate to poultry production worldwide. We were only able to assess bird weights, and were not able to monitor average daily weight gain or feed consumption. Bird weights may be an imperfect measure of performance. Nevertheless, this represents the most comprehensive efforts to date to define the broiler chicken microbiota. This work provides baseline knowledge of the poultry microbiome that will contribute to the future development of antibiotic alternatives, reducing the need for antibiotic use in commercial poultry and contributing to sustainable poultry production.
MATERIALS AND METHODS
All work in this study was reviewed and approved by the University of Minnesota Institutional Animal Care and Use Committee, and it was determined that no formal approval was needed.
Experimental design.
A total of 720 commercial Cobb 500 broiler chickens from 12 total flocks and three times of year were sampled from a single vertically integrated broiler operation in Minnesota (Fig. 1). Flocks were sampled weekly from days 7 through 42 of grow out, and 10 birds per flock were randomly selected. Additionally, pooled intestinal tissues from 10 random birds were sampled at day of placement for each flock, and composite litter samples consisting of random grabs throughout the barn were collected weekly. Flocks were sampled from four different barns (designated throughout as “farm”). These four farms were sampled at three independent times (designated throughout as “cycles”). Cycles were labeled cycle 1, cycle 2, and cycle 5, representing two successive flocks for each farm (cycles 1 and 2) and a fifth successive cycle (cycle 5). All flocks within each cycle were placed at the same time, within 1 to 2 days. Cycle 1 occurred during February to March 2016. Cycle 2 occurred during March to May 2016. Cycle 5 occurred during October to November 2016.
To examine the overall consistency and predictability of the successional (age) effects on the broiler bacterial microbiota, additional samples were collected from three monthly posting sessions conducted by the company participating in this study. Samplings took place from January through March 2016. At these postings, a total of 296 ileum and cecum samples were collected from 10 to 12 different farms and at ages ranging from 7 to 35 days.
Sample collection.
Immediately following humane euthanasia of birds using cervical dislocation, digesta from the ceca and the distal 10 cm of the ileum for all birds (n = 855) were aseptically collected by squeezing content of the section into a sterile tube. Trachea were also collected aseptically from some birds (n = 474) and placed in a Whirl-Pak bag. All samples were kept on ice from the collection until being stored at −20°C. Litter samples (n = 75) were collected at the same time by taking 10 composite grabs across each barn and placing in a single Whirl-Pak bag. Cloacal swabs were also collected from farm 1, flock cycle 5 (n = 50; Puritan HydraFlock, Guilford, ME). The same sampling procedures were used for all sampling points, resulting in a total of 2,309 samples collected in this study.
Sample processing and sequencing.
An equal amount of phosphate-buffered saline (PBS; vol:vol) was added to each litter sample and vortexed for 1 min, and then the liquid was aliquoted and stored at −80°C prior to DNA extraction. A total of 250 mg of cecal digesta, ileal digesta, and litter wash was added to MoBio PowerSoil Power Bead plates. Cloacal swabs were clipped directly above the swab and placed into Power Bead plates. From each sample, DNA was extracted with bead beating, using a MoBio PowerSoil-htp 96 Well DNA extraction kit (Mo Bio Laboratories, Carlsbad, CA) according to the manufacturer's directions. Trachea samples were washed by pipetting 1 ml cold PBS through the trachea five times. The wash was centrifuged for 5 min and 10,000 × g, and each pellet was washed twice with 1 ml fresh PBS. DNA was extracted from tracheal washes, using the Qiagen DNeasy blood and tissue kit (Qiagen, Germantown, MA) according to the manufacturer's protocol.
DNA was quantified using PicoGreen (Invitrogen). Amplification of the 16S rRNA gene was performed using KAPA HiFidelity Hot Start polymerase (Kapa Biosystems, Inc., Wilmington, MA) for two rounds of PCR at the University of Minnesota Genomics Center (Minneapolis, MN). For the first round, the 515F (5′-TCGTCGGCAGCGTCAGATGTGTATAAGAGACAGGTGCCAGCMGCCGCGGTAA-3′) and 806R (5′-GTCTCGTGGGCTCGGAGATGTGTATAAGAGACAGGGACTACHVGGGTWTCTAAT-3′) Nextera primers (42) (Integrated DNA Technologies, Coralville, IA) were used to amplify the V4 hypervariable region, using the following cycling parameters: one cycle of 95°C for 5 min, followed by 20 cycles of 98°C for 20 s, 55°C for 15 s, and 72°C for 1 min. The products were then diluted 1:100, and 5 μl was used in a second round of PCR using forward (5′-AATGATACGGCGACCACCGAGATCTACAC[i5]TCGTCGGCAGCGTC-3′) and reverse (5′-CAAGCAGAAGACGGCATACGAGAT[i7]GTCTCGTGGGCTCGG-3′) indexing primers (Integrated DNA Technologies). The second PCR used the following cycling parameters: 1 cycle at 95°C for 5 min, followed by 10 cycles of 98°C for 20 s, 55°C for 15 s, and 72°C for 1 min. Equally pooled, size-selected samples were denatured with NaOH, diluted to 8 pM in Illumina's HT1 buffer, spiked with 15% PhiX, and heat denatured at 96°C for 2 min immediately prior to loading. A MiSeq 600 (2 × 300 bp) cycle v3 kit (Illumina, San Diego, CA) was used to sequence the samples. This protocol represents an optimization of the Earth Microbiome Project protocol (43) that was reported elsewhere (44). Negative water blanks and negative extraction controls were included with each sequencing run. A total of 380 samples plus controls and blanks were included in each of seven sequencing runs.
Data collection: growth performance.
Total body weights in grams were collected from all birds in flock cycles 1 and 2 at the time of euthanasia. Spearman's correlation analysis was used to determine correlation of body weight (in grams) and bacteria taxa at the genus level for each tissue (ileum, cecum, and trachea) at each time point (days 7, 14, 21, 28, 35, and 42). The cutoff for significance was P < 0.05 and Bonferroni's adjusted P < 0.05.
DNA sequence analyses.
Following sequencing, sequence reads were sorted by barcode to generate fastq files for each sample. Proximal and distal primers were trimmed from the sequence reads. Paired-end reads were joined using SeqPrep in the Quantitative Insights Into Microbial Ecology (QIIME) pipeline, with default quality filtering. Open referenced operational taxonomic unit (OTU) picking was performed in QIIME version 1.8.0 (45), using uclust (46) with clustering at 97% similarity and Greengenes 13_8 as the reference database. Potential chimeras were removed using ChimeraSlayer (47). OTUs of chloroplast origin and OTUs present in negative-control amplifications were also removed prior to subsequent analysis, and OTUs with read counts of less than 10 were removed. Samples were rarefied to 5,000 high quality reads per sample.
QIIME was used for assessments of alpha diversity, beta diversity using unweighted and weighted UniFrac (48), phylogenetic classifications using the Greengenes database (49), and core bacterial community structure. Statistical differences in overall community structure were performed in RStudio version 1.0 (with R statistical package version 3.3.1), using distance matrices analyzed via the ANOSIM command in QIIME (for beta diversity) and a nonparametric two-sample t test (for alpha diversity). Calypso was used for statistical comparisons of weight to microbiota, using Spearman's correlation with body weight as a continuous variable (50). For these analyses, the input biological observation matrix (BIOM) table from QIIME was used and subjected to further filtering and normalization. Taxa present in less than 50% of samples were removed. Taxa with less than 0.01% relative abundance across samples were removed. Data were normalized using total-sum normalization, followed by cumulative-sum scaling and log2 transformation. Statistical comparisons of temporal samples were performed using DESeq2 (51) at the genus level, using the top 300 most abundant taxa. Visualizations of data were performed using ggplot2 (52), heatmap, and beeswarm functions in R.
Data availability.
All raw data and associated metadata from this project are freely available through the University of Minnesota Digital Conservancy's Data Repository for the U of M (DRUM; https://doi.org/10.13020/D63T10).
Supplementary Material
ACKNOWLEDGMENTS
Bioinformatics were supported using tools available from the Minnesota Supercomputing Institute.
This project was supported by Agriculture and Food Research Initiative Competitive Grants (2016-67015-24911 and 2015-68004-23131) from the USDA National Institute of Food and Agriculture.
We are grateful for Carrie Cremers for assistance in this study.
Footnotes
Supplemental material for this article may be found at https://doi.org/10.1128/AEM.00362-18.
REFERENCES
- 1.Lin Y, Xu S, Zeng D, Ni X, Zhou M, Zeng Y, Wang H, Zhou Y, Zhu H, Pan K, Li G. 2017. Disruption in the cecal microbiota of chickens challenged with Clostridium perfringens and other factors was alleviated by Bacillus licheniformis supplementation. PLoS One 12:e0182426. doi: 10.1371/journal.pone.0182426. [DOI] [PMC free article] [PubMed] [Google Scholar]
- 2.Macdonald SE, Nolan MJ, Harman K, Boulton K, Hume DA, Tomley FM, Stabler RA, Blake DP. 2017. Effects of Eimeria tenella infection on chicken caecal microbiome diversity, exploring variation associated with severity of pathology. PLoS One 12:e0184890. doi: 10.1371/journal.pone.0184890. [DOI] [PMC free article] [PubMed] [Google Scholar]
- 3.Awad WA, Mann E, Dzieciol M, Hess C, Schmitz-Esser S, Wagner M, Hess M. 2016. Age-related differences in the luminal and mucosa-associated gut microbiome of broiler chickens and shifts associated with Campylobacter jejuni infection. Front Cell Infect Microbiol 6:154. doi: 10.3389/fcimb.2016.00154. [DOI] [PMC free article] [PubMed] [Google Scholar]
- 4.Park SH, Kim SA, Rubinelli PM, Roto SM, Ricke SC. 2017. Microbial compositional changes in broiler chicken cecal contents from birds challenged with different Salmonella vaccine candidate strains. Vaccine 35:3204–3208. doi: 10.1016/j.vaccine.2017.04.073. [DOI] [PubMed] [Google Scholar]
- 5.Abudabos AM, Al-Atiyat RM, Albatshan HA, Aljassim R, Aljumaah MR, Alkhulaifi MM, Stanley DM. 2017. Effects of concentration of corn distillers dried grains with solubles and enzyme supplementation on cecal microbiota and performance in broiler chickens. Appl Microbiol Biotechnol 101:7017–7026. doi: 10.1007/s00253-017-8448-5. [DOI] [PubMed] [Google Scholar]
- 6.Gao P, Ma C, Sun Z, Wang L, Huang S, Su X, Xu J, Zhang H. 2017. Feed-additive probiotics accelerate yet antibiotics delay intestinal microbiota maturation in broiler chicken. Microbiome 5:91. doi: 10.1186/s40168-017-0315-1. [DOI] [PMC free article] [PubMed] [Google Scholar]
- 7.Crisol-Martínez E, Stanley D, Geier MS, Hughes RJ, Moore RJ. 2017. Sorghum and wheat differentially affect caecal microbiota and associated performance characteristics of meat chickens. PeerJ PrePrints 5:e3071. doi: 10.7717/peerj.3071. [DOI] [PMC free article] [PubMed] [Google Scholar]
- 8.Borda-Molina D, Vital M, Sommerfeld V, Rodehutscord M, Camarinha-Silva A. 2016. Insights into broilers' gut microbiota fed with phosphorus, calcium, and phytase supplemented diets. Front Microbiol 7:2033. doi: 10.3389/fmicb.2016.02033. [DOI] [PMC free article] [PubMed] [Google Scholar]
- 9.De Maesschalck C, Eeckhaut V, Maertens L, De Lange L, Marchal L, Nezer C, De Baere S, Croubels S, Daube G, Dewulf J, Haesebrouck F, Ducatelle R, Taminau B, Van Immerseel F. 2015. Effects of xylo-oligosaccharides on broiler chicken performance and microbiota. Appl Environ Microbiol 81:5880–5888. doi: 10.1128/AEM.01616-15. [DOI] [PMC free article] [PubMed] [Google Scholar]
- 10.Park SH, Roto S, Pavlidis H, McIntyre D, Striplin K, Brammer L, Ricke SC. 2017. Effects of feeding Original XPC™ to broilers with a live coccidiosis vaccine under industrial conditions: part 2. Cecal microbiota analysis. Poult Sci 96:2400–2411. doi: 10.3382/ps/pex014. [DOI] [PubMed] [Google Scholar]
- 11.Costa MC, Bessegatto JA, Alfieri AA, Weese JS, Filho JAB, Oba A. 2017. Different antibiotic growth promoters induce specific changes in the cecal microbiota membership of broiler chicken. PLoS One 12:e0171642. doi: 10.1371/journal.pone.0171642. [DOI] [PMC free article] [PubMed] [Google Scholar]
- 12.Danzeisen JL, Kim HB, Isaacson RE, Tu ZJ, Johnson TJ. 2011. Modulations of the chicken cecal microbiome and metagenome in response to anticoccidial and growth promoter treatment. PLoS One 6:e27949. doi: 10.1371/journal.pone.0027949. [DOI] [PMC free article] [PubMed] [Google Scholar]
- 13.Danzeisen JL, Clayton JB, Huang H, Knights D, McComb B, Hayer SS, Johnson TJ. 2015. Temporal relationships exist between cecum, ileum, and litter bacterial microbiomes in a commercial turkey flock, and subtherapeutic penicillin treatment impacts ileum bacterial community establishment. Front Vet Sci 2:56. doi: 10.3389/fvets.2015.00056. [DOI] [PMC free article] [PubMed] [Google Scholar]
- 14.Donaldson EE, Stanley D, Hughes RJ, Moore RJ. 2017. The time-course of broiler intestinal microbiota development after administration of cecal contents to incubating eggs. PeerJ PrePrints 5:e3587. doi: 10.7717/peerj.3587. [DOI] [PMC free article] [PubMed] [Google Scholar]
- 15.Oakley BB, Kogut MH. 2016. Spatial and temporal changes in the broiler chicken cecal and fecal microbiomes and correlations of bacterial taxa with cytokine gene expression. Front Vet Sci 3:11. doi: 10.3389/fvets.2016.00011. [DOI] [PMC free article] [PubMed] [Google Scholar]
- 16.Ranjitkar S, Lawley B, Tannock G, Engberg RM. 2016. Bacterial succession in the broiler gastrointestinal tract. Appl Environ Microbiol 82:2399–2410. doi: 10.1128/AEM.02549-15. [DOI] [PMC free article] [PubMed] [Google Scholar]
- 17.Han GG, Kim EB, Lee J, Lee J-Y, Jin G, Park J, Huh C-S, Kwon I-K, Kil DY, Choi Y-J, Kong C. 2016. Relationship between the microbiota in different sections of the gastrointestinal tract, and the body weight of broiler chickens. Springerplus 5:911. doi: 10.1186/s40064-016-2604-8. [DOI] [PMC free article] [PubMed] [Google Scholar]
- 18.Shabbir MZ, Malys T, Ivanov YV, Park J, Shabbir MAB, Rabbani M, Yaqub T, Harvill ET. 2015. Microbial communities present in the lower respiratory tract of clinically healthy birds in Pakistan. Poult Sci 94:612–620. doi: 10.3382/ps/pev010. [DOI] [PMC free article] [PubMed] [Google Scholar]
- 19.Sohail MU, Hume ME, Byrd JA, Nisbet DJ, Shabbir MZ, Ijaz A, Rehman H. 2015. Molecular analysis of the caecal and tracheal microbiome of heat-stressed broilers supplemented with prebiotic and probiotic. Avian Pathol 44:67–74. doi: 10.1080/03079457.2015.1004622. [DOI] [PubMed] [Google Scholar]
- 20.Glendinning L, McLachlan G, Vervelde L. 2017. Age-related differences in the respiratory microbiota of chickens. PLoS One 12:e0188455. doi: 10.1371/journal.pone.0188455. [DOI] [PMC free article] [PubMed] [Google Scholar]
- 21.Oakley BB, Lillehoj HS, Kogut MH, Kim WK, Maurer JJ, Pedroso A, Lee MD, Collett SR, Johnson TJ, Cox NA. 2014. The chicken gastrointestinal microbiome. FEMS Microbiol Lett 360:100–112. doi: 10.1111/1574-6968.12608. [DOI] [PubMed] [Google Scholar]
- 22.Wang L, Lilburn M, Yu Z. 2016. Intestinal microbiota of broiler chickens as affected by litter management regimens. Front Microbiol 7:593. doi: 10.3389/fmicb.2016.00593. [DOI] [PMC free article] [PubMed] [Google Scholar]
- 23.Cressman MD, Yu Z, Nelson MC, Moeller SJ, Lilburn MS, Zerby HN. 2010. Interrelations between the microbiotas in the litter and in the intestines of commercial broiler chickens. Appl Environ Microbiol 76:6572–6582. doi: 10.1128/AEM.00180-10. [DOI] [PMC free article] [PubMed] [Google Scholar]
- 24.Danzeisen JL, Calvert AJ, Noll SL, McComb B, Sherwood JS, Logue CM, Johnson TJ. 2013. Succession of the turkey gastrointestinal bacterial microbiome related to weight gain. PeerJ PrePrints 1:e237. doi: 10.7717/peerj.237. [DOI] [PMC free article] [PubMed] [Google Scholar]
- 25.Videvall E, Strandh M, Engelbrecht A, Cloete SCC. 2017. Measuring the gut microbiome in birds: comparison of faecal and cloacal sampling. Mol Ecol Resour. doi: 10.1111/1755-0998.12744. [DOI] [PubMed] [Google Scholar]
- 26.Stanley D, Geier MS, Chen H, Hughes RJ, Moore RJ. 2015. Comparison of fecal and cecal microbiotas reveals qualitative similarities but quantitative differences. BMC Microbiol 15:51. doi: 10.1186/s12866-015-0388-6. [DOI] [PMC free article] [PubMed] [Google Scholar]
- 27.Oakley BB, Morales CA, Line J, Berrang ME, Meinersmann RJ, Tillman GE, Wise MG, Siragusa GR, Hiett KL, Seal BS. 2013. The poultry-associated microbiome: network analysis and farm-to-fork characterizations. PLoS One 8:e57190. doi: 10.1371/journal.pone.0057190. [DOI] [PMC free article] [PubMed] [Google Scholar]
- 28.Torok VA, Hughes RJ, Mikkelsen LL, Perez-Maldonado R, Balding K, MacAlpine R, Percy NJ, Ophel-Keller K. 2011. Identification and characterization of potential performance-related gut microbiotas in broiler chickens across various feeding trials. Appl Environ Microbiol 77:5868–5878. doi: 10.1128/AEM.00165-11. [DOI] [PMC free article] [PubMed] [Google Scholar]
- 29.Fujisawa T, Shirasaka S, Watabe J, Mitsuoka T. 1984. Lactobacillus aviarius sp. nov.: a new species isolated from the intestine of chickens. Syst Appl Microbiol 5:414–420. doi: 10.1016/S0723-2020(84)80042-9. [DOI] [Google Scholar]
- 30.Shivaprasad HL. 2016. Gangrenous dermatitis in poultry, p 255–264. In Uzal FA, Songer JG, Prescott JF, Popoff MR, Clostridial diseases in animals. John Wiley and Sons, Inc, Hoboken, NJ. [Google Scholar]
- 31.Borst LB, Suyemoto MM, Sarsour AH, Harris MC, Martin MP, Strickland JD, Oviedo EO, Barnes HJ. 2017. Pathogenesis of enterococcal spondylitis caused by Enterococcus cecorum in broiler chickens. Vet Pathol 54:61–73. doi: 10.1177/0300985816658098. [DOI] [PubMed] [Google Scholar]
- 32.Dho-Moulin M, Fairbrother JM. 1999. Avian pathogenic Escherichia coli (APEC). Vet Res 30:299–316. [PubMed] [Google Scholar]
- 33.Blackall PJ. 1999. Infectious coryza: overview of the disease and new diagnostic options. Clin Microbiol Rev 12:627–632. [DOI] [PMC free article] [PubMed] [Google Scholar]
- 34.Wang Q, Chang BJ, Riley TV. 2010. Erysipelothrix rhusiopathiae. Vet Microbiol 140:405–417. doi: 10.1016/j.vetmic.2009.08.012. [DOI] [PubMed] [Google Scholar]
- 35.Persson G, Bojesen AM. 2015. Bacterial determinants of importance in the virulence of Gallibacterium anatis in poultry. Vet Res 46:57. doi: 10.1186/s13567-015-0206-z. [DOI] [PMC free article] [PubMed] [Google Scholar]
- 36.van Empel PCM, Hafez HM. 1999. Ornithobacterium rhinotracheale: a review. Avian Pathol 28:217–227. doi: 10.1080/03079459994704. [DOI] [PubMed] [Google Scholar]
- 37.Stanley D, Hughes RJ, Geier MS, Moore RJ. 2016. Bacteria within the gastrointestinal tract microbiota correlated with improved growth and feed conversion: challenges presented for the identification of performance enhancing probiotic bacteria. Front Microbiol 7:187. doi: 10.3389/fmicb.2016.00187. [DOI] [PMC free article] [PubMed] [Google Scholar]
- 38.Sebaihia M, Preston A, Maskell DJ, Kuzmiak H, Connell TD, King ND, Orndorff PE, Miyamoto DM, Thomson NR, Harris D, Goble A, Lord A, Murphy L, Quail MA, Rutter S, Squares R, Squares S, Woodward J, Parkhill J, Temple LM. 2006. Comparison of the genome sequence of the poultry pathogen Bordetella avium with those of B. bronchiseptica, B. pertussis, and B. parapertussis reveals extensive diversity in surface structures associated with host interaction. J Bacteriol 188:6002–6015. doi: 10.1128/JB.01927-05. [DOI] [PMC free article] [PubMed] [Google Scholar]
- 39.Ruiu L, Satta A, Floris I. 2014. Administration of Brevibacillus laterosporus spores as a poultry feed additive to inhibit house fly development in feces: a new eco-sustainable concept. Poult Sci 93:519–526. doi: 10.1093/ahr/119.2.519. [DOI] [PubMed] [Google Scholar]
- 40.Wei S, Morrison M, Yu Z. 2013. Bacterial census of poultry intestinal microbiome. Poult Sci 92:671–683. doi: 10.3382/ps.2012-02822. [DOI] [PubMed] [Google Scholar]
- 41.Wei S, Lilburn M, Yu Z. 2016. The bacteriomes of ileal mucosa and cecal content of broiler chickens and turkeys as revealed by metagenomic analysis. Int J Microbiol 2016:4320412. doi: 10.1155/2016/4320412. [DOI] [PMC free article] [PubMed] [Google Scholar]
- 42.Caporaso JG, Lauber CL, Walters WA, Berg-Lyons D, Huntley J, Fierer N, Owens SM, Betley J, Fraser L, Bauer M, Gormley N, Gilbert JA, Smith G, Knight R. 2012. Ultra-high-throughput microbial community analysis on the Illumina HiSeq and MiSeq platforms. ISME J 6:1621–1624. doi: 10.1038/ismej.2012.8. [DOI] [PMC free article] [PubMed] [Google Scholar]
- 43.Gilbert JA, Meyer F. 2012. Modeling the earth microbiome. Microbe 7:64–69. [Google Scholar]
- 44.Gohl DM, Vangay P, Garbe J, MacLean A, Hauge A, Becker A, Gould RJ, Clayton JB, Johnson TJ, Hunter R, Knights D, Beckman KB. 25 July 2016. Systematic improvement of amplicon marker gene methods for increased accuracy in microbiome studies. Nat Biotechnol https://www.nature.com/articles/nbt.3601. [DOI] [PubMed]
- 45.Caporaso JG, Kuczynski J, Stombaugh J, Bittinger K, Bushman FD, Costello EK, Fierer N, Peña AG, Goodrich JK, Gordon JI, Huttley GA, Kelley ST, Knights D, Koenig JE, Ley RE, Lozupone CA, McDonald D, Muegge BD, Pirrung M, Reeder J, Sevinsky JR, Turnbaugh PJ, Walters WA, Widmann J, Yatsunenko T, Zaneveld J, Knight R. 2010. QIIME allows analysis of high-throughput community sequencing data. Nat Methods 7:335–336. [DOI] [PMC free article] [PubMed] [Google Scholar]
- 46.Edgar RC. 2010. Search and clustering orders of magnitude faster than BLAST. Bioinformatics 26:2460–2461. doi: 10.1093/bioinformatics/btq461. [DOI] [PubMed] [Google Scholar]
- 47.Haas BJ, Gevers D, Earl AM, Feldgarden M, Ward DV, Giannoukos G, Ciulla D, Tabbaa D, Highlander SK, Sodergren E, Methé B, DeSantis TZ, Petrosino JF, Knight R, Birren BW. 2011. Chimeric 16S rRNA sequence formation and detection in Sanger and 454-pyrosequenced PCR amplicons. Genome Res 21:494–504. doi: 10.1101/gr.112730.110. [DOI] [PMC free article] [PubMed] [Google Scholar]
- 48.Lozupone C, Knight R. 2005. UniFrac: a new phylogenetic method for comparing microbial communities. Appl Environ Microbiol 71:8228–8235. doi: 10.1128/AEM.71.12.8228-8235.2005. [DOI] [PMC free article] [PubMed] [Google Scholar]
- 49.McDonald D, Price MN, Goodrich J, Nawrocki EP, DeSantis TZ, Probst A, Andersen GL, Knight R, Hugenholtz P. 2012. An improved Greengenes taxonomy with explicit ranks for ecological and evolutionary analyses of bacteria and archaea. ISME J 6:610–618. doi: 10.1038/ismej.2011.139. [DOI] [PMC free article] [PubMed] [Google Scholar]
- 50.Zakrzewski M, Proietti C, Ellis JJ, Hasan S, Brion MJ, Berger B, Krause L. 2017. Calypso: a user-friendly web-server for mining and visualizing microbiome-environment interactions. Bioinformatics 33:782–783. [DOI] [PMC free article] [PubMed] [Google Scholar]
- 51.Anders S, Huber W. 2010. Differential expression analysis for sequence count data. Genome Biol 11:R106. doi: 10.1186/gb-2010-11-10-r106. [DOI] [PMC free article] [PubMed] [Google Scholar]
- 52.Wickham H. 2009. ggplot2: elegant graphics for data analysis. Springer-Verlag, New York, NY. [Google Scholar]
Associated Data
This section collects any data citations, data availability statements, or supplementary materials included in this article.
Supplementary Materials
Data Availability Statement
All raw data and associated metadata from this project are freely available through the University of Minnesota Digital Conservancy's Data Repository for the U of M (DRUM; https://doi.org/10.13020/D63T10).


