In the original supplemental Table 3, the primers listed for Peli1, Irf8, Ccl22, and Malt1 were used only to generate data shown in Figure 5. Data shown in Figures 1-3 were generated with gene-specific primers of different sequences, designated with an “a” in the revised supplemental Table 3. The primers listed in the original supplemental Table 3 are now designated with a “b” in the revised supplemental Table 3. Primers irf8-a and ccl22-a used for Figures 1-3 amplify a region within the 3′ untranslated region of Irf8 and Ccl22 RNA, respectively. Primers malt1-a and peli1-a amplify regions in partially processed transcripts denoted in the National Center for Biotechnology Information gene repository as “retained introns” (see revised supplemental Table 3 for accession numbers). Primers denoted “b” for these 4 genes amplify fragments of spliced transcripts only, with forward and reverse primers binding to separate exons. Although primer sets “a” and “b” yield comparable results for the abundance of Irf8, Ccl22, Malt1, and Peli1 transcripts in cultured RAW cells and mouse tissues, data generated with primer set “a” cannot be interpreted to indicate the prevalence of fully processed messenger RNA (mRNA) or the abundance of protein product translated from such mRNAs and hence should be considered biomarkers only. The supplemental table has been corrected in the online version of the article.
Figure 5.
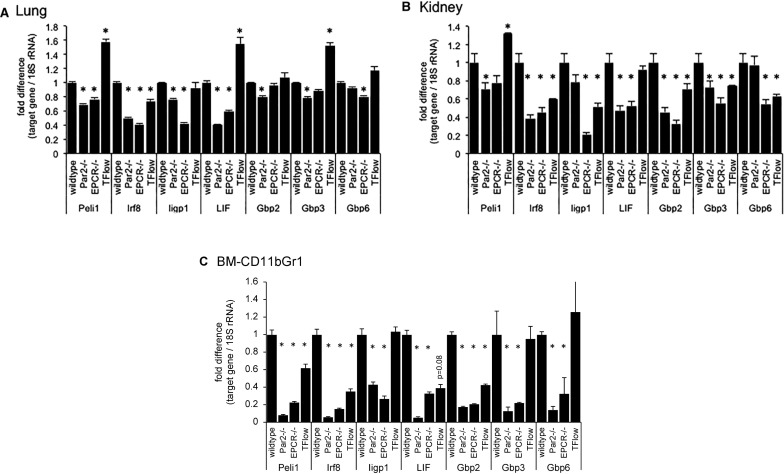
Attenuated interferon-regulated gene expression in the bone marrow and peripheral organs of LPS-challenged mice. Semiquantitative measurement of the indicated mRNAs relative to 18S rRNA by RT-PCR in (A) total lung, (B) kidney tissue, and (C) FACS-enriched bone marrow resident Gr1CD11bPOS cells of wild-type mice, mice lacking PAR2 or EPCR, and from TFLOW mice with reduced hematopoietic cell TF expression. Data are expressed as the fold increase relative to LPS-challenged wild-type mice and represent the average ± standard deviation from triplicate measurements of a single pooled sample generated by combining equal amounts of RNA prepared from 4 individual mice before reverse transcription (for lung and kidney tissue) or from 1 sample of RNA prepared from Gr1CD11bPOS cells isolated via FACS from the pooled bone marrows of 5 mice each. *P < .05 compared with wild-type controls.
On page 2852 in the 30 April 2015 issue, data shown in Figure 5C contained calculation errors for the levels of LIF, Gbp2, and Gbp6. Correction of these errors results in small changes in levels of LIF in TFLOW mice (with loss of significance) and levels of Gbp2 and Gbp6 in Par2−/− and EPCR−/− mice (with no change of significance). The corrected Figure 5 is shown below.
The authors apologize for these errors. The errors have been corrected in the online version, which now differs from the print version.
Supplementary Material
The online version of this article contains a data supplement.
Associated Data
This section collects any data citations, data availability statements, or supplementary materials included in this article.


