

SUMMARY
Bacteriophage-encoded genetic elements control bacterial biological functions. Enterohemorrhagic Escherichia coli (EHEC) strains harbor lambda-phages encoding the Shiga-toxin (Stx), which is expressed during the phage lytic cycle and associated with exacerbated disease. Phages also reside dormant within bacterial chromosomes through their lysogenic-cycle but how this impacts EHEC virulence remains unknown. We find that during lysogeny the phage transcription factor, Cro, activates the EHEC type III secretion system (T3SS). EHEC lambdoid phages are lysogenic under anaerobic conditions when Cro binds to and activates the promoters of T3SS genes. Interesting, the Cro sequence varies among phages carried by different EHEC outbreak strains, and these changes affect Cro-dependent T3SS regulation. Additionally, infecting mice with the related pathogen C. rodentium harboring the bacteriophage cro from EHEC results in greater T3SS gene expression and enhanced virulence. Collectively, these findings reveal the role of phages in impacting EHEC virulence and their potential to affect outbreak strains.
Keywords: Enterohemorrhagic E. coli (EHEC), bacteriophage, Shiga toxin, locus of enterocyte effacement (LEE), pathogenicity islands, gene regulation
In Brief
Hernandez-Doria et al. demonstrated that Enterohemorrhagic Escherichia coli (EHEC) associates with bacteriophages, which reside dormant (lysogeny) under anaerobic conditions. While lysogenic, bacteriophages produce a protein, Cro that either activates or represses virulence factors amongst different EHEC strains and thus could impact EHEC virulence during outbreaks.
INTRODUCTION
Bacterial-bacteriophage associations can be either detrimental to the bacterial cell, or drive the evolution of fitness through the acquisition of new genetic material. The association of Escherichia coli with lambdoid phages has been extensively studied. Lambdoid phages can silently integrate within the E. coli chromosome establishing a lysogenic life cycle, or replicate and lyse the bacterial cells through their lytic cycle. Based upon external stimulus, phages launch a regulatory cascade that involves multiple stages inside E. coli (Friedman and Court, 2001; Little et al., 1999). The interplay between the phage-encoded repressor CI and the anti-repressor Cro proteins, constitute the genetic switch that determines whether the phage becomes lytic or lysogenic (Little et al., 1999). Phage replication is initiated by an anti-terminator protein N, which recruits RNA polymerase and several E. coli proteins designated as N utilization substance (Nus) (Friedman and Court, 2001). A second anti-terminator protein, Q, controls expression of the late genes, where the stx genes have been inserted in Stx-encoding lambdoid phages in EHEC (Neely and Friedman, 1998). Within the phage late genes, downstream of stx, are the genes encoding the lysis proteins S and R (Neely and Friedman, 1998) (Figure 1A).
Figure 1. EHEC 86–24 harbors a lysogenic Stx-2 encoding lambdoid phage.

(A) Cartoon describing the lambdoid phage gene architecture where N is the earlier anti-terminator gene responsible to control the phage replication cI and cro genes, which are key players on whether the phage remains lysogenic or becomes lytic. The middle anti-terminator Q controls expression of the stxA and stxB genes encoding Shiga toxin 2 and the SR genes that encode for endolysins.
(B) Western blots of RecA in whole-cell lysates of EHEC 8624 grown in LB aerobic, DMEM anaerobic and DMEM aerobic conditions at 37°C. RpoA levels serves as a loading control.
(C) qRT-PCR expression of the EHEC Δ86–24 phage transcriptional factor cI (6h).
(D) qRT-PCR expression of the EHEC Δ86–24 phage transcriptional factor cro (6h).
(E) qRT-PCR expression of recA. The rpoA gene was used as an internal control (6h). All (C–E) RNA was extracted from 3 biological samples, and each was run in triplicate with a total of 9 data points per sample. (**) indicates statistical significance at P<0.01 (Error bars, standard deviation, Student’s t-test). EHEC was grown under anaerobic conditions in DMEM low glucose (0.1% glucose), or in DMEM high glucose (0.4% glucose) without mitomycin C, or EHEC grown in DMEM low glucose with mitomycin-C (Mitomycin-C).
(F) Growth curves of EHEC 8624 in LB-mitomycin C, LB-glucose, DMEM low glucose anaerobic and DMEM low glucose aerobic. The experiments were conducted with 9 biological replicates. Data are represented as mean ± SEM. Arrow is when mytomycin C was added.
(G) Bacteriophage particles isolated from EHEC 8624 using PEG8000 under the same growth conditions described above, and PCR reaction was conducted targeting the stx2A gene (900 bp). Mock is DMEM low glucose alone
(H) Negative staining of bacteriophages from EHEC 8624(Stx2A), and E. coli W3350 (lambda) cultures treated with mitomycin C, precipitated with PEG8000 and resuspended in SM buffer. Images were acquired on a tecnai G’spirit EMC. See also Figure S1 and Figure S2.
The switch from the lysogenic to lytic cycle occurs through detection of bacterial DNA damage, with an important insult being the result of antibiotic treatments that target DNA replication. DNA damage induces the SOS response. Once SOS is activated, the repair protein RecA induces the cleavage of the phage CI repressor, which prompts Cro to bind the vacated DNA so the anti-terminator N can allow transcription of the middle and late phage genes, initiating phage replication towards a productive lytic cycle (Little et al., 1999). During the lysogenic cycle, however, CI is not degraded, maintaining phage integration within the bacterial genome (Little et al., 1999).
The life cycle of lambdoid phages affects the outcome of EHEC infections (Tyler et al., 2013). EHEC is a foodborne pathogen, which causes outbreaks of bloody diarrhea world-wide that can progress to the deadly hemolytic uremic syndrome (HUS) (Kaper and O’Brien, 2014; Wagner et al., 2001). The interaction between bacteriophages and EHEC exacerbates disease outcomes, mainly due to the controversial use of antibiotics to treat EHEC infections (Kaper and O’Brien, 2014). Under such circumstances, there is the onset of a SOS response that leads to activation of the phage lytic cycle. Together with the expression of the late phage genes, stx is expressed and the toxin released, which can lead to renal failure and development of HUS (Tyler et al., 2013; Waldor and Friedman, 2005). However, whether a lysogenic phage affects EHEC gene regulation and virulence remains unknown. Moreover, variations and or combinations of acquisitions of these lamboid phages can differentially impact the virulence potential of EHEC outbreak strains. EHEC strains can harbor one or more Stx-encoding prophages. There are two main types of Stxs, Stx1 and Stx2, and EHEC strains can encode for Stx1, or Stx2, or both. It is noticeable that strains encoding Stx2 are more pathogenic than strains encoding either Stx1, or both toxins (Melton-Celsa, 2014).
The current view asserts that phages become lytic due to a myriad of insults including temperature, pH, growth media conditions and antibiotic treatment (Muniesa et al., 2003; Tyler et al., 2013; Zong et al., 2010). Notwithstanding, the majority of these observations were generated using rich media (Luria-Bertani, LB) and aerobic conditions. Neither of which reflect the environment in which pathogenic enteric bacteria (i.g. EHEC, and Citrobacter rodentium that is a murine pathogen utilized as a surrogate infection model for EHEC) express virulence factors such as the T3SS. The T3SS is a syringe-like apparatus utilized to colonize the gut and induce hemorrhagic colitis. The genes that encode the T3SS are contained within a horizontally acquired pathogenicity island (PAI), the locus of enterocyte effacement (LEE) (Jarvis et al., 1995; McDaniel et al., 1995). Typically, LEE expression by EHEC and C. rodentium is achieved in vitro using Dulbecco Modified Eagle Medium (DMEM), a poorer nutritional medium compared to LB (Hughes et al., 2009). Meanwhile, in vivo EHEC and C. rodentium can be found in the luminal content of the mammalian colon (Kaper and O’Brien, 2014; Mallick et al., 2012), which is nutrient-complex and predominantly anaerobic whence nutritional fluctuations modulate LEE expression (Curtis et al., 2014b; Njoroge et al., 2012b; Pacheco et al., 2012). Indeed, regulation of LEE expression is complex and integrates inter-kingdom signals including host hormones, bacterial autoinducers and host-derived sugars (Hughes et al., 2009; Njoroge et al., 2012b; Pacheco et al., 2012; Sperandio et al., 2003). Thus, there is a requirement to understand how the lysogenic cycle of phages from EHEC cope with scanty nutritional conditions and anaerobic environments to coordinate LEE expression. Given the extensive inter-kingdom associations between bacterial-phage and bacterial-mammalian host that drive EHEC and C. rodentium pathogenesis, we sought to investigate whether phage transcription factors exert regulation over LEE expression under in vitro and in vivo conditions.
We show that anaerobic and nutritional deficient conditions favor the phage lysogenic cycle in vitro. We were also unable to detect phage particles during EHEC’s growth under these conditions. Deletion of several key bacteriophage regulatory genes in EHEC led to decreased expression of the LEE-encoded T3SS. Furthermore, we characterized the mechanism by which the bacteriophage transcription factor Cro serves as a transcriptional activator of the LEE in EHEC during in vitro growth. Cro also activates expression of the LEE gene espA in C. rodentium during murine infection. Finally, we show that varying Cro proteins carried by different EHEC outbreak strains differently regulate expression of the LEE. Together, our findings indicate that lysogenic bacteriophages modulate virulence gene expression of an enteric pathogen and affect the prognosis of disease.
RESULTS
The EHEC Stx-phage is lysogenic under anaerobic conditions
Previous phage studies established multiple procedures to induce the SOS pathway including aerobic growth in the nutrient rich LB media, followed by antibiotic mitomycin C treatment (Muniesa et al., 2004; Muniesa et al., 2003; Teel et al., 2002). Under these conditions, EHEC overproduces RecA that promotes CI cleavage, and favors expression of cro, which ultimately promotes the initiation of the lytic cycle (Fuchs et al., 1999). Accordingly, we observed that EHEC constitutively produces RecA under aerobic growth in LB, whereas it decreases RecA production under anaerobic growth in DMEM. The decrease in RecA expression between these two growth conditions is mostly dictated by oxygen tension, with RecA expression in DMEM under aerobic growth being similar to LB under aerobiosis (Figure 1B). A similar pattern for RecA expression in E. coli K-12 was also observed (Figure S1A). Because anaerobic growth in DMEM is conducive for LEE gene expression in vitro, which correlates with LEE expression during mammalian infection (Curtis et al., 2014a), this prompted us to further evaluate different growth conditions anaerobically. Moreover, it is worth noting that the intestinal lumen is an anaerobic environment (Albenberg et al., 2014; Zheng et al., 2015). Given the crucial role of cI and cro over the lytic-lysogenic phage cycle switch, their transcription profiles were evaluated during anaerobic growth in DMEM. Our data are congruent with previous reports that in the presence of mitomycin C, there is down-regulation of cI and up-regulation of cro in EHEC (Figures. 1C, D). However, in the absence of mitomycin C, we still detect expression of both cI and cro (Figures 1C,D). Because LEE gene expression is increased in low glucose DMEM (0.1% glucose), and decreased in high glucose DMEM (0.4% glucose) due to its activation by gluconeogenesis (Njoroge et al., 2012a), we also investigated the role of glucose concentration in cI and cro expression. Different glucose concentrations did not affect expression of cro, but in contrast to LEE gene expression, cI expression is increased in high glucose under conditions of anaerobiosis (Figures 1C,D). Expression of recA contrasted with cI expression, being higher in low glucose (Figure 1E).
We hypothesized that different growth conditions affect entrance into the lytic cycle and production of phage particles. To enable detection of phage particles, we conducted initial growth curves using different media conditions where it was found that EHEC behaves similarly as reported elsewhere when growing aerobically in LB mytomicin C and LB (Muniesa et al., 2003). In the absence of mytomicin C there is no decrease of growth and lysis during growth in LB, but lysis occurs in the presence of mytomicin C (Figure 1F). We also did not observe lysis during growth in DMEM aerobically or anaerobically in the absence of mytomicin C (Figure 1F). Again, similar growth and lysis patterns were observed between EHEC and E. coli K-12 strain W3350, which is the strain in which most classic lambda studies were performed (Figure S1B). We also isolated phage particles from supernatants using PEG8000 precipitation and performed PCR to detect the stx2 phage genes as a marker for these phages. As expected we detected stx2 containing phage particles upon mytomicin C treatment of EHEC grown aerobically in LB, but also detected particles in the absence of mytomicin C treatment (Figure 1G). However, we isolated very few particles under DMEM aerobic growth, and could not detect them under anaerobic growth (Figure 1G). Collectively, these results indicate that during anaerobic growth conditions the EHEC Stx-lambdoid-like phage can remain lysogenic and still express both cI and cro. In E. coli K-12 phage particles (using the cro gene as the detection marker) were exclusively detected under mytomicin C treatment (Figure S1C), suggesting that even during growth in LB, one can already observe differences in phage behaviours between EHEC Stx-lamboid-like phages and classic K-12 lambda phages.
We could not detect phage plaques in lawns of E. coli K-12 DH5α treated with EHEC supernatants, even when mitomycin C was used (Figure S2A). Conversely, supernatants from K-12 containing standard phage lambda formed thousands of plaques on DH5α (Figure S2B). The lack of plaque formation on E. coli K-12 by phages from EHEC has been previously documented, suggesting that the Stx-EHEC lambdoid-like phages differ from the classic E. coli K-12 lambda phages (Islam et al., 2012; McDonald et al., 2010). Electron microscopy of EHEC lambdoid-like and K-12 classic lambda phages (Figure 1H) show that both contain similar phage capsids as previously reported (Beutin et al., 2012; Zeng et al., 2010; Zong et al., 2010). However, there are clear differences regarding tail length between EHEC Stx-lambdoid-like and classic lambda phages (Figure 1H).
To investigate whether the EHEC Stx-lambdoid phage could transduce into K-12 but could not lyse these cells, we tagged the phage using a Flag epitope within the Rz gene from the EHEC Stx-phage, which is a non-essential phage gene. RZ is located downstream of the lysis genes SR. Between the rz-flag and bor genes a kanamycin resistant gene was introduced as a selection marker (Figure S2C). Rz-Flag was expressed when EHEC was grown in LB, and its expression was highly prominent under treatment with mytomicin C (Figure S2D). Again Rz-Flag expression was undetectable under growth in DMEM under anaerobiosys (Figure S2D), suggesting that under these growth conditions the late phage genes are not expressed, and the phage remains lysogenic. Transduction of E. coli K-12 DH5α with supernatants of EHEC grown in LB mytomycin C yielded kanamycin resistant DH5α strains, which also harbored the Stx-phage (Figure S2E). However, they did not express Rz-Flag (Figure S2F), suggesting that the EHEC-Stx-lambdoid phage can infect K-12 E. coli, but cannot enter into a productive lytic cycle to promote plaque formation in this strain.
Deletions of bacteriophage genes affect expression of the EHEC T3SS
We next asked whether different ancillary bacteriophage genes could influence LEE gene expression in EHEC. Typical phage genome architecture includes the anti-terminator N gene, followed by cI and cro, the middle anti-terminator Q, and the lytic genes S and R (Figure 1A). The role of these genes is well characterized under the phage lytic cycle that promotes Stx2 production (Little et al., 1999; Neely and Friedman, 1998; Wagner et al., 2001). However, little is known on whether these genes influence LEE gene expression under lysogenic conditions. Mutations in N, Q and SR should not lead to bacterial cell lysis. Indeed, growth curves of these mutants in the presence of mitomycin C did not lead to bacterial lysis, while lysis was observed in wild-type EHEC (Figure S3). LEE gene expression (measured by expression of the ler, tir, sepL and espA LEE genes) was decreased in deletion mutants for the N, Q and SR phage genes, and this phenotypes could be complemented with these genes in trans (Figures 2A,B). The LEE encoded T3SS drives the formation of lesions on enterocytes referred to as attaching and effacing (AE) lesions. The hallmark of AE lesions are the effacement of the microvilli, and the rearrangement of the cytoskeleton forming a pedestal-like structure that cups the bacterium (Kaper et al., 2004). Congruent with decreased LEE gene expression in these mutants (Figures 2A,B), we observed decreased AE lesion (pedestal) formation in the N, Q and SR mutants compared to wild-type (WT) (Figures 2C,D). These genes are phage transcription anti-terminators and lytic proteins, and they influence expression of the phage transcription factors CI and Cro (Svenningsen and Semsey, 2014), which play a crucial regulatory role in the genetic switch that regulates the phage life cycle and expression of Stx. Because regulation of the LEE was occurring at the transcriptional level (Figure 2A), we investigated whether CI and Cro were involved in the regulation of the LEE genes. We were unsuccessful to obtain a cI EHEC knockout, which is not surprising due to the vital role that this gene has on preserving the lysogenic cycle, and consequently bacterial viability. Therefore, a mutation in cI implies that the bacteriophage would always be lytic. Nonetheless, we obtained a mutant of cro, which does not promote bacterial cell lysis (Figure S3). An EHEC Δcro depicted decreased LEE expression (Figure 3A and B) and AE lesion formation (Figure 3C and D). Hence, the lambdoid phage encoded Cro can influence the expression of genes within another horizontally acquired genetic element, the LEE PAI. Taken together, these results support that phage regulation of LEE expression in EHEC occurs while the phage is lysogenic.
Figure 2. Lambdoid prophage genes control LEE expression in EHEC 86–24.

(A) qRT-PCR of LEE genes (ler, tir, sepL and espA) from RNA extracted from EHEC (WT, ΔN, ΔQΔΔSR, and complemented strains) grown under anaerobic conditions in DMEM low glucose. (n=6, error bars, standard deviation, P<0.01)
(B) Western blot for of the LEE-encoded and T3SS secreted protein EspA from secreted proteins of EHEC (WT, ΔN, ΔQΔΔSRΔespA and complemented strains) grown under anaerobic conditions in DMEM low glucose. Bovine serum albumin (BSA) was used as loading control.
(C) Fluorescent actin staining assay (FAS) depicting attaching and effacement (AE) lesions of EHEC (WT, ΔN, ΔQ and ΔΔSR) on infected HeLa cells. After 6 hours, cells were fixed, stained with FITC-phalloidin (actin in green) and propidium iodide (bacteria and HeLa DNA in red) and observed with fluorescence microscopy.
(D) Quantification of FAS, log transformation pedestal/cell numbers of WT EHEC, ΔN, ΔQ and ΔΔSR on Hela cells (n=150, error bars, standard deviation, P<0.01). Subjects with asterisks (**) indicates statistical significance at P<0.01 (Error bars, standard deviation, Student’s t-test). See also Figure S3.
Figure 3. The EHEC 86–24 lambdoid phage Cro activates the LEE.

(A) qRT-PCR gene of LEE genes (ler, tir, sepL and espA) from RNA extracted from EHEC (WT, Δcro, and complemented strain) grown under anaerobic conditions in DMEM low glucose. (n=6, error bars, standard deviation, P<0.01).
(B) Western blot for of the LEE-encoded and T3SS secreted protein EspA from secreted proteins and whole cell lysates of EHEC (WT, Δcro, ΔespA, and Δcro complemented [Δcro-pcro]) grown under anaerobic conditions in DMEM low glucose. Bovine serum albumin (BSA) was used as loading control for secreted proteins, and αRpoA was the loading control for whole cell lysates.
(C) FAS assay showing AE lesions in EHEC WT, Δcro and complemented mutant on infected HeLa cells.
(D) Quantification of FAS Log transformation of pedestal/count numbers in EHEC WT, mutants and complemented strains on infected HeLa cells (n=150, Error bars, standard deviation, P<0.01). Subjects with asterisks (**) indicates statistical significance at P<0.01 (Error bars, standard deviation, Student’s t-test). See also Figure S3.
Sequence variations on Cro differentially affect LEE expression
The Cro family of proteins is well characterized and exhibit a high degree of diversity (Hall et al., 2011). Cro in the prototypical K-12 lambda bacteriophage represses expression of cI to promote the switch to the lytic cycle (Friedman and Court, 2001; Johnson et al., 1981). Clustal Omega alignments show that EHEC Cro proteins (from lambdoid phages encoding Stx) are highly diverse at the amino acid level from the prototypical K-12 lambda phage Cro, as well as within different strains of EHEC that were responsible for different outbreaks (Figure S4). Many of these changes occur on amino acid residues within Cro’s alpha helixes 2 and 3 that are known to be important for Cro-DNA associations (Tochio et al., 1999) (Figure S4). To understand how Cro interacts with and activates the LEE, we utilized electrophoretic mobility shift assays (EMSAs). The LEE genes are transcriptionally activated by the master regulator, Ler (Mellies et al., 1999; Sperandio et al., 2000). The ler gene possess a large regulatory region with its transcription being driven by two promoters (P1 and P2) (Mellies et al., 2007; Russell et al., 2007b). The EHEC strain we used in these studies, is strain 86–24, which harbors only one Stx2-encoding lambdoid-phage (Cro-BP-4795) (Figure S4). Cro from the prototype EHEC strain 86–24 directly binds to the ler promoter using up to 410 nM concentrations of this protein (Figure 4A), which is comparable to similar studies conducted on λ phage Cro (Hall et al., 2011). We also show that Cro activates the ler promoter using ler-lacZ transcriptional fusions in E. coli K-12 MC4100 (Figure S4A). Given the amino acid differences among Cro proteins from different phages of EHEC strains (Figure S4), we evaluated whether Cro proteins from EHEC Sakai and EDL933 strains also directly bound to the ler promoter. Noticeably, Cro from EHEC Sakai phage ΦVT-Stx2 (Cro-Stx2-Sakai) was not able to bind to the ler promoter, whereas the EDL933 Cro from phage Φ933W (Cro-Stx2-EDL933) shifted the ler probe (Figure 4B). Although λ phage from commensal E. coli and lambdoid phages from EHEC share a common genome arrangement, their functions are clearly distinctive (Hall et al., 2011; Svenningsen et al., 2005; Waldor and Friedman, 2005). To confirm the previous observations with the different EHEC phage Cro proteins, complementation experiments were conducted on EHEC 86–24 Δcro. Cro-Stx2-EDL933 was capable to restore the expression of ler, while Cro-Stx2-Sakai did not (Figure 4C), which is in agreement with the EMSA studies showing that EDL933 Cro binds to the ler promoter while Sakai’s Cro does not (Figure 4B). These data indicate that Cro-stx2-EDL933 can work as a transcriptional activator of the LEE in a similar way to 86–24 Cro.
Figure 4. Lambdoid phages Cro regulation of LEE gene expression.

(A) Electrophoretic mobility shift assay (EMSA) of Cro from EHEC strain 86–24 forming a complex with the EHEC ler probe at increasing amounts of protein form 0 to 410 nM. Kan probe was used as negative control, and Or region from bacteriophage 8624 located between the cI and cro genes was used as a positive control.
(B) EMSAs with Cro from EHEC strains Sakai and EDL933 with the EHEC ler probe at increasing amounts of protein form 0 to 4010 nM. Kan probe was used as negative control.
(C) Complementation qRT-PCR experiments in EHEC 86–24 Δcro. The cro genes were PCR amplified from EHEC Sakai and EDL933 strains targeting cro genes from phages ΔVT-Stx2 and BP-Δ933W respectively. The cro amplicons were cloned into a low copy plasmid, pWSK129, and introduced into 86–24 Δcro to generate Δcro-pSak (cro-ΔVT-Stx2) and Δcro-pEdl (cro-BP-Δ933W). RNA was extracted from the strains grown anaerobically in DMEM to an OD600 of 0.6 (n=6, error bars, standard deviation).
(D) Western blot of the LEE-encoded and T3SS secreted protein EspA from secreted proteins of EHEC EDL933 (WT, ΔcroStx2, ΔcroStx1ΔcroCryptic, ΔΔcroStx2-Stx1, ΔΔcroStx2-Cryptic, ΔΔΔcroStx2-Stx1-Cryptic) grown under anaerobic conditions in DMEM low glucose. Bovine serum albumin (BSA) was used as loading control.
(E) qRT-PCR of the virulence LEE genes ler and espA in EDL933 cro mutations. RNA was extracted from the strains grown anaerobically in DMEM to an OD600 of 0.6 (n=6, error bars, standard deviation, P<0.01 **).
(F) Western blot of the LEE-encoded and T3SS secreted protein EspA from secreted proteins of EHEC Sakai (WT, ΔcroStx2, ΔcroStx1ΔcroCryptic, ΔΔcroStx2-Stx1, ΔΔcroStx2-Cryptic) grown under anaerobic conditions in DMEM low glucose. Bovine serum albumin (BSA) was used as loading control. See also Figure S4.
The varied ability of Cro proteins from different lamboid phages to bind to and activate transcription of ler from EHEC 86–24, led us to investigate the role of these proteins endogenously in the host EHEC strains for these phages. EHEC strains EDL933 and Sakai harbor three lamboid prophages, and encode for three Cro proteins. Two of these phages encode for Stx1 and Stx2, while the third phage is cryptic and does not encode this toxin, but encodes a Cro protein. We generated single, double and triple cro mutants in strains EDL933 and Sakai, and investigated LEE gene expression using Western blots for the LEE-encoded and type III secreted protein EspA. In EDL933 deletion of cro-Stx2 did not affect EspA expression, while deletion of cro-Stx1 or cro-cryptic increased EspA expression (Figure 4D). Hence, in EDL933 Cro-Stx2 does not affect LEE gene expression, while Cro-Stx1 and Cro-Cryptic repress it. Double deletions of cro-Stx2/ cro-Stx1, and cro-Stx2/ cro-cryptic presented enhanced EspA expression, but to a lesser degree than the single mutants, suggesting that Cro-Stx2 antagonizes the repressive effect of the other two Cro proteins. The triple mutant expressed EspA to similar levels to WT (Figure 4D). These results were also corroborated by qRT-PCR (Figure 4E). In the Sakai strain, deletion of cro-Stx2 decreased EspA expression, while deletion of the other two cro genes had no effect (Figure 4F). Double deletions of cro-Stx2/cro-Stx1 and cro-Stx2/cro-cryptic led to decreased EspA expression (Figure 4F). Consequently, in the Sakai strain only the Cro-Stx2 exert regulation of the LEE, promoting activation of LEE gene expression.
Cro also regulates expression of genes in the core genome
Inasmuch as Cro is directly regulating expression of genes in one of EHEC’s PAIs, we investigated whether other chromosomal or PAI genes were regulated by Cro in EHEC 8624. Transcriptomic studies uncovered the Cro regulon in EHEC revealing that Cro activates expression of 584 genes, and represses expression of 307 genes (Figure S5A,B) (GEO database number GSE86271). As expected LEE gene expression was reduced in the absence of cro (Figure S5C). Additionally, Cro also activated a plethora of other virulence genes such as fimbria and flagella and motility (Figure S5D–G). Microbial mutualism is a general process that optimizes host adaptation to occupy ecological niches (Hussa and Goodrich-Blair, 2013). Here we contribute evidence that EHEC associates with a phage that when lysogenic can enhance its virulence capacity.
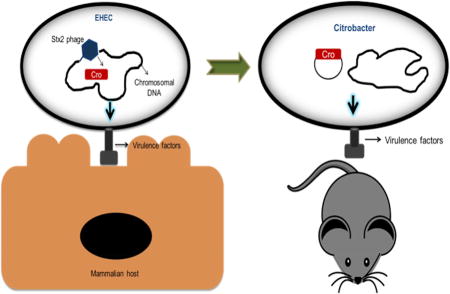
Cro augments C. rodentium virulence during murine infection
EHEC is a human pathogen that does not cause GI disease in rodents (Mallick et al., 2012). The natural murine pathogen C. rodentium, has been extensively used as a surrogate murine infection model for EHEC infection (Flowers et al., 2016). It harbors the same virulence genes as EHEC (i.e. the LEE), and also forms AE lesions on enterocytes (Deng et al., 2004; Mundy et al., 2003). However, the ler regulatory region of C. rodentium is different from EHEC. EHEC ler has two promoters, while in C. rodentium there is only one. Moreover, this regulatory region in C. rodentium is truncated to only 120bp, in contrast to 1,000bp in EHEC, due to an insertion sequence (IS66) (Figure 5A) (Russell et al., 2007a; Sperandio et al., 1999). To counteract this issue, we exchanged the C. rodentium strain DBS100 ler regulatory region for the EHEC strain 86–24 regulatory region, generating the C. rodentium strain, C.r-j11 (Figure 5A). We infected mice with WT C. rodentium DBS100, C. rodentium-j11 (C.r-j11 [of note this strain has the vector alone control, pWSK129, used to clone cro]) and C. rodentium-j11-pcro (C.r-j11-pcro), the later strain has the bacteriophage cro from EHEC 8624 expressed in trans cloned in plasmid pWSK129 (Figure 5) and monitored these animals for weight loss, which is a readout for pathogenesis, and survival. It is noticeable that the pcro plasmid could be detected in stools from these animals showing that there was no plasmid loss (Figure S6B). Mice infected with C. rodentium DBS100 did not lose weight during the first 7 days post-infection, while mice infected either with C.r-j11 or C.r-j11-pcro had substantial weight lost by day 7, with weight loss being more pronounced in mice infected with C.r-j11-pcro strain at day 7(Figure 5B–E). Additionally, mice infected with strains C.r-j11 or C.r-j11-pcro had significantly higher mortality than C. rodentium DBS100 (Figure S6B).
Figure 5. Cro augments mouse disease progression upon C. rodentium infection.

(A) Cartoon depicting the strategy utilized to exchange the EHEC ler promoter region to C. rodentium ler promoter region. The promoter was successfully exchanged using the λ recombination method, obtaining C.r-j11 and C.r-j11-pcro strains.
(B) Weight loss or gain from baseline (weight at day 0) over the course of infection (Blue: mock infected, Red: C. rodentium DBS100 wt, Purple: C. rodentium C.r-j11 pWSK129, and Green: C. rodentium C.r-j11-pcro) (n=10, error bars, standard deviation).
(C) Day 5 weight loss or gain statistical analysis comparing DBS100 against C.r-j11 pWSK129 and C.r-j11-pcro showing no statistical difference (NS).
(D) Day 6 weight loss or gain statistical analysis, comparing DBS100 against C.r-j11 pWSK129, and C.r-j11-pcro were depicting statistical difference at P<0.05.
(E) Day 7 weight loss or gain statistical analysis comparing DBS100 against C.r-j11pWSK129 and C.r-j11-pcro. The analysis shows statistical difference between DBS100 and C.r-j11-pcro (P<0.01), and no significance were observed comparing DBS100 and C.r-j11 pWSK129.
The nonparametric Mann-Whitney U test was used to determine the statistical significance using Graphpad prism software. See also Figure S6.
These results prompted us to conduct another experiment to delve deeper into the role of Cro during C. rodentium infection (Figure 6). Consistently with the previous experiment, mice began losing weight by day 6 (Figure 6B and C). Moreover, analysis of the ultrastructure of the distal colon showed AE lesion formation by all of the C. rodentium strains (Figure 6D); hence both C.r-j11 and C.r-j11-pcro strains are proficient for AE lesion formation on murine colonic enterocytes during infection. Expression of the LEE-encoded gene espA is similar between strains DBS100 and C.r-j11during murine infection, and is enhanced in strain C.r-j11-pcro, indicating that Cro is activating LEE gene expression during mammalian infection (Figure 6E). Initially the bacterial loads among the three strains was somewhat similar (Figure 6F), but animals infected with DBS100 had significantly higher bacterial loads than animals infected by strains C.r-j11 and C.r-j11-pcro by day 6 post-infection (Figure 6G). Altogether these data suggest that exchanging the ler regulatory region of C. rodentium by the EHEC regulatory region enhances C. rodentium pathogenesis, that Cro enhances LEE gene expression during murine infection, and that the enhancement in pathogenesis is not due to increased bacterial loads, but is due to transcriptional regulatory events of LEE gene expression.
Figure 6. Cro enhances the disease progression by increasing the T3SS expression.

(A) Cartoon depicting curse of the infection conducted with C. rodentium strains.
(B, C) Weight loss or gain from baseline over the first 6 days of infection showing the data from 3 independent experiments. Statistical analysis was conducted using Graphpad Prism software, Using nonparametric Mann-Whitnet U test where a P<0.05 (*) and P<0.01 (**) were considered significant (n=22, error bars, standard deviation).
(D) Ultra structure of the distal colon harvested 7 days postinfection from mock infected mice (PBS) and Citrobacter rodentium strains DBS100, C.r-j11 and C.r-j11-pcro. Microvilli destruction and AE lesions on the colonic epithelium can be appreciated. Original magnification of EMC 2900X.
(E) qRT-PCR of the C, rodentium T3SS gene espA at day 3 post-infection. Bacterial RNA was extracted from single fecal pellets from each individual mouse and relative expression calculations were conducted against parental C.rodentium DBS100 the experiments were conducted twice independently. Statistical analysis was conducted using Graphpad Prism software, Using nonparametric Mann-Whitnet U test where a P<0.05 (*) and P<0.01 (**) were considered significant (n=12, error bars, standard deviation).
(F) Bacterial burden of C. rodentium strains from feces at day 3 postinfection depicting statistical significance detected between groups P<0.01 (**) or non significant (NS) (n=12, error bars, standard deviation).
(G) Bacterial burden of C. rodentium strains from feces at day 6 postinfection where statistical significance was detected between groups P<0.001 (***) or non signifcant (NS). Data was obtained from two independent experiments, log transformed and analyzed in Graph pad Prism software, Using Welch’s t- test (n=12, error bars, standard deviation). See also Figure S6.
DISCUSSION
Lambdoid phages contain genetic arsenals that affect their host bacterial behaviour. In EHEC, lambdoid phages encode Stx that has been demonstrated to enhance EHEC-mediated disease (Tyler et al., 2013). Classical lambda phage biology has been studied for many years in E. coli K-12 (Friedman and Court, 2001; Little et al., 1999). EHEC strains contain different repertoires of lambdoid phages that encode Stx, with strains containing one to two or more phages. It is also noteworthy that these Stx-lambdoid-like phages present a high degree of variability amongst themselves in their genomic organization, sequence of their genes, and their ability to express Stx (Ogura et al., 2015). The Stx-2 lambdoid phage from EHEC strain 86–24 behaves differently from the classical lambda phage from E. coli K12 strain W3350. The W3350 phage only form phage particles upon mitomycin C treatment (Figure S1C), while the 86–24 Stx2-phage can form particles in the absence of mitomycin C (Figure 1G). Moreover, the 86–24 Stx2-phage has a much shorter tail than the W3350 phage (Figure 1H), in agreement with previous reports that Stx phages can present different shapes (Bonanno et al., 2016). Also, in contrast to the W3350 phage, the 86–24 Stx2-phage, although able to transduce the E. coli K-12 strain DH5α, is unable to express its late phage genes, and form plaques in this strain (Figure S2). These could be due to divergence among phage regulatory proteins (Ogura et al., 2015), or the host strain CRISPR-Cas system, given that this system has been shown to block release of lysogenic Stx-phages in another host E. coli K-12 strain (Fu et al., 2017).
The vast majority of lambda phage studies have been conducted under aerobic growth in the rich LB medium (Friedman and Court, 2001; Little et al., 1999). However, the intestinal lumen is anaerobic with scarcer carbon and nitrogen sources than LB. Moreover, in vitro EHEC and C. rodentium express their virulence genes in the nutrient poorer DMEM under anaerobic conditions, which recapitulates virulence expression during mammalian infection (Curtis et al., 2014a). Expression of RecA that is key towards the phage entry into a productive lytic cycle is constitutive under aerobic growth conditions in LB and DMEM in both EHEC and K-12, but decreases during anaerobic growth in DMEM (Figures 1 and S1). In EHEC, during anaerobic growth in DMEM the Stx2-lambdoid phage remains lysogenic. Importantly, while regulation of phage genes by Cro is usually associated to establishing a lytic cycle, we show that basal levels of Cro are produced when the EHEC Stx2-phage is lysogenic (Figure 1), indicating that the Cro protein of this phage has regulatory functions within the lysogenic phage cycle.
Here we show that the Cro phage transcription factor controls expression of chromosomal and pathogenicity island genes in EHEC during phage lysogenesis (Figures 2–4 and S5). The CI phage transcription factor has also been shown to control chromosomal genes involved in gluconeogenesis in E. coli (Chen et al., 2005), suggesting that phage transcriptional factors can evolve to control gene expression of the bacterial ancestral genome. Notably, Cro affects expression of the LEE PAI (Figures 2–4). Although other pathogenicity island transcription factors, such as RgdR (from O island 51 that also contains a cryptic prophage, albeit RgdR itself is not a phage regulator) (Flockhart et al., 2012), and EtrA and EivF from the cryptic T3SS containing island also influence LEE gene expression (Zhang et al., 2004), Cro regulation of the LEE intrinsically links LEE regulation to Shiga toxin expression in EHEC, which are the main virulence factors that determines the course of EHEC-mediated disease. Different EHEC outbreak strains have phages that encode different Cro proteins, which have altered ability to induce virulence (Ogura et al., 2015). This is impactful, given that EHEC strains evolve rapidly through acquisition of laterally acquired DNA, and vary in their ability to cause disease in humans, colonize animals, and survive in the environment (Sadiq et al., 2014). Recent EHEC clones are acquiring different phages, and are enhancing their pathogenesis in outbreaks (Sadiq et al., 2014). We show that this phenomenon occurs not just by acquisition of virulence genes, such as toxins, through phages, but through the rewiring of transcription or chromosomal and pathogenicity island genes. The differential coordination of LEE and Shiga toxin expression by differences in phage transcription factors adds another layer of complexity in fine tuning virulence gene regulation. Moreover, this relationship highlights the multiple layers involved in these inter-kingdom associations between phages, bacterial and mammalian hosts that include expansion of genetic material, chemical signaling and changes in gene expression.
STAR METHODS
CONTACT FOR REAGENT AND RESOURCE SHARING
Further information and request for resources and reagents should be directed to and will be fulfilled by the Lead Contact, Vanessa Sperandio (Vanessa.sperandio@utsouthwestern.edu)
EXPERIMENTAL MODEL AND SUBJECT DETAILS
Mice
Mice were housed under specific pathogen-free conditions and maintained on a 12 hour light/dark cycle with unlimited access to water and food (5053 Rodent diet 20, PicoLab). We used 6 weeks old female C3H/HeJ mice purchased from The Jackson Laboratory. Female mice were used to facilitate randomized mixing between the experimental groups prior to every experiment. Mice were used as hosts for Citrobacter rodentium infection studies. All experiments were performed using protocols approved by UT Southwestern’s institutional animal care and use committee (IACUC).
Epithelial cells
Hela cells were obtained from ATCC and kept stored liquid nitrogen until used. They were grown in DMEM supplemented with 10% fetal bovine serum (FBS) and 1% penicillin/streptomycin/gentamicin (PSG) antibiotic mix at 37°C, 5% CO2. They were screened for being free of Mycoplasma by PCR with primers designed to detec Mycoplasma 16S RNA.
Microbial Strains
Enterohemorrhagic E. coli (EHEC) strains 86–24, EDL933 and Sakai, and Citrobcater rodentium strain DBS100 were cultured in suspension on Luria bertani (LB) broth or Dulbecco eagle medium (DMEM). EHEC and C. rodentium at log-phase growth was mixed with autoclaved glycerol (20% final concentration) and kept as stocks at −80°C.
METHOD DETAILS
Bacterial strains, plasmids and growth conditions
Strains and plasmids are listed in supplementary Tables 1 and 3. E. coli strains were grown either anaerobically in DMEM or aerobically in LB medium unless otherwise stated. Studies involving EHEC were grown anaerobically at 37 °C in DMEM (Gibco) using Gaspack system. Experiments involving Mitomycin C were conducted aerobically/anaerobically in DMEM and LB at 37°C until an OD600 absorbance 0.3 was reached, then Mitomycin C was added (0.2 µg/ml) and bacterial sample were collected after 3 hours. Experiments involving EHEC, Citrobacter rodentium and its isogenic mutations were conducted anaerobically at 37° C in DMEM (Gibco).
Isogenic mutant construction
Construction of isogenic ΔN, ΔQ, ΔΔSR, Δcro and ΔespA mutants was performed using lambda-red mediated technique previously described (Datsenko and Wanner, 2000). The primers used to construct mutations are described in Supplementary Table 2. Briefly, a PCR product was generated using primers containing homologous regions to sequences flanking N, Q, SR, cro and espA genes to amplify a kanamycin resistant gene from pKD4. EHEC 86–24 cells harboring pKD46 were electroporated using the PCR product and colonies were selected from kanamycin LB plates. Nonpolar mutants were generated using resolvases contained into a pCP20 plasmid to cleave off the kanamycin-gene. Complementation experiments were conducted using PCR products flanked with restriction enzymes; generated from EHEC 86–24 genomic DNA amplifying N, Q, SR and cro genes that were digested with BamHI and NotI then cloned into pWSK129. The obtained plasmids were electroporated into a respective nonpolar mutant.
Citrobacter rodentium DBS100 promoter region exchange strategy
To exchange the ler EHEC promoter region with the C. rodentium ler promoter region, we constructed a DNA region in a plasmid (PUC19) containing the C. rodentium ler gene (300 + bp), the EHEC ler promoter region (1000 + bp), the chloramphenicol cassette from pkd3 (1000 bp) and the transposase gene downstream of C. rodentium ler promoter region (1500 bp). The gene product was constructed using primers listed in supplemental table 2 (CRlerF to Tris66R), and fused it to PUC19 using Gibson cloning kit according to the manufacturer’s recommendation (New England Biolabs). The product was electroporated in TOPO10 cells, and plated them in Chloramphenicol (CM) LB plates. The plasmid from positive resistant colonies to CM was verified by PCR and sequencing reactions. Next, a PCR product was generated using the previous plasmid construct as template, which integrated all the genes mentioned above. The product was gel purified and electroporated into C. rodentium DBS100 cells harboring Pkd46 (AMPr) to exchange the product. Positive colonies were picked from CM LB plates from which PCR and sequences reactions were conducted to verify the validity of the insert. The new Citrobacter strain was renamed C. rodentium j11 (C.r-j11). To express bacteriophage Cro from EHEC 8624, we used the pWSK129-pcro constructed above and electroporated into C.r-j11 and obtaining C.r-j11-pcro.
Construction of Flag-RZ 8624 bacteriophage
The wild-type EHEC 8624 strain expressing chromosomally 3× FLAG-tagged RZ was constructed using recombinant DNA techniques as described previously in references(Uzzau et al., 2001) and (Datsenko and Wanner, 2000). Briefly, PCR product was amplified using Phusion high-fidelity DNA polymerase (Thermo Scientific), FlaRzF and FlagRzR primers, and pSUB11 (Knr) plasmid as the template. PCR product gel purified (Qiagen). Cells of the wild-type EHEC strain transformed with the helper plasmid pKD46 were prepared for electroporation and transformed with the resulting gel-purified PCR products. Colonies were screened for ampicillin sensitivity and kanamycin resistance. Successful recombinational transfer of the FLAG sequence into the chromosomal RZ gene of positive colonies was confirmed by PCR amplification using primers RzBorF and RzBorR.
Phage Cro purification
Lambdoid cro gene flanked with restriction enzymes was amplified by PCR from EHEC 86–24, Sakai and EDL933 genomic DNA, digested using BamHI and NotI and then cloned into pET21a to generate a His-tagged Cro proteins. The plasmids were transformed into TOPO10 cells and positive transformants were subsequently transformed into BL21 cells generating plamids (pJHD017–19). The strains were grown in LB media at 37 °C until an OD600nm = 0.8 then protein expression was induced by adding IPTG (final concentration 0.6 mM), and growth for 3 hours at 37 ° C. Cells were collected, resuspended in 50 ml of lysis buffer (50 mM phosphate buffer, pH 8.0, 10 mM imidazole, 300 mM NaCl, 15 mM β-mercaptoethanol and 100 µl of proteinase inhibitor cocktail), then lysed using emulsiflex. Lysates were centrifuged at 14,0000 r.p.m for 30 min, and collected supernatants were incubated with nickel beads for 1 hour at 4 ° C with gentle agitation. Lysates were loaded into nickel–nitriloacetic acid (Ni-NTA) columns, washed with wash buffer (50 mM phosphate buffer pH 8.0, 20 mM imidazole, 300 mM NaCl, 15 mM β-mercaptoethanol) and eluted with elution buffer (50 mM phosphate buffer pH 8.0, 250 mM imidazole, 300 mM NaCl). The final fractions were dialyzed using centricon colums (10,000 kDa), and resuspended in buffer (50 mM Tris pH7.5, 250 mM KCl, 0.2 mM EDTA, 1 mM DTT). Protein concentration was determined by Bradford protein assay. The presence of Cro was determined by western blot experiments using anti-His antibody (Sigma).
RNA extraction and qRT-PCR
Primers used in qRT-PCR and cloning are listed in Supplemental Table 2. RNA from 3 biological replicates was extracted using extracted using RiboPure kit according to the manufacture instructions (Ambion). For in vitro experiments, cultures were grown to late-log phase in DMEM under aerobic or anaerobic conditions as indicated in the figures (6 h). For in vivo experiments, fecal pellets were collected from infected mice on day 3 after C. rodentium infection. RNA was extracted using the RiboPure Bacteria isolation kit according to the manufacturer’s protocols (Ambion). The primers used for quantitative reverse transcription-PCR (qRT-PCR) were validated for amplification efficiency and template specificity. qRT-PCR was performed as previously described (Hughes et al., 2009) in a one-step reaction using an ABI 7500 sequence detection system (Applied Biosystems). Data were collected using the ABI Sequence Detection 1.2 software (Applied Biosystems). All data were normalized to an endogenous control (rpoA for virulence gene expression in EHEC and C. rodentium and analyzed using the comparative critical threshold (CT) method. Gene expression is represented as fold differences compared to the wild type EHEC strain 86–24. rpoA was used as the internal control. Error bars indicate the standard deviations of the ΔΔCt values. The Student t-test was used to determine statistical significance. A P value of less than 0.01 was considered significant.
To investigate bacterial gene expression in the feces content, frozen pellets were homogenized for 10 min in a bead beater (BioSpec) and RNA isolated using the RNeasy PowerMicrobiome kit (Qiagen). RT-PCR for espA gene in Citrobacter was performed as described above.
Microarray
The GeneChip E. coli Genome 2.0 array system (Affymetrix) was used to compare the gene expression in EHEC strain 86–24 to that of Δcro strains grown anaerobically in DMEM at 37°C for 6 hr in a GasPak EZ anaerobe conta iner. The RNA processing, labeling, hybridization, and slide-scanning procedures were performed as described in the Affymetrix Gene Expression technical manual. Data obtained from the Escherichia coli Genome GeneChip 2.0 contains over 10,000 probe sets directed toward 20,366 genes from four different strains of E. coli: the K-12 laboratory strain MG1655, the O157:H7 EHEC strain EDL933, the O157:H7 EHEC strain Sakai, and the uropathogenic strain CFT073. The array data analyses were performed as described previously(Kendall et al., 2011). Based on array data analyses, the biological processes of the genes significantly increased ≥ 4-fold (406 genes, 297 with known functions, 109 with unknown function) or significantly decreased ≥ 2-fold (72 genes, 58 with known functions, 14 with unknown function) were characterized using the Universal Protein Resource (UniProt) Knowledgebase (UniProtKB/Swiss-Prot). (http://www.uniprot.org). Expression data can be accessed using accession number (GSE86271) at the NCBI GEO database.
Fluorescent actin staining assay
Fluorescein actin staining (FAS) assays were performed as previously described (Knutton et al., 1991). Briefly, HeLa cells were grown on coverslips in 12-well culture plates with DMEM supplemented with 10% fetal bovine serum (FBS) and 1% penicillin/streptomycin/gentamicin (PSG) antibiotic mix at 37°C, 5% CO 2, overnight to 80% confluency. The wells were washed with PBS and replaced with low-glucose DMEM supplemented with 10% FBS. Bacterial cultures were grown anaerobically overnight as described above at 37°C, and overnight Bt culture was concentrated 10-fold in LB. Overnight bacterial cultures were diluted 1:100 to infect confluent monolayers of HeLa cells for 6 h at 37°C, 5% CO 2. After a 6 h infection, the coverslips were washed, fixed, permeabilized, and then treated with fluorescein isothiocyanate (FITC)-labeled phalloidin to visualize actin accumulation and propidium iodide to visualize host nuclei and bacteria. The coverslips were mounted on slides and visualized with a Zeiss Axiovert microscope. To determine percentage infected cells, 5–7 fields from three separate coverslips (triplicate) were counted, and calculated as (Cells with < Pedestals/Total cells)*100. Statistical analyses were performed using the Student unpaired t test.
Electrophoretic mobility shift assay
EMSAs were performed using purified lambdoid Cro-His and radiolabeled probes(Nguyen et al., 2015). The EHEC ler promoter region (−42 to −174) was PCR amplified, run on a 5% polyacrylamide gel, excised and purified. The amplicon was end-labelled using [γ32P]ATP and T4 polynucleotide kinase (NEB) to generate radiolabeled probes, and then purified using a Qiagen PCR kit. To test the ability of Cro to bind directly to the ler promoter, increasing amounts of Cro (0 to 400 nM) were incubated with end-labelled probe (10 ng) for 20 min at 4°C in binding buffer (25 µg ml−1 BSA, 50 ng poly(deoxyinosinic-deoxycytidylic) (dldC) acid, 50 mM Tris, pH8.5, 0.1 mM EDTA, 0.1 mM DTT, 50 mM NaCI and 3 mM MgCH3COO). A Ficol-glycerol solution was used to stop the reaction (Nguyen et al., 2015). The kanamycin (Kan) promoter region was added as negative control. The reactions were run on a 6% polyacrylamide gel for 3.5 h at 180 V. The gels were dried under vacuum and EMSAs were visualized by autoradiography.
Motility assays
Assays were conducted as described previously with modifications (Hughes et al., 2009). In brief, motility assays were conducted on 0.25% agar plates containing DMEM medium and incubated at 37 °C anaerobically. The motility halos were measured after 24 hours. Student t-test was used to determine statistical significance. A P-value of less than 0.01 was considered significant.
Secreted protein and whole-cell lysate immunoblotting
Secreted proteins from strains were conducted as described previously(Kendall et al., 2011). In brief, Cultures were grown anaerobically in DMEM at 37°C and collected after 6 hour growth phase. Total secreted protein from culture supernatants was separated from bacterial cells using centrifugation and filtration. The proteins were separated by SDS-PAGE and subjected to immunoblotting with rabbit polyclonal antiserum to EspA and visualized with enhanced chemiluminescence (Bio-Rad). Coomassie blue staining was used to visualize bovine serum albumin (BSA) loading controls.
Whole-cell lysates from WT EHEC strains 86–24 and the respective mutant strains were prepared from strains grown anaerobically in DMEM and collected after 6 hour growth phase. Cells were collected by centrifugation and then lysed with urea lysis buffer (100 mM NaH2PO4, 10 mM Tris, 8 M urea, pH 6.3). Samples were probed using antisera against EspA, Flag (Sigma) RecA and RpoA (Neoclone).
Bacteriophage plaque assay and isolation
For plaque assays we conducted experiments as previously described (Sambrook, 1989).In brief, EHEC 86–24 and E. coli W3350 strains were grown in LB medium until they reached an OD600 of 0.3 at 37°C and 30 °C respectively. Mitomycin C induction was accomplished by adding 10 µg of Mitomycin C final concentration. The cultures were spin down and filter sterilized using 0.22µM filter units. Serial dilutions were conducted using SM buffer containing gelatin. The host strains (DH5α, MG1655, VS145-ΔqseA) were grown aerobically in 50 ml LB, supplemented with maltose (500µl 0.2% solution) until they reached an OD600 of 0.5 at 37°C. Next, the cultures were spin down, the supernatant was discarded and the pellet was resuspend it in MgSO4 (20mM). The top agar was supplemented with CaCl2 (10mM). Bacteriophage lysates were mixed with equal amount of the host strain, incubate either at 37°C and 30 °C, mixed in top agar and poured onto LB plates and incubate them overnight at 37°C.
To precipitate bacteriophage particles, bacterial cultures with different growth conditions were spun down (4000rpm/20m) and filter sterilize by using 0.22µM filter units. Next, use 1:1 ratio of sterile supernatant and PEG8000 solution, mix and incubate at room temperature for 15 minutes. Spin down mixture at 13000rpm for 10 minutes. Next, wash the tubes once with 1XPBS solution, spin down at 13000rpm for 2 minutes. Resuspend the phage particles in SM buffer. They were treated with DNAse 1 to prevent chromosome contamination. To determine presence of bacteriophages, PCR reactions were conducted using stx2A, and cro genes from 8626-bacteriophage and lambda as readouts respectively.
Negative staining of phages EHEC 86–24 and E. coli W3350 lambda for Electron microscopy
EHEC 86–24 and E. coli W3350 strains were grown in 50ml LB plus glucose (500ul/1M) at 37 and 30 °C respectively, Mitomycin C induction was done at an OD600 0.3 by adding 10 µg of Mitomycin C and continue grow them for 3 additional hours. Next, culture was spin down (4000rpm/20m) and filter sterilize by using 0.22µM filter units. Next, use 1:1 ratio of sterile supernatant and PEG8000 solution, mix and incubate at room temperature for 15 minutes. Spin down mixture at 13000rpm for 10 minutes. Next, wash the tubes once with 1XPBS solution, spin down at 13000rpm for 2 minutes. Resuspend the phage particles in SM buffer. Dilute the previous solution and add 2 µl of pure Chloroform and mix. Let this mixture to air dry × 20m minimum. Take carbon grids (CF400-CU carbon film, 400 Mesh Copper) then follow hydrophilic rendering by glow discharge in air. 5 µl of sample was placed on top of the grid for 5 minutes; excess of sample was dried off. Next, 5 µl of 2% aqueous uranyl acetate solution was placed on the grid for 5 minutes; excess was removed with filter paper and allowed to dry for 2 more minutes. Images were acquired on a tecnai G’spirit transmission electron microscope at the UT Southwestern Medical Center EM core.
Murine infections
C3H/HeJ mice were purchased from The Jackson Laboratory and housed in a specific pathogen-free facility at UT Southwestern Medical Center. All experiments were performed under IACUC approved protocols.
Citrobacter rodentium (DBS100), C. rodentium (Cr-J11), and C. rodentium (Cr-J11-pcro) culture strains were grown in LB medium at 37°C overnight, next day they were centrifuged for 20 minutes at room temperature, and the supernatant was discarded. Next, 1XPBS was used to wash the pellet once and resuspend the pellets in 1XPBS. At 5 weeks of age, female C3H/HeJ mice were orally mock-infected with PBS or orally infected with 1×10⁸ CFU of Citrobacter strains.
Baseline weight of mice was measured on the initial day of C. rodentium infection (day 0, D0). Mice were weighed daily for the course of infection. Percentage weight was calculated as previously reported (Curtis et al., 2014b). Change in weight reflects weight gain or weight loss over the course of infection. Mice were monitored daily for survival. The experiments were performed at least twice with a total of 5–10 mice per group. The nonparametric Mann-Whitney U test was used to determine the statistical significance using Graphpad prism software.
A third experiment was conducted using 6 animals per group which were orally infected as described above. Fecal pellets were collected on days 3, 6 for colony counts and RNA extraction and mice were sacrificed at day 7 after infection. Feces were resuspended in PBS at 1 g/ml, serially diluted, and plated on LB agar plates containing Nalidixic acid and Chloramphenicol antibiotics. Colony counts were performed after 24 h incubation at 37°C under aerobic conditions. Cecum and colon sections for murine RNA analysis were kept frozen in dry ice and stored at −80°C.
Transmission Electron Microscopy
A portion of distal colon harvested from mock-infected or C. rodentium-infected (DBS100, Cr-J11 and Cr J11-pCro) mice was fixed in 2.5% glutaraldehyde,0.1M cacodylate buffer for a minimum of 2 h. Samples were then submitted to the UT Southwestern Electron Microscopy Core and prepared as follows: The tissue was rinsed in cacodylate buffer and placed into 1% osmium with 0.8% ferricyanide for 1.5 h, then rinsed with deionized water and en bloc stained with uranyl acetate for 2 h. The tissue then underwent a series of dehydration steps from 50% to 100% ethanol, was infiltrated with propylene oxide and resin, embedded in pure resin, and cured in a 70°C oven overnight. After sectioning, the grids were then post-stained with 2% uranyl acetate in deionized water and lead citrate. The grids were imaged on a Technai G2 Spirit Transmission ElectronMicroscope (Tecnai).
QUANTIFICATION AND STATISTICAL ANALYSIS
For all in vitro experiments (qRT-PCR, FAS, motility), and bacterial CFU counts a Student unpaired t test was used to calculate statistical significance. For mice survival experiments he nonparametric Mann-Whitney U test was used to determine the statistical significance using Graphpad prism software. Detailed information on the n of biological samples and animals used can be found in figure legends and Star Methods.
DATA AND SOFTWARE AVAILABILITY
Microarray expression data can be accessed using accession number (GSE86271) at the NCBI GEO database.
Supplementary Material
KEY RESOURCES TABLE
| REAGENT or RESOURCE | SOURCE | IDENTIFIER |
|---|---|---|
| Antibodies | ||
| anti-EspA-polyclonal rabbit | UT Southwestern, Vanessa Sperandio | N/A |
| anti-Flag-monoclonal mouse | Sigma-Aldrich | Cat# F3165 |
| anti-His-monoclonal mouse | Sigma-Aldrich | Cat# H1029 |
| anti-RecA-polyclonal mouse | Abcam | Cat# ab63797 |
| anti-RpoA-monoclonal mouse | BioLegend | Cat# 663104 |
| goat-anti-rabbit-HRP | BioRad | Cat# 1706515 |
| goat-anti-mouse-HRP | BioRad | Cat# 1706516 |
| Bacterial Strains and Cell lines | ||
| EHEC str 86–24 | U of Myraland, James Kaper | N/A |
| EHEC str EDL933 | U of Myraland, James Kaper | N/A |
| EHEC str Sakai | U of Myraland, James Kaper | N/A |
| E. coli DH5α | UT Southwestern, Vanessa Sperandio | N/A |
| E. coli TOPO10 | Invitrogen | Cat# C404052 |
| E. coli BL21 | Invitrogen | Cat# C600003 |
| E.coli W3350 | U of Texas A&M, Lanying Zeng | N/A |
| Citrobacter rodentium DBS100 | Tufts University, John Leong | N/A |
| Experimental Models: Organisms/Strains | ||
| Hela cell line | ATCC | Cat# ATCC® CCL-2.1 |
| Chemicals and materials | ||
| Phosphate Buffered Saline | Fisher Scientific | Cat# BP399-4 |
| Triton X-100 | Fisher Scientific | Cat# BP151 |
| Formaldehyde | Fisher Scientific | Cat# BP539 |
| FITC-Phalloidin | Sigma-Aldrich | Cat# P5282 |
| Propidium Iodine | Sigma-Aldrich | Cat# P4864 |
| Antifade reagent | Life technologies | Cat# P36934 |
| 18mm coverslips | Fisher Scientific | Cat# 1254618CJR |
| 12 well Falcon plates | Fisher Scientific | Cat# 353043 |
| Dulbecco eagle medium (DMEM) low glucose | Invitrogen | Cat# 11885-084 |
| Dulbecco eagle medium (DMEM) high glucose | Invitrogen | Cat# 11965-092 |
| RNaseA powder | Fisher Scientific | Cat# BP23391 |
| Mitomycin-C powder | Sigma-Aldrich | Cat# M0440-25 |
| Phusion High fidelity PCR master mix | Thermo Fisher | Cat# F-531L |
| Trizol reagent | Thermo Fisher | Cat# 1559618 |
| Sybr green master mix | Thermo Fisher | Cat# 4309155 |
| Reverse transcriptase | Thermo Fisher | Cat# 4308228 |
| RnaseA inhibitor | Thermo Fisher | Cat# 100021540 |
| Penicillin-Streptomycin solution | Thermo Fisher | Cat# 15140-122 |
| Heat inactivated Fetal Bovine serum (FBS) | Thermo Fisher | Cat# 10082-147 |
| Restriction enzyme NotI | New england Biolabs | Cat# R0189S |
| Restriction enzyme BamHI | New england Biolabs | Cat# R0136S |
| Restriction enzyme SacI | New england Biolabs | Cat# R0156S |
| T4 DNA Ligase | New england Biolabs | Cat# MO202L |
| Tween 20 | Fisher Scientific | Cat# BP337-500 |
| Isopropyl β-D-1-thiogalactopyranoside (IPTG) | Sigma-Aldrich | Cat# I6758 |
| Polyethylene Glycol 8000 (PEG8000) | Sigma-Aldrich | Cat# 89510-250-G-F |
| Ampicillin powder | Sigma-Aldrich | Cat# A9518 |
| Streptomycin powder | Sigma-Aldrich | Cat# S6501 |
| Kanamycin sulfate powder | Sigma-Aldrich | Cat# K1876 |
| Carbon film, 400mesh copper | Electron microscopy sciences | Cat# CF400-CU |
| 30% Acrylamide/Bis solution | Biorad | Cat# 161-0156 |
| TEMED | Biorad | Cat# 161-0801 |
| Ficoll solution | Sigma-Aldrich | Cat# F5415-25 |
| Magnesium acetate | Fisher Scientific | Cat# BP215-500 |
| T4 polynucleotide kinase | New england Biolabs | Cat# M0201S |
| Ammonium persulfate | Sigma-Aldrich | Cat# A3678-256 |
| Protease inhibitor cocktail | Sigma-Aldrich | Cat# P8849-5 |
| Dithiothreitol (DTT) | Fisher Scientific | Cat# BP172-25 |
| Tris base | Fisher Scientific | Cat# BP152-10 |
| Sodium chloride | Sigma-Aldrich | Cat# S9888-1 |
| Poly(2-deoxyinosinic2-deoxycytidylic acid) | Sigma-Aldrich | Cat# 81345-500 |
| Ramdon primers | Invitrogen | Cat# 48190-011 |
| Super script II reverse transcriptase | Invitrogen | Cat# 18064-014 |
| Superase | AMBION | Cat# AM2694 |
| Poly A control | Affymetrix | Cat# 900542 |
| Dnase I | Invitrogen | Cat# 18068-015 |
| Hydrochloric acid solution | Sigma-Aldrich | Cat# 318949-500 |
| Sodium hydroxide solution 10N | Millipore | Cat# SX0607N-6 |
| Terminal Deoxynucleotidyl transferase | Promega | Cat# M1875 |
| Ethanol anhydrous | IBM Scientific | Cat# 64-17.5 |
| Chloroform | IBM Scientific | Cat# 67-66-3 |
| dNTP mix 10mM | Invitrogen | Cat# 18-427-088 |
| Gibson assembly master mix | New england Biolabs | Cat# M5510A |
| Lysing matrix C, glass beads | MP biomedicals | Cat# 6912100 |
| Critical Commercial assays | ||
| Rnasy power microbiome | Qiagen | Cat# 26000-50 |
| Ribopure-bacteria | Ambion | Cat# 1405072 |
| Genelute Plasmid Miniprep | Sigma | Cat# PLN350-1KT |
| Quiaquick PCR purification kit | Qiagen | Cat# 28906 |
| Deposited Data | ||
| Microarray Affymetrix | GEO GSE86271 | GEO GSE86271 |
| Experimental models | ||
| Mouse C3H/HeJ mice | The Jackson laboratory | Cat# 000659 |
| Oligonucleotides | ||
| Primers used in this study, see Table S2 | This paper | N/A |
| Sofware and Algorithms | ||
| GraphPad Prism 7 for Windows | https://www.graphpad.com/ | N/A |
| Clustal Omega | https://www.ebi.ac.uk/Tools/msa/clustalo/ | N/A |
| PSIPRED Protein Sequence Analysis Workbench | http://bioinf.cs.ucl.ac.uk/psipred/ | N/A |
Highlights.
Enterohemorrhagic Escherichia coli (EHEC) harbor dormant bacteriophages anaerobically.
A dormant bacteriophage produces Cro that activates or represses EHEC virulence factors.
The Cro regulatory activity on virulence factors differs across EHEC strains.
Cro augments virulence during mammalian infection.
Acknowledgments
We thank Dr. Sebastian Winter and Maria Winter at UT Southwestern Medical Center, department of Microbiology for critical suggestions in this study. Dr A. Darehshouri, Dr P. Jesudhasan and the personnel at UT Southwestern medical center EMC core. This work was supported by NIH grants AI053067 and AI05135.
Footnotes
Publisher's Disclaimer: This is a PDF file of an unedited manuscript that has been accepted for publication. As a service to our customers we are providing this early version of the manuscript. The manuscript will undergo copyediting, typesetting, and review of the resulting proof before it is published in its final citable form. Please note that during the production process errors may be discovered which could affect the content, and all legal disclaimers that apply to the journal pertain.
AUTHOR CONTRIBUTIONS
J.D.H.D designed the study, conducted experiments, analyzed data and wrote the paper. V.S designed the study and wrote the paper.
DECLARATION OF INTERESTS
The authors declare no competing interests
References
- Albenberg L, Esipova TV, Judge CP, Bittinger K, Chen J, Laughlin A, Grunberg S, Baldassano RN, Lewis JD, Li H, et al. Correlation between intraluminal oxygen gradient and radial partitioning of intestinal microbiota. Gastroenterology. 2014;147:1055–1063. doi: 10.1053/j.gastro.2014.07.020. e1058. [DOI] [PMC free article] [PubMed] [Google Scholar]
- Beutin L, Hammerl JA, Strauch E, Reetz J, Dieckmann R, Kelner-Burgos Y, Martin A, Miko A, Strockbine NA, Lindstedt BA, et al. Spread of a Distinct Stx2-Encoding Phage Prototype among Escherichia coli O104:H4 Strains from Outbreaks in Germany, Norway, and Georgia. Journal of Virology. 2012;86:10444–10455. doi: 10.1128/JVI.00986-12. [DOI] [PMC free article] [PubMed] [Google Scholar]
- Bonanno L, Petit MA, Loukiadis E, Michel V, Auvray F. Heterogeneity in Induction Level, Infection Ability, and Morphology of Shiga Toxin-Encoding Phages (Stx Phages) from Dairy and Human Shiga Toxin-Producing Escherichia coli O26:H11 Isolates. Appl Environ Microbiol. 2016;82:2177–2186. doi: 10.1128/AEM.03463-15. [DOI] [PMC free article] [PubMed] [Google Scholar]
- Chen Y, Golding I, Sawai S, Guo L, Cox EC. Population fitness and the regulation of Escherichia coli genes by bacterial viruses. PLoS Biol. 2005;3:e229. doi: 10.1371/journal.pbio.0030229. [DOI] [PMC free article] [PubMed] [Google Scholar]
- Curtis MM, Hu Z, Klimko C, Narayanan S, Deberardinis R, Sperandio V. The gut commensal bacteroides thetaiotaomicron exacerbates enteric infection through modification of the metabolic landscape. Cell Host Microbe. 2014a;16:759–769. doi: 10.1016/j.chom.2014.11.005. [DOI] [PMC free article] [PubMed] [Google Scholar]
- Curtis Meredith M, Hu Z, Klimko C, Narayanan S, Deberardinis R, Sperandio V. The Gut Commensal Bacteroides thetaiotaomicron Exacerbates Enteric Infection through Modification of the Metabolic Landscape. Cell Host & Microbe. 2014b;16:759–769. doi: 10.1016/j.chom.2014.11.005. [DOI] [PMC free article] [PubMed] [Google Scholar]
- Datsenko KA, Wanner BL. One-step inactivation of chromosomal genes in Escherichia coli K-12 using PCR products. Proceedings of the National Academy of Sciences of the United States of America. 2000;97:6640–6645. doi: 10.1073/pnas.120163297. [DOI] [PMC free article] [PubMed] [Google Scholar]
- Deng W, Puente JL, Gruenheid S, Li Y, Vallance BA, Vazquez A, Barba J, Ibarra JA, O’Donnell P, Metalnikov P, et al. Dissecting virulence: systematic and functional analyses of a pathogenicity island. Proc Natl Acad Sci U S A. 2004;101:3597–3602. doi: 10.1073/pnas.0400326101. [DOI] [PMC free article] [PubMed] [Google Scholar]
- Flockhart AF, Tree JJ, Xu X, Karpiyevich M, McAteer SP, Rosenblum R, Shaw DJ, Low CJ, Best A, Gannon V, et al. Identification of a novel prophage regulator in Escherichia coli controlling the expression of type III secretion. Mol Microbiol. 2012;83:208–223. doi: 10.1111/j.1365-2958.2011.07927.x. [DOI] [PMC free article] [PubMed] [Google Scholar]
- Flowers LJ, Bou Ghanem EN, Leong JM. Synchronous Disease Kinetics in a Murine Model for Enterohemorrhagic E. coli Infection Using Food-Borne Inoculation. Front Cell Infect Microbiol. 2016;6:138. doi: 10.3389/fcimb.2016.00138. [DOI] [PMC free article] [PubMed] [Google Scholar]
- Friedman DI, Court DL. Bacteriophage lambda: alive and well and still doing its thing. Current Opinion in Microbiology. 2001;4:201–207. doi: 10.1016/s1369-5274(00)00189-2. [DOI] [PubMed] [Google Scholar]
- Fu Q, Li S, Wang Z, Shan W, Ma J, Cheng Y, Wang H, Yan Y, Sun J. H-NS Mutation-Mediated CRISPR-Cas Activation Inhibits Phage Release and Toxin Production of Escherichia coli Stx2 Phage Lysogen. Front Microbiol. 2017;8:652. doi: 10.3389/fmicb.2017.00652. [DOI] [PMC free article] [PubMed] [Google Scholar]
- Fuchs S, Mühldorfer I, Donohue-Rolfe A, Kerényi M, Emödy L, Alexiev R, Nenkov P, Hacker J. Influence of RecA onin vivovirulence and Shiga toxin 2 production inEscherichia colipathogens. Microbial Pathogenesis. 1999;27:13–23. doi: 10.1006/mpat.1999.0279. [DOI] [PubMed] [Google Scholar]
- Hall BM, Vaughn EE, Begaye AR, Cordes MHJ. Reengineering Cro Protein Functional Specificity with an Evolutionary Code. Journal of Molecular Biology. 2011;413:914–928. doi: 10.1016/j.jmb.2011.08.056. [DOI] [PubMed] [Google Scholar]
- Hughes DT, Clarke MB, Yamamoto K, Rasko DA, Sperandio V. The QseC Adrenergic Signaling Cascade in Enterohemorrhagic <italic>E. coli</italic> (EHEC) PLoS Pathog. 2009;5:e1000553. doi: 10.1371/journal.ppat.1000553. [DOI] [PMC free article] [PubMed] [Google Scholar]
- Hussa EA, Goodrich-Blair H. It Takes a Village: Ecological and Fitness Impacts of Multipartite Mutualism. Annual Review of Microbiology. 2013;67:161–178. doi: 10.1146/annurev-micro-092412-155723. [DOI] [PubMed] [Google Scholar]
- Islam MR, Ogura Y, Asadulghani M, Ooka T, Murase K, Gotoh Y, Hayashi T. A sensitive and simple plaque formation method for the Stx2 phage of Escherichia coli O157:H7, which does not form plaques in the standard plating procedure. Plasmid. 2012;67:227–235. doi: 10.1016/j.plasmid.2011.12.001. [DOI] [PubMed] [Google Scholar]
- Jarvis KG, Giron JA, Jerse AE, McDaniel TK, Donnenberg MS, Kaper JB. Enteropathogenic Escherichia coli contains a putative type III secretion system necessary for the export of proteins involved in attaching and effacing lesion formation. Proc Natl Acad Sci U S A. 1995;92:7996–8000. doi: 10.1073/pnas.92.17.7996. [DOI] [PMC free article] [PubMed] [Google Scholar]
- Johnson AD, Poteete AR, Lauer G, Sauer RT, Ackers GK, Ptashne M. [lambda] Repressor and cro[mdash]components of an efficient molecular switch. Nature. 1981;294:217–223. doi: 10.1038/294217a0. [DOI] [PubMed] [Google Scholar]
- Kaper JB, Nataro JP, Mobley HLT. Pathogenic Escherichia coli. Nature Reviews Microbiology. 2004;2:123–140. doi: 10.1038/nrmicro818. [DOI] [PubMed] [Google Scholar]
- Kaper JB, O’Brien AD. Overview and Historical Perspectives. Microbiology spectrum. 2014;2 doi: 10.1128/microbiolspec.EHEC-0028-2014.. [DOI] [PMC free article] [PubMed] [Google Scholar]
- Kendall MM, Gruber CC, Rasko DA, Hughes DT, Sperandio V. Hfq Virulence Regulation in Enterohemorrhagic Escherichia coli O157:H7 Strain 86–24. Journal of Bacteriology. 2011;193:6843–6851. doi: 10.1128/JB.06141-11. [DOI] [PMC free article] [PubMed] [Google Scholar]
- Knutton S, Phillips AD, Smith HR, Gross RJ, Shaw R, Watson P, Price E. Screening for enteropathogenic Escherichia coli in infants with diarrhea by the fluorescent-actin staining test. Infection and Immunity. 1991;59:365–371. doi: 10.1128/iai.59.1.365-371.1991. [DOI] [PMC free article] [PubMed] [Google Scholar]
- Little JW, Shepley DP, Wert DW. Robustness of a gene regulatory circuit. The EMBO Journal. 1999;18:4299–4307. doi: 10.1093/emboj/18.15.4299. [DOI] [PMC free article] [PubMed] [Google Scholar]
- Mallick EM, McBee ME, Vanguri VK, Melton-Celsa AR, Schlieper K, Karalius BJ, O’Brien AD, Butterton JR, Leong JM, Schauer DB. A novel murine infection model for Shiga toxin- producing Escherichia coli. The Journal of Clinical Investigation. 2012;122:4012–4024. doi: 10.1172/JCI62746. [DOI] [PMC free article] [PubMed] [Google Scholar]
- McDaniel TK, Jarvis KG, Donnenberg MS, Kaper JB. A genetic locus of enterocyte effacement conserved among diverse enterobacterial pathogens. Proc Natl Acad Sci U S A. 1995;92:1664–1668. doi: 10.1073/pnas.92.5.1664. [DOI] [PMC free article] [PubMed] [Google Scholar]
- McDonald JE, Smith DL, Fogg PCM, McCarthy AJ, Allison HE. High-Throughput Method for Rapid Induction of Prophages from Lysogens and Its Application in the Study of Shiga Toxin-Encoding Escherichia coli Strains. Applied and Environmental Microbiology. 2010;76:2360–2365. doi: 10.1128/AEM.02923-09. [DOI] [PMC free article] [PubMed] [Google Scholar]
- Mellies JL, Barron AMS, Carmona AM. Enteropathogenic and Enterohemorrhagic Escherichia coli Virulence Gene Regulation. Infection and Immunity. 2007;75:4199–4210. doi: 10.1128/IAI.01927-06. [DOI] [PMC free article] [PubMed] [Google Scholar]
- Mellies JL, Elliott SJ, Sperandio V, Donnenberg MS, Kaper JB. The Per regulon of enteropathogenic Escherichia coli : identification of a regulatory cascade and a novel transcriptional activator, the locus of enterocyte effacement (LEE)-encoded regulator (Ler) Molecular Microbiology. 1999;33:296–306. doi: 10.1046/j.1365-2958.1999.01473.x. [DOI] [PubMed] [Google Scholar]
- Melton-Celsa AR. Shiga Toxin (Stx) Classification, Structure, and Function. Microbiology spectrum. 2014;2 doi: 10.1128/microbiolspec.EHEC-0024-2013. EHEC-0024-2013. [DOI] [PMC free article] [PubMed] [Google Scholar]
- Mundy R, Pickard D, Wilson RK, Simmons CP, Dougan G, Frankel G. Identification of a novel type IV pilus gene cluster required for gastrointestinal colonization of Citrobacter rodentium. Mol Microbiol. 2003;48:795–809. doi: 10.1046/j.1365-2958.2003.03470.x. [DOI] [PubMed] [Google Scholar]
- Muniesa M, Blanco JE, de Simón M, Serra-Moreno R, Blanch AR, Jofre J. Diversity of stx2 converting bacteriophages induced from Shiga-toxin-producing Escherichia coli strains isolated from cattle. Microbiology. 2004;150:2959–2971. doi: 10.1099/mic.0.27188-0. [DOI] [PubMed] [Google Scholar]
- Muniesa M, de Simon M, Prats G, Ferrer D, Pañella H, Jofre J. Shiga Toxin 2-Converting Bacteriophages Associated with Clonal Variability in Escherichia coli O157:H7 Strains of Human Origin Isolated from a Single Outbreak. Infection and Immunity. 2003;71:4554–4562. doi: 10.1128/IAI.71.8.4554-4562.2003. [DOI] [PMC free article] [PubMed] [Google Scholar]
- Neely MN, Friedman DI. Functional and genetic analysis of regulatory regions of coliphage H-19B: location of shiga-like toxin and lysis genes suggest a role for phage functions in toxin release. Molecular Microbiology. 1998;28:1255–1267. doi: 10.1046/j.1365-2958.1998.00890.x. [DOI] [PubMed] [Google Scholar]
- Nguyen Y, Nguyen NX, Rogers JL, Liao J, MacMillan JB, Jiang Y, Sperandio V. Structural and Mechanistic Roles of Novel Chemical Ligands on the SdiA Quorum-Sensing Transcription Regulator. mBio. 2015;6:e02429–02414. doi: 10.1128/mBio.02429-14. [DOI] [PMC free article] [PubMed] [Google Scholar]
- Njoroge JW, Nguyen Y, Curtis MM, Moreira CG, Sperandio V. Virulence meets metabolism: Cra and KdpE gene regulation in enterohemorrhagic Escherichia coli. MBio. 2012a;3:e00280–00212. doi: 10.1128/mBio.00280-12. [DOI] [PMC free article] [PubMed] [Google Scholar]
- Njoroge JW, Nguyen Y, Curtis MM, Moreira CG, Sperandio V. Virulence Meets Metabolism: Cra and KdpE Gene Regulation in Enterohemorrhagic Escherichia coli. mBio. 2012b;3 doi: 10.1128/mBio.00280-12. e00280-00212-e00280-00212. [DOI] [PMC free article] [PubMed] [Google Scholar]
- Ogura Y, Mondal SI, Islam MR, Mako T, Arisawa K, Katsura K, Ooka T, Gotoh Y, Murase K, Ohnishi M, et al. The Shiga toxin 2 production level in enterohemorrhagic Escherichia coli O157:H7 is correlated with the subtypes of toxin-encoding phage. Scientific reports. 2015;5:16663. doi: 10.1038/srep16663. [DOI] [PMC free article] [PubMed] [Google Scholar]
- Pacheco AR, Curtis MM, Ritchie JM, Munera D, Waldor MK, Moreira CG, Sperandio V. Fucose sensing regulates bacterial intestinal colonization. Nature. 2012;492:113–117. doi: 10.1038/nature11623. [DOI] [PMC free article] [PubMed] [Google Scholar]
- Russell RM, Sharp FC, Rasko DA, Sperandio V. QseA and GrlR/GrlA regulation of the locus of enterocyte effacement genes in enterohemorrhagic Escherichia coli. J Bacteriol. 2007a;189:5387–5392. doi: 10.1128/JB.00553-07. [DOI] [PMC free article] [PubMed] [Google Scholar]
- Russell RM, Sharp FC, Rasko DA, Sperandio V. QseA and GrlR/GrlA Regulation of the Locus of Enterocyte Effacement Genes in Enterohemorrhagic Escherichia coli. Journal of Bacteriology. 2007b;189:5387–5392. doi: 10.1128/JB.00553-07. [DOI] [PMC free article] [PubMed] [Google Scholar]
- Sadiq SM, Hazen TH, Rasko DA, Eppinger M. EHEC Genomics: Past, Present, and Future. Microbiology spectrum. 2014;2 doi: 10.1128/microbiolspec.EHEC-0020-2013. EHEC-0020-2013. [DOI] [PubMed] [Google Scholar]
- Sambrook J, Fritsch EF, Maniatis T. Molecular Cloning: A Laboratory Manual. 2. N.Y: Cold Spring Harbor Laboratory Press; 1989. [Google Scholar]
- Sperandio V, Mellies JL, Delahay RM, Frankel G, Crawford JA, Nguyen W, Kaper JB. Activation of enteropathogenic Escherichia coli (EPEC) LEE2 and LEE3 operons by Ler. Molecular Microbiology. 2000;38:781–793. doi: 10.1046/j.1365-2958.2000.02168.x. [DOI] [PubMed] [Google Scholar]
- Sperandio V, Mellies JL, Nguyen W, Shin S, Kaper JB. Quorum sensing controls expression of the type III secretion gene transcription and protein secretion in enterohemorrhagic and enteropathogenic Escherichia coli. Proc Natl Acad Sci U S A. 1999;96:15196–15201. doi: 10.1073/pnas.96.26.15196. [DOI] [PMC free article] [PubMed] [Google Scholar]
- Sperandio V, Torres AG, Jarvis B, Nataro JP, Kaper JB. Bacteria-host communication: The language of hormones. Proceedings of the National Academy of Sciences. 2003;100:8951–8956. doi: 10.1073/pnas.1537100100. [DOI] [PMC free article] [PubMed] [Google Scholar]
- Svenningsen SL, Costantino N, Court DL, Adhya S. On the role of Cro in λ prophage induction. Proceedings of the National Academy of Sciences of the United States of America. 2005;102:4465–4469. doi: 10.1073/pnas.0409839102. [DOI] [PMC free article] [PubMed] [Google Scholar]
- Svenningsen SL, Semsey S. Commitment to lysogeny is preceded by a prolonged period of sensitivity to the late lytic regulator Q in bacteriophage lambda. J Bacteriol. 2014;196:3582–3588. doi: 10.1128/JB.01705-14. [DOI] [PMC free article] [PubMed] [Google Scholar]
- Teel LD, Melton-Celsa AR, Schmitt CK, O’Brien AD. One of Two Copies of the Gene for the Activatable Shiga Toxin Type 2d in Escherichia coli O91:H21 Strain B2F1 Is Associated with an Inducible Bacteriophage. Infection and Immunity. 2002;70:4282–4291. doi: 10.1128/IAI.70.8.4282-4291.2002. [DOI] [PMC free article] [PubMed] [Google Scholar]
- Tochio H, Kojima C, Matsuo H, Yamazaki T, Kyogoku Y. Intermolecular contacts between the lambda-Cro repressor and the operator DNA characterized by nuclear magnetic resonance spectroscopy. J Biomol Struct Dyn. 1999;16:989–1002. doi: 10.1080/07391102.1999.10508309. [DOI] [PubMed] [Google Scholar]
- Tyler JS, Beeri K, Reynolds JL, Alteri CJ, Skinner KG, Friedman JH, Eaton KA, Friedman DI. Prophage Induction Is Enhanced and Required for Renal Disease and Lethality in an EHEC Mouse Model. PLoS Pathog. 2013;9:e1003236. doi: 10.1371/journal.ppat.1003236. [DOI] [PMC free article] [PubMed] [Google Scholar]
- Uzzau S, Figueroa-Bossi N, Rubino S, Bossi L. Epitope tagging of chromosomal genes in Salmonella. Proceedings of the National Academy of Sciences. 2001;98:15264–15269. doi: 10.1073/pnas.261348198. [DOI] [PMC free article] [PubMed] [Google Scholar]
- Wagner PL, Neely MN, Zhang X, Acheson DWK, Waldor MK, Friedman DI. Role for a Phage Promoter in Shiga Toxin 2 Expression from a Pathogenic Escherichia coli Strain. Journal of Bacteriology. 2001;183:2081–2085. doi: 10.1128/JB.183.6.2081-2085.2001. [DOI] [PMC free article] [PubMed] [Google Scholar]
- Waldor MK, Friedman DI. Phage regulatory circuits and virulence gene expression. Current Opinion in Microbiology. 2005;8:459–465. doi: 10.1016/j.mib.2005.06.001. [DOI] [PubMed] [Google Scholar]
- Walters M, Sperandio V. Autoinducer 3 and Epinephrine Signaling in the Kinetics of Locus of Enterocyte Effacement Gene Expression in Enterohemorrhagic Escherichia coli. Infection and Immunity. 2006;74:5445–5455. doi: 10.1128/IAI.00099-06. [DOI] [PMC free article] [PubMed] [Google Scholar]
- Winter SE, Thiennimitr P, Nuccio S-P, Haneda T, Winter MG, Wilson RP, Russell JM, Henry T, Tran QT, Lawhon SD, et al. Contribution of Flagellin Pattern Recognition to Intestinal Inflammation during Salmonella enterica Serotype Typhimurium Infection. Infection and Immunity. 2009;77:1904–1916. doi: 10.1128/IAI.01341-08. [DOI] [PMC free article] [PubMed] [Google Scholar]
- Zeng L, Skinner SO, Zong C, Sippy J, Feiss M, Golding I. Decision Making at a Subcellular Level Determines the Outcome of Bacteriophage Infection. Cell. 2010;141:682–691. doi: 10.1016/j.cell.2010.03.034. [DOI] [PMC free article] [PubMed] [Google Scholar]
- Zhang L, Chaudhuri RR, Constantinidou C, Hobman JL, Patel MD, Jones AC, Sarti D, Roe AJ, Vlisidou I, Shaw RK, et al. Regulators Encoded in the Escherichia coli Type III Secretion System 2 Gene Cluster Influence Expression of Genes within the Locus for Enterocyte Effacement in Enterohemorrhagic E. coli O157:H7. Infect Immun. 2004;72:7282–7293. doi: 10.1128/IAI.72.12.7282-7293.2004. [DOI] [PMC free article] [PubMed] [Google Scholar]
- Zheng L, Kelly CJ, Colgan SP. Physiologic hypoxia and oxygen homeostasis in the healthy intestine. A Review in the Theme: Cellular Responses to Hypoxia. Am J Physiol Cell Physiol. 2015;309:C350–360. doi: 10.1152/ajpcell.00191.2015. [DOI] [PMC free article] [PubMed] [Google Scholar]
- Zong C, So L-h, Sepúlveda LA, Skinner SO, Golding I. Lysogen stability is determined by the frequency of activity bursts from the fate-determining gene. Molecular Systems Biology. 2010;6 doi: 10.1038/msb.2010.96. [DOI] [PMC free article] [PubMed] [Google Scholar]
Associated Data
This section collects any data citations, data availability statements, or supplementary materials included in this article.