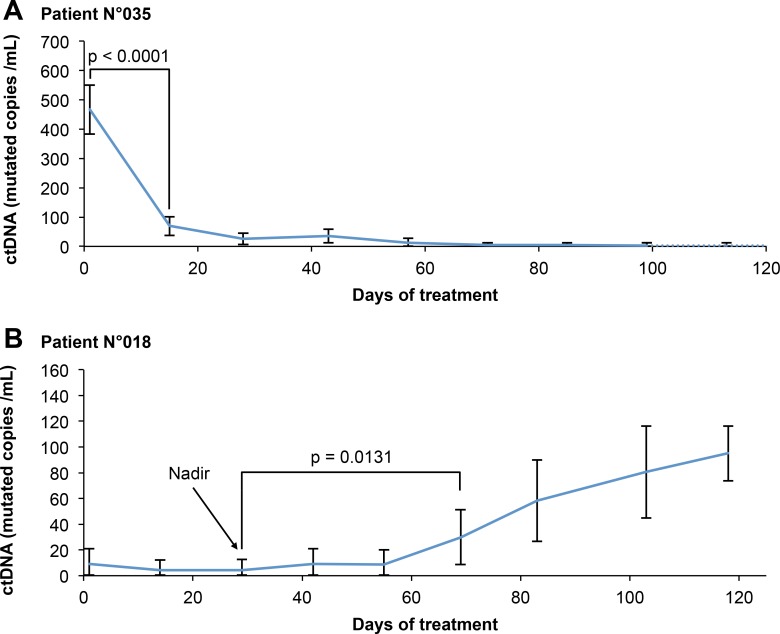
Figure 2. Example of use of our evaluation criteria for two representative patients.
(A) Patient of the OR + group: therapeutic response is associated with a decrease in ctDNA concentration. bR is evaluated according to the degree of significance of the decrease in ctDNA relative to the baseline, given the variability of the measure. (B) Patient of the OR-PD+ group: disease progression is associated with an increase in ctDNA concentration. bP is evaluated according to the degree of significance of the increase in ctDNA relative to the nadir, given the variability of the measure. Error bars represent the 95% confidence interval of each measure, calculated from the dPCR data as detailed in the method section.

