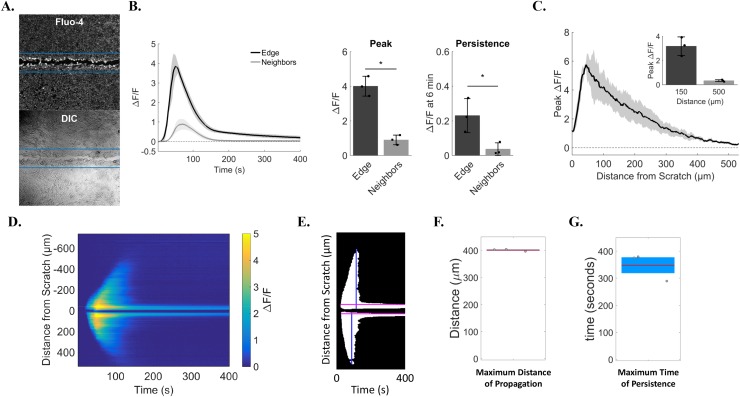
Figure 2. Quantification identifies cell sub-populations with distinct calcium transients.
(A) Relative change in Fluo-4 fluorescence was calculated as ΔF/F using automated regions of interest (ROI). ROI dimensions were set at 1.3mm (image width) by 250μm (125μm on either side of the scratch center line), and were used to quantify changes in calcium from cells at the wound edge (pixels within ROI) vs. neighboring cells (remaining pixels in image). Lower panel shows corresponding transmitted light image of upper panel. (B) Left, traces show ΔF/F data from wound edge cells and neighboring cells over time. Right, bar plots summarizing differences in peak and persistent scratch-induced calcium signals between edge and neighboring cells. Edge cells had a larger peak (4.0 ± 0.6) than neighbors (0.9 ± 0.3) and calcium persistence at 6 min was also greater in edge cells (0.2 ± 0.1) compared to neighbors (0.03 ± 0.04). (C) Peak ΔF/F was plotted for distances up to 500μm from the edge of the scratch to show total distance of signal propagation to neighboring cells away from the wound edge. Peak ΔF/F values for distances at 150μm and 500μm from the edge are also shown in the bar graph inset. Peak ΔF/F was greatest close to the wound edge (3.2 ± 0.8 at 150μm) vs. far distances (0.3 ± 0.1 at 500μm). (D) Total distance of signal propagation was also calculated using ROI-independent approaches. Kymographs were generated using y-axis time projections at each time point through 400 seconds. Kymographs show signal intensity propagating away from the wound edge between 40 and 150 seconds which reaches near baseline thereafter. In contrast, signal intensity at the wound edge shows persistence at 400 seconds. (E) Kymographs were then converted to binary images using a custom MATLAB based program, from which total time of persistence (in seconds, pink lines) and total distance of signal propagation from the wound edge were quantified (in μm, blue lines). (F) Maximum distance of scratch-induced signal propagation to neighboring cells (400.9 ± 3.9μm). (G) Maximum time of scratch-induced persistence in cells at the wound edge (347.7 ± 50.8sec). Data presented as mean ± standard deviation. *indicates significance from edge, P < 0.05 via paired t-test. All data represent N=3.

