

Abstract
Objective:
To compare rule-based data quality (DQ) assessment approaches across multiple national clinical data sharing organizations.
Methods:
Six organizations with established data quality assessment (DQA) programs provided documentation or source code describing current DQ checks. DQ checks were mapped to the categories within the data verification context of the harmonized DQA terminology. To ensure all DQ checks were consistently mapped, conventions were developed and four iterations of mapping performed. Difficult-to-map DQ checks were discussed with research team members until consensus was achieved.
Results:
Participating organizations provided 11,026 DQ checks, of which 99.97 percent were successfully mapped to a DQA category. Of the mapped DQ checks (N=11,023), 214 (1.94 percent) mapped to multiple DQA categories. The majority of DQ checks mapped to Atemporal Plausibility (49.60 percent), Value Conformance (17.84 percent), and Atemporal Completeness (12.98 percent) categories.
Discussion:
Using the common DQA terminology, near-complete (99.97 percent) coverage across a wide range of DQA programs and specifications was reached. Comparing the distributions of mapped DQ checks revealed important differences between participating organizations. This variation may be related to the organization’s stakeholder requirements, primary analytical focus, or maturity of their DQA program. Not within scope, mapping checks within the data validation context of the terminology may provide additional insights into DQA practice differences.
Conclusion:
A common DQA terminology provides a means to help organizations and researchers understand the coverage of their current DQA efforts as well as highlight potential areas for additional DQA development. Sharing DQ checks between organizations could help expand the scope of DQA across clinical data networks.
Introduction
Electronic health record (EHR) data offers both providers and researchers an opportunity to improve health-related decision-making and patient outcomes. The Health Information for Economic and Clinical Health (HITECH) Act of 2009 created Medicare and Medicaid incentive programs that increased Meaningful Use and adoption of EHRs [1,2]. As of 2015, more than $29 billion in Centers for Medicare & Medicaid Services (CMS) incentive program payments had been made and more than 500,000 eligible professionals, providers, and hospitals were actively registered in an incentive program [3]. The resulting large-scale deployment of EHRs has increased access to patient information and the amount of data available for secondary use [4,5].
EHRs are a resource for knowledge discovery and have facilitated significant advancement in clinical practice and research [6,7,8,9]. While the potential usage of these data offers significant promise, the quality of EHR-generated data have long been called into question [10,11,12,13,14]. This is a well-recognized problem; numerous efforts have been made to establish techniques to validate this data source [12,15,16,17,18,19,20]. In a review of 35 empirical studies, Chan, Fowles, and Weiner found a substantial lack of agreement regarding which data quality (DQ) dimensions were important to assess [12]. The authors discovered that, of the included studies, “66 percent assessed accuracy, 57 percent completeness, and 23 percent data comparability.” [12] A review by Weiskopf et al. of published data quality assessment (DQA) methods for secondary use found that, of the 95 articles examined, there were over 20 unique dimensions used to assess DQ [19]. Finally, a recent review by Chen et al. of DQA methods for assessing public health information systems identified 49 distinct dimensions used when measuring DQ; completeness, accuracy, and timeliness being those most frequently described [21]. While there is a wide variety of DQ dimensions one can choose from when assessing a data source, there are equally as many DQA programs and processes.
The motivation for engaging in DQA may differ depending upon the organization, provider, or researcher. Organizations governed by stakeholder requirements may be obligated to utilize very different tools, reporting methods, and assessment strategies than researchers aiming to answer specific research questions. Examining DQ practices in different organizations may provide invaluable insight into where existing DQA programs have focused their efforts to assess DQ to meet the data use needs of their stakeholders and to help establish a core set of common pragmatic DQA methods. While many organizations engaged in this kind of work have performed and published evaluations of their DQ programs [11,22,23,24], assessments performed at different DQ programs across organizations are yet to be compared. Two reasons that this type of assessment has not yet been made are the following: (1) the lack of a common DQ terminology that would allow DQ checks implemented and documented in different ways, from different organizations, to be compared in a standardized way; and (2) that many organizations may be unwilling to share details regarding their DQA program information.
Kahn and colleagues developed a harmonized DQA terminology unifying existing terminologies from the biomedical informatics field [25]. This harmonized DQA terminology describes a set of categories that operate within two DQA evaluation contexts, where confirmation of expectations about aspects of the data are based on comparisons to local knowledge, prespecified metadata (verification), or to external benchmarks and gold standards (validation). Within each of these data contexts there are three categories and eight subcategories (referred to as “harmonized DQA categories”):
Conformance: The degree to which the data comply with prespecified internal or external formatting constraints (Value Conformance), agree with structural constraints like primary key and foreign key relationships (Relational Conformance), and the accuracy of computationally derived values using existing variables (Calculation Conformance).
Completeness: The degree to which data are present is assessed at a single point in time (Atemporal Completeness) as well at multiple points across time (Temporal Completeness).
Plausibility: The degree to which data are believable is assessed through the agreement of logically constrained measures or distributions, and independent measurements of the same fact (Atemporal Plausibility); the temporal properties or sequences and state transitions of measures (Temporal Plausibility); and the presence of duplicated measurements, variable values, or records (Uniqueness Plausibility).
The harmonized DQA terminology encompasses only those DQA categories considered to be “intrinsic” (i.e., dimensions pertaining to the data values themselves) [26] to the data. It does not include extrinsic DQA categories (i.e., dimensions that are dependent on the context in which the data are used) related to the availability or timeliness of data for Meaningful Use or fitness-for-use criteria, nor the role that data categories might play in systems operations or security and privacy.
The current project leveraged the harmonized DQA terminology as a common standard for categorizing a robust sample of DQ checks obtained from organizations with established DQA programs and technologies. To provide a fair comparison of DQA activities at each organization, only those DQ checks within the data verification context were considered. While DQ checks within the data validation context are important, these checks are often less straightforward to define and perform (i.e., often require additional outside data sets or are purely based on graphical comparisons) than DQ checks within the data verification context. The current project aimed to examine the distribution of DQ checks across these organizations that were implemented with disparate methodologies using the harmonized DQA terminology.
Methods
Participants
Project Leaders from four organizations currently engaged in DQA (i.e., Kaiser Permanente’s Center for Effectiveness and Safety Research (CESR) [27], Sentinel [28,29], the Pediatric Learning Health System (PEDSnet) network [30], and the Pediatric Health Information System (PHIS) [31]) were recruited to participate via emailed project proposal. Additional participation was elicited from two organizations: Duke University School of Medicine’s Measurement to Understand the Reclassification of Cabarrus/Kannapolis (MURDOCK) [32] registry; and the Observational Health Data Sciences and Informatics (OHDSI) program (formerly Observational Medical Outcomes Partnership—OMOP) [33,34] via out-reach to collaborators during monthly meetings held as part of a larger Patient-Centered Outcomes Research Institute (PCORI) funded project (ME-1308-5581).
The organizations willing to participate in the project agreed to provide current DQ check documentation in a spreadsheet or PDF table; two organizations provided instructions on how to download DQ check information in the form of SQL or R code, and one organization provided detailed information on the DQ checks applicable to all tables in their database with accompanying data model documentation.
DQ Check Mapping Procedures
DQ Check documentation or code received from each organization was standardized (i.e., DQ checks were labeled with a name and corresponding description) and stored in a Microsoft Office Excel 2010 spreadsheet. For each organization, a separate spreadsheet tab was created; columns represented the harmonized DQA categories and subcategories, and rows represented the DQ checks. For each DQ check, one-point was allocated to the corresponding cell of the harmonized DQA terminology category it represented. For any DQ check represented by multiple harmonized DQA categories a portion of one-point was allocated—based on the number of represented categories—so that the total points for each row summed to one. For example, if a DQ check mapped to two different categories, each corresponding category of the DQ check would be allocated 0.5 points.
To ensure a systematic approach when mapping the DQ checks to the harmonized DQA categories, conventions were developed to operationalize each individual category within the data verification context of the harmonized DQA terminology. In addition to these conventions, example DQ checks representative of each harmonized DQA category from each organization were identified (see the table in Appendix A). Using these conventions and example DQ checks, the full set of DQ checks were mapped four times. Any check not able to be clearly mapped was discussed with the research team until a final mapping consensus was reached.
Results
As shown in Table 1, the majority of participating organizations were part of a clinical research network founded within the last 10 years and had governance that focused on the requirements of external stakeholders (e.g., funders). Most of the organizations utilized a distributed network comprising 7–50 network sites with 11,749–660 million patient records. The primary analytical focus ranged from chronic disease surveillance (adult and pediatric), comparative effectiveness and improvement to generalized large-scale analytics. Common data models (CDMs) were used by four of the six organizations.
Table 1.
Participating Organization Characteristics
| CHARACTERISTIC | CESR | MURDOCK | OHDSI | PEDSNET | PHIS | SENTINEL |
|---|---|---|---|---|---|---|
| Organization Type | Clinical Research Network | Registry and Biorepository | Open Science Collaborative | Clinical Research Network | Member Association | Clinical Research Network |
| Date Founded | 2010 | 2007 | 2014 | 2013 | 1993 | 2008 |
| Stakeholdersa | Internal External | Internal External | External | External | External | External |
| Network Typeb | Distributed | Data Center | Distributed | Distributed | Data Center | Distributed |
| Network Sites (#) | 7 | 8 | 50 | 8 | 49 | 18 |
| Patient Recordsc | 10,400,000 | 11,749 | 660,000,000 | 5,112,227 | 22,000,000 | 193,000,000 |
| Primary Analytical Focus | Comparative Effectiveness and Safety | Precision Medicine | Large-Scale Analytics | Pediatric Disease Surveillance | Comparative Effectiveness | Medical Product Safety Surveillance |
| Common Data Modeld | CESR VDWe | — | OMOPf | OMOP | — | SCDMg |
| DQA Coordination | Centralized | Centralized | Distributed | Centralized | Centralized | Centralized |
| DQ Employees (#)h | 2 | 1 | Varies by site | 2 | 2 | 8 |
| DQA Programs and Tools | SAS | SAS | OHDSI toolsi | R, OHDSI tools | SAS/SAP Business Objects | Sentinel toolsj |
| DQ Checks Providedk | 3,434 | 3,220 | 172 | 875 | 1,835 | 1,487 |
| Received DQ Check Format | General Check List and VDW Information | Documented Check List | SQL Code | R Code | Documented Check List | Documented Check List |
| DQ Check Access | CESR Staff | MURDOCK Faculty | Open Source; GitHubl | Open Source GitHubm | PHIS staff | Open Source; Sentinel websiten |
Notes: aStakeholders: Refers to the governing group or organization for the project, not specifically for DQ-related work.
bNetwork Type: Refers to the organizations providing the data for secondary use, not the network where the patients are seen and the data is collected.
cPatient Records: Depending on the organization, refers to either the current active patient records (CESR, MURDOCK, PEDSnet) or all available patient records (OHDSI, PHIS, Sentinel).
dCommon Data Model: Refers to the data model that is used for data sharing, unless the organization utilizes a single data model for multiple purposes (i.e., for data storage versus data sharing); this distinction is not denoted in the table.
eThe Center for Effectiveness & Safety Research (CESR) Virtual Data Warehouse (VDW) is an expanded data model built on top of the Health Care Systems Research Network (HCSRN) VDW. http://cesr.kp.org/en/
fObservational Medical Outcomes Partnership (OMOP).
gSentinel Common Data Model (SCDM).
hDQ employees: Individuals who are not hired specifically to conduct DQ-related work, but who purposefully dedicate a portion of their FTE to assessing DQ.
iTool information can be found on the OHDSI home page: http://www.ohdsi.org/
jSentinel Data QA SAS tools and information can be found at the website: http://www.mini-sentinel.org/
kThe total number of provided DQ checks shown includes only those checks that were mapped to categories within the data verification context.
lAutomated Characterization of Health Information at Large-scale Longitudinal Evidence Systems (ACHILLES) Heel DQ checks obtained from https://github.com/OHDSI/Achilles/blob/master/inst/sql/sql_server/Achilles_v5.sql
mPEDSnet DQ checks obtained from https://github.com/PEDSnet; permission required to access code repository
nSentinel DQ checks obtained from http://www.mini-sentinel.org/data_activities/distributed_db_and_data/details.aspx?ID=131
DQ Check Mapping
Participating organizations provided a total of 11,041 DQ checks of which 11,026 checks mapped to the Data Verification context. In the materials provided by the organizations, there were only 15 checks in the Data Validation context; these were eliminated from the rest of the analysis. Of 11,026 DQ checks, nearly all (99.97 percent) were successfully mapped to at least one of the harmonized DQA categories (Table 2). Three PHIS DQ checks were unable to be mapped to the harmonized DQA terminology. One of these DQ checks dealt with hospital processes and the other two dealt with quality checks performed at the time of data entry. Of the mapped DQ checks (n=11,023), 214 (1.94 percent) mapped to more than one of the harmonized DQA terminology categories; multiple mappings occurred between the Atemporal Completeness and Value Conformance categories (Sentinel, PEDSnet, and PHIS DQ checks).
Table 2.
DQ Check Coverage by DQA Category by Organization
| DQ HARMONIZATION TERMINOLOGY CATEGORIES | ORGANIZATIONS |
|||||||
|---|---|---|---|---|---|---|---|---|
| CESR N (%) | MURDOCK N (%) | OHDSI N (%) | PEDSnet N (%) | PHIS N (%) | SENTINEL N (%) | TOTAL N (%) | ||
| Conformance | Value | 1,434 (41.76) | 43 (1.34) | 0 (0.00) | 3 (0.34) | 65.5 (3.57) | 421 (28.31) | 19,66.5 (17.84) |
| Relational | 786 (22.89) | 36 (1.12) | 25 (14.53) | 13 (1.49) | 114 (6.21) | 42 (2.82) | 1,016 (9.22) | |
| Calculation | 50 (1.46) | 0 (0.00) | 5 (2.91) | 0 (0.00) | 10 (0.54) | 1 (0.07) | 66 (0.60) | |
| Completeness | Atemporal | 754 (21.96) | 9 (0.28) | 3 (1.74) | 367.5 (42.00) | 186.5 (10.16) | 111 (7.46) | 1,431 (12.98) |
| Temporal | 0 (0.00) | 0 (0.00) | 0 (0.00) | 0 (0.00) | 22 (1.20) | 0 (0.00) | 22 (0.20) | |
| Plausibility | Uniqueness | 1 (0.03) | 0 (0.00) | 0 (0.00) | 0 (0.00) | 29 (1.58) | 18 (1.21) | 48 (0.44) |
| Atemporal | 207 (6.03) | 3,031 (94.13) | 87 (50.58) | 315 (36.00) | 1,300 (70.84) | 527 (35.44) | 5,467 (49.60) | |
| Temporal | 202 (5.88) | 101 (3.14) | 52 (30.23) | 176.5 (20.17) | 108 (5.89) | 367 (24.68) | 1,006.5 (9.13) | |
| Provided DQ Checks | 3,434 | 3,220 | 172 | 875 | 1,835 | 1,487 | 11,023 | |
Notes: A total value of one was assigned to each mapped DQ check; DQ checks mapped to two categories were each given a value of 0.5.
The harmonized DQA terminology coverage of mapped DQ is shown in Figure 1. The mapping distribution varied widely, with 49.60 percent (n=5,467) mapping to Atemporal Plausibility, 17.84 percent (n=1,966.5) to Value Conformance, 12.98 percent (n=1,431) to Atemporal Completeness, 9.22 percent (n=1,016) to Relational Conformance, 9.13 percent (n=1,006.5) to Temporal Plausibility, 0.60 percent (n=66) to Calculation Conformance, 0.44 percent (n=48) to Uniqueness Plausibility, and 0.20 percent (n=22) mapping to the Temporal Completeness category.
Figure 1.
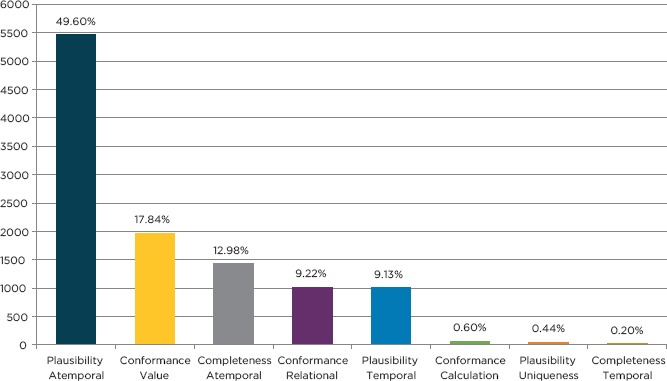
Harmonized DQA Terminology Mapped DQ Check Coverage
Mapped DQ Check Distributions
As shown in Table 2, all of the organizations provided DQ checks that mapped to the Atemporal Plausibility (6.03 percent–94.13 percent), Temporal Plausibility (3.14 percent–30.23 percent), Atemporal Completeness (0.28 percent–42.00 percent), and Relational Conformance (1.12 percent–22.89 percent) categories. Additionally all of the organizations, except OHDSI, provided DQ checks that mapped to the Value Conformance (0.34 percent–41.76 percent) categories, and only PHIS provided DQ checks that mapped to the Temporal Completeness (1.20 percent) category.
As shown in Figure 2, the harmonized DQA terminology mapped-DQ check distribution varied widely across the participating organizations. In general, Sentinel, PEDSnet, and PHIS appeared to have similar distributions of mapped-DQ checks, such that the three most mapped harmonized DQA categories were: Atemporal Plausibility (35.44 percent–70.84 percent), Temporal Plausibility (5.89 percent–24.68 percent), and Atemporal Completeness (7.46 percent–42.00 percent). PHIS was the only organization with DQ checks that mapped to all of the DQA categories.
Figure 2.
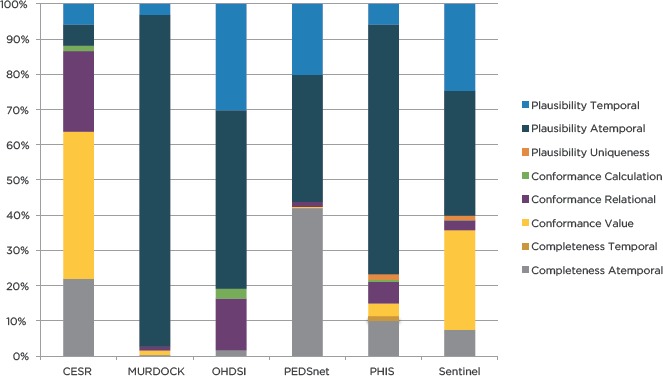
Harmonized DQA Terminology Coverage of Mapped DQ Checks by Organization
The remaining three organizations had very distinct mapped-DQ check distributions: OHDSI (50.58 percent Atemporal Plausibility and 30.23 percent Temporal Plausibility), MURDOCK (94.13 percent Atemporal Plausibility and 3.14 percent Temporal Plausibility), and CESR (41.76 percent Value Conformance and 22.89 percent Relational Conformance). DQ checks from OHDSI mapped to the fewest DQA categories, but they also provided the fewest number of DQ checks (n=172).
Discussion
Meaningful Use rules require hospitals and practitioners to participate in population-specific clinical data registries, which will most likely be populated using EHR data. Wanting the most representative, robust sample, researchers often leverage many diverse data sets (e.g., procedures, lab results, and medications) collected across multiple EHRs. Since different hospitals utilize different vocabularies and terminologies—e.g., Systematized Nomenclature of Medicine (SNOMED) versus Logical Observation Identifiers Names and Codes (LOINC) codes, International Classification of Diseases (ICD) versus Current Procedural Terminology (CPT)—data sets must be standardized to a CDM before they can be integrated. In a similar fashion, comparing existing DQA programs and DQA tools from multiple organizations requires a common DQA framework.
The current project examined the distribution of DQ checks across these organizations that were implemented with disparate methodologies using the harmonized DQA terminology [25]. Over 11,000 DQ checks from six participating organizations were received, nearly all of which were successfully mapped to the harmonized DQ terminology categories. These findings provide validation for the harmonized DQA terminology, highlighting its ability to successfully represent a robust sample of DQ checks across highly diverse data networks. Provided DQ checks were mapped to all of the harmonized DQ categories in the data verification context. DQ checks within the data validation context were not considered for mapping due to the low number of provided checks that mapped to this category. These types of checks are much harder to perform than those within the data verification context, and as a result are harder to standardize and compare.
Organization Differences
Three of the organizations (Sentinel, PEDSnet, and PHIS) had similar DQ check coverage distributions. These organizations were focused on meeting the DQ expectations of external stakeholders and had distributed network sites (> 8 sites) with over five million patient records; they had extremely well-documented DQ checks and procedures for evaluating their data. These organizations primarily evaluated Atemporal Plausibility, Atemporal Completeness, and Value Conformance. Sentinel and PEDSnet created open-source tools to help evaluate DQ-related to their analytical focus (i.e., medical product safety and pediatric disease surveillance).
CESR is also a distributed clinical research network like Sentinel, PEDSnet, and OHDSI, but it must meet the DQ expectation of both internal and external stakeholders. Like Sentinel and PEDSnet, CESR has developed its own tools for performing DQA. Unlike these organizations, CESR’s DQ checks are not publically documented and are not publically available, but are freely shared upon request; CESR may be subject to internal restrictions regarding how DQA is performed. The bulk of their DQ checks focused on Value Conformance, Relational Conformance, and Atemporal Completeness. This organization also indicated that some of the DQ checks that they perform to assess plausibility do not involve comparisons to other sites within their network. These types of checks were not included in the current project.
MURDOCK is a registry and biorepository, which is managed by internal and external stakeholders. This organization collects data from participants at multiple sites and enrollment events (i.e., health fairs coordinated by MURDOCK study office), but stores the least amount of patient records (<12,000) compared to the other organizations. Although they collect EHR data for some enrolled participants, the registry does not contain all patient records from any of the participating facilities’ EHR as the others do. This organization utilizes several different CDMs, depending on the task at hand (i.e., data sharing versus data storage), and its DQ check documentation is not open source. Like OHDSI, the majority of its DQ checks were focused on Atemporal Plausibility. This organization documents only DQ integrity checks; additional DQ checks for completeness were performed through data-profiling software.
The OHDSI open science collaborative is focused on large-scale analytics for clinical characterization, population-level effect estimation, and patient-level prediction. Like Sentinel, OHDSI developed its own community-driven CDM (i.e., OMOP) as well as its own suite of tools for assessing DQ, which are well documented and open source. Institutions participating in OHDSI store over 660 million patient records across 50 institutions, and it is one of the youngest organizations to provide DQ checks. OHDSI is the only organization that has distributed DQA coordination (i.e., different individuals are responsible for reviewing the DQ of sites in their network). This is a distinguishing characteristic in that all of the other organizations are in the position to “reject” data prior to use on a routine basis, but as an open collaborative, OHDSI does not play that type of central role, leaving individual investigators and projects to make a “fitness-for-use” determination. Its DQ checks were primarily focused on Atemporal Plausibility. This organization provided the fewest DQ checks, which may be related to the fact that much of the DQA performed by this organization occurs when transforming data into its CDM or as “fitness-for-use” DQ assessments for specific studies.
DQA Maturity Model
Different organizations are likely at different stages of maturity in their DQA activities as indicated by differences in the mapped check distributions and the features of each organization (see Table 1). Unfortunately, there was no way to assess this in the absence of a framework. While similar work has been proposed by Baskarada et al. [35], their work focuses on organizational data governance and is broader than the scope of DQA. Thus, the research team applied the Capability Maturity Model Integration (CMMI) [36,37]. Evaluating the legitimacy of the proposed DQA maturity levels was not within the scope of the current project; it is described here as inspiration for future work.
DQA Maturity Model Levels
Level 1: Initial
While organizations at this maturity level may recognize the importance of conducting DQA, they currently have no formal DQA plan (i.e., no documented list of DQ checks or remediation procedures for identified DQA issues) in place and do not allocate resources to conducting DQA. The DQA work performed is usually for addressing a specific need for a specific analysis, and the tools that are used for performing DQA will be specific to the preference of an individual user.
MURDOCK is classified between this level and level 2 in terms of the maturity of its DQA procedures. While this organization recognizes the importance of DQA and has allocated some resources to conducting DQA-related work, it has not yet developed a consistent DQA process, lacks standardized tool use, and has no ongoing infrastructure for DQA.
Level 2: Repeatable and Defined
The transition to maturity level 2 requires the establishment of a “disciplined process” and a “standard, consistent process.” [37] An organization operating at these combined maturity levels will have created a standard, documented DQA and remediation plan. This plan will have been developed for specific tasks or use-cases frequently performed by the organization. The organization will have dedicated some resources to conducting DQA, including a few staff members who dedicate a significant amount of time to performing DQA. To ensure consistency of the DQA performed, the organization will have mandated the use of specific tools for all staff members engaged in DQA.
OHDSI is classified between level 2 and level 3 in terms of the maturity of its DQA procedures. This organization has developed and documented procedures for conducting DQA, including developing its own CDM and tools. The majority of its DQA work is distributed; the primary responsibility for conducting DQA falls on the collaborating party providing the data, not on a DQA team. Further, while this organization has dedicated significant community-donated resources to developing tools specifically for conducting DQA, improving these processes is dependent on the efforts of interested contributors rather than centralized dedicated resources.
Level 3: Managed and Optimizing
The transition to maturity level 3 requires the establishment of a “predictable process” and a “continuously improving process.” [37] An organization operating at these combined maturity levels will have standardized, well-documented DQA and remediation plans and tools for all performed tasks (i.e., DQA and remediation plans designed for specific tasks) that are hosted in a format that facilitates the continual evolution of its DQA procedures (e.g., GitHub). Organizations have dedicated significant resources including the establishment of a DQA team that is managed by an expert in the field who ensures the accuracy and reproducibility of the performed DQA work. While not a requirement, organizations that have reached this level may facilitate DQA for multiple network sites.
CESR, PHIS, PEDSnet, and Sentinel are classified in this level in terms of the maturity of their DQA procedures. All of these organizations have their own CDMs and have very consistent coordinated DQA processes and remediation procedures in place. They have allocated resources including a specific team dedicated to conducting DQA, which they use to manage other sites providing data for DQA. Finally, these organizations (with feedback and collaboration from their network sites) are continually adapting, modifying, and improving their procedures based on intended use, a fundamental aspect of this maturity level.
When combined with the results of this project, the maturity levels described above can be leveraged as a powerful tool for improving DQ. They can also be leveraged to foster collaboration. Each level of the maturity model was developed using real tools from organizations currently conducting DQA. It is our hope that the findings from this project will help create collaborations between organizations wanting to improve the quality of their data, regardless of their current maturity level. Specific examples are provided below:
An organization not currently conducting DQA, but that intended to start, could request resources and elicit specific advice and guidance from a Level 1 or 2 organization like MURDOCK. While MURDOCK has not yet developed a consistent process, it recognizes the importance of DQA and has begun the necessary steps to develop an ongoing infrastructure for DQA.
A Level 1 organization that wanted to improve its DQ could leverage the framework and quality processes utilized by a Level 2 or 3 organization like OHDSI. OHDSI has a very active community of collaborators and makes all of its DQA documentation openly available on GitHub. Thus, interested organizations could access members of the OHDSI community with differing levels of expertise and experience, and could gain assistance in adopting and applying its open source tools.
A Level 2 organization that wanted to improve its DQ could utilize processes and materials from Level 3 organizations like CESR, PHIS, PEDsnet, or Sentinel. These Level 3 organizations have well-established DQA programs with many participating network sites. Comparing an organization’s DQ checks and procedures to those used by a Level 3 organization could highlight areas for improvement.
Limitations
The current project relied on the DQ check documentation provided by each of the participating organizations. It is very likely that there are DQ checks, such as data verification checks involving visualizations, that are not necessarily documented and thus were not included in the current analysis. Also not included are DQ checks within the data validation context of the terminology as well as extensive project-specific checks that have been historically performed, such as an example from Sentinel [38]. Finally, other data networks, such as PCORnet [39], have established new DQ programs that were not included. As PCORnet has adopted many of its DQ checks from Sentinel, the mapped DQ check distributions of these organizations should be fairly similar.
While the organizations were willing to help provide information on their currently utilized DQ checks, they provided a differing number of DQ checks with information at differing levels of detail. For those organizations without detailed documentation (i.e., those providing general lists of DQ checks and programming code), it is difficult to determine how thorough and accurate our interpretations of the provided materials were. Additionally it is reasonable to assume that organizations share and adapt DQ checks; the uniqueness of these DQ checks was not explored.
The coverage of the harmonized DQA terminology was tested on only the DQ checks provided by organizations willing to participate in the current project. Additionally, the current project was not able to include DQ checks that would fall within the data validation context of the terminology due to the lack of these checks in the available documentation. Assessing the coverage of the terminology utilizing these types of checks is important for fully understanding the comprehensiveness of the terminology. There may be organizations and independent researcher’s utilizing DQ checks that are very different from those mapped as part of the current project. Additionally the current project was able to obtain only DQ checks that were developed to evaluate the quality of EHR and administrative claims data. Obtaining a more diverse set of DQ checks developed for use on alternative types of data may yield different findings. Finally, the current project does not include DQ checks that result from the manual review of DQA reports by an expert. While these types of checks are important, they are often inconsistently performed and lack documentation.
None of the individuals involved with DQA at any of the organizations participated in the DQ check mapping process. Only members of the research team interpreted the function of each organization’s DQ checks and performed the mapping. Thus, it is possible for some of the DQ checks to have been misinterpreted. Finally, no formal DQ check mapping validation was performed to verify the approach utilized in the current study. That being said, each of the 11,023 DQ checks were mapped multiple times, and each time a difficult-to-map DQ check was encountered, a research team member was consulted until a consensus was reached.
Future Work
Future work should focus on expanding this validation to alternative types of data (e.g., “-omic” and self-reported data) as well as to include checks within both the data verification and data validation contexts of the terminology. To help make the mapping process more efficient, a formal categorization schema and set of mapping conventions (beyond what was developed in the current project) should be created and verified. There was large variation in the distribution of mapped DQ checks across organizations; identifying a set of DQ checks that best represent each of the harmonized DQA categories is a crucial next step. Finally future work should examine the utility of the hypothesized DQ Maturity Model for encouraging DQA practice.
Conclusion
The current project mapped DQ checks from six different organizations currently involved in DQA work to the harmonized DQA terminology. Results provide initial support for the use of this harmonized DQA terminology with evidence from over 11,000 mapped DQ checks. Organizations can use this terminology to understand the scope and breadth of existing DQ work, to understand how DQ resources are utilized, and to see which DQ features are being examined or overlooked.
Appendix A. Supplementary Material
Table 1.
DQ Check Mapping Conventions and Example DQ Checks from Participating Organizations
| HARMONIZED TERMINOLOGY | CONVENTIONS | ||
|---|---|---|---|
| Category | Category | Mapping Convention | Example DQ check (Organization) |
| Conformance | Value | The DQ check examines the formatting of variables (i.e., length, string/numeric variable typing). | Type: Check the type of variable (CESR) |
| Abnormal Flag valid values are LL for low panic, L for low, H for high, HH for high panic, and A for abnormal. Are other values present? (MURDOCK) | |||
| Relational | The DQ check examines the relational database constraints (e.g., primary and foreign key relationships), as well constraints specified by the metadata (e.g., table existence). | Compare the number of records in person table with the number of records in observation_period table (PEDSnet) | |
| At least one PatID in the ENR table is not in the DEM table (Sentinel) | |||
| Calculation | The DQ check examines computationally derived variables. | For IP stays only, compute LOS (adate-ddate) (CESR) | |
| Admit date = date of physician order to admit as inpatient. LOS does not include time prior to admit order, i.e. time in ED, observation (PHIS) | |||
| Completeness | Atemporal | The DQ check examines counts of missing or available single variable or multiple variables at one time point. | Describe missing values (PEDSnet) |
| Fire if date_of_birth is null (MURDOCK) | |||
| Temporal | The DQ check examines counts of missing or available single variable or multiple variables across multiple time points. | Medical Discharge Hour values are missing for >=8 consecutive hours (and <100% single value) (PHIS) | |
| Plausibility | Uniqueness | The DQ check tests for duplicated variables, variable values, and records. | Enr_End occurs more than once in the file in combination with PatID, MedCov, and DrugCov (Sentinel) |
| Classify how many records: 1 = no duplicate admission to same facility, 2+ = duplicate admission (CESR) | |||
| Atemporal | The DQ check examines the range or distribution of a single variable (e.g., height or weight) or the relationship between multiple variables (e.g., gender and procedure type) to determine if values are correct. | Distribution of age at first observation period (OHDSI) | |
| HEIGHT is not between 36 and 84 (MURDOCK) | |||
| Temporal | The DQ check examines the believability of data values over a certain period of time (e.g., hours, days, years). | Number of visit records with end date < start date (OHDSI) | |
| Count number of observations by year across all years of data (CESR) | |||
Note: The conventions in the table are generalized to the category level of the harmonized DQA terminology.
References
- 1.Wright A. Henkin S, Feblowitz J, McCoy AB, Bates DW, Sittig DF. Early results of the meaningful use program for electronic health records. N Engl J Med. 2013. February 21;368(8):779–80. [DOI] [PubMed] [Google Scholar]
- 2.Centers for Disease Control. Introduction: Meaningful Use [Internet]. [cited 2016 Jul 8]. Available from: http://www.cdc.gov/ehrmeaningfuluse/introduction.html
- 3.Centers for Medicare & Medicaid Services. Data and Program Reports [Internet]. 2016. [cited 2016 Jul 8]. Available from: https://www.cms.gov/Regulations-and-Guidance/Legislation/EHRIncentivePrograms/DataAndReports.html
- 4.Heisey-Grove D, Danehy L-N, Consolazio M, Lynch K, Mostashari F. A national study of challenges to electronic health record adoption and meaningful use. Med Care. 2014. February;52(2):144–8. [DOI] [PubMed] [Google Scholar]
- 5.Weng C, Appelbaum P, Hripcsak G, Kronish I, Busacca L, Davidson KW, et al. Using EHRs to integrate research with patient care: promises and challenges. J Am Med Inform Assoc JAMIA. 2012. October;19(5):684–7 [DOI] [PMC free article] [PubMed] [Google Scholar]
- 6.Safran C, Bloomrosen M, Hammond WE, Labkoff S, Markel-Fox S, Tang PC, et al. Toward a national framework for the secondary use of health data: an American Medical Informatics Association White Paper. J Am Med Inform Assoc. 2007;14(1):1–9. [DOI] [PMC free article] [PubMed] [Google Scholar]
- 7.Weiner MG, Embi PJ. Toward reuse of clinical data for research and quality improvement: the end of the beginning? Ann Intern Med. 2009;151(5):359–60. [DOI] [PubMed] [Google Scholar]
- 8.Hripcsak G, Albers DJ. Next-generation phenotyping of electronic health records. J Am Med Inform Assoc JAMIA. 2013. January 1;20(1):117–21. [DOI] [PMC free article] [PubMed] [Google Scholar]
- 9.Hersh WR, Weiner MG, Embi PJ, Logan JR, Payne PRO, Bernstam EV, et al. Caveats for the use of operational electronic health record data in comparative effectiveness research. Med Care. 2013. August;51(8 Suppl 3):S30–7. [DOI] [PMC free article] [PubMed] [Google Scholar]
- 10.Bae MD, Griffith S, Fan Y, Dunphy RN, Thompson MS, Parchman MHA, et al. The Challenges of Data Quality Evaluation in an EHR-based Data Registry. 2014. [cited 2016 Jul 8]; Available from: http://repository.edm-forum.org/symposia/june2014/panels/15/
- 11.Brown JS, Kahn M, Toh S. Data quality assessment for comparative effectiveness research in distributed data networks. Med Care. 2013. August;51(8 Suppl 3):S22–9. [DOI] [PMC free article] [PubMed] [Google Scholar]
- 12.Chan KS, Fowles JB, Weiner JP. Review: electronic health records and the reliability and validity of quality measures: a review of the literature. Med Care Res Rev MCRR. 2010. October;67(5):503–27. [DOI] [PubMed] [Google Scholar]
- 13.van der Lei J. Use and abuse of computer-stored medical records. Methods Inf Med. 1991. April;30(2):79–80. [PubMed] [Google Scholar]
- 14.Burnum JF. The misinformation era: the fall of the medical record. Ann Intern Med. 1989. March 15;110(6):482–4. [DOI] [PubMed] [Google Scholar]
- 15.Botsis T, Hartvigsen G, Chen F, Weng C. Secondary Use of EHR: Data Quality Issues and Informatics Opportunities. AMIA Jt Summits Transl Sci Proc AMIA Summit Transl Sci. 2010;2010:1–5. [PMC free article] [PubMed] [Google Scholar]
- 16.Kahn MG, Raebel MA, Glanz JM, Riedlinger K, Steiner JF. A pragmatic framework for single-site and multisite data quality assessment in electronic health record-based clinical research. Med Care. 2012. July;50 Suppl:S21–9. [DOI] [PMC free article] [PubMed] [Google Scholar]
- 17.Liaw ST, Rahimi A, Ray P, Taggart J, Dennis S, de Lusignan S, et al. Towards an ontology for data quality in integrated chronic disease management: a realist review of the literature. Int J Med Inf. 2013. January;82(1):10–24. [DOI] [PubMed] [Google Scholar]
- 18.Weiskopf NG, Hripcsak G, Swaminathan S, Weng C. Defining and measuring completeness of electronic health records for secondary use. J Biomed Inform. 2013. October;46(5):830–6. [DOI] [PMC free article] [PubMed] [Google Scholar]
- 19.Weiskopf NG, Weng C. Methods and dimensions of electronic health record data quality assessment: enabling reuse for clinical research. J Am Med Inform Assoc JAMIA. 2013. January 1;20(1):144–51. [DOI] [PMC free article] [PubMed] [Google Scholar]
- 20.Johnson SG, Speedie S, Simon G, Kumar V, Westra BL. A Data Quality Ontology for the Secondary Use of EHR Data. AMIA Annu Symp Proc AMIA Symp AMIA Symp. 2015;2015:1937–46. [PMC free article] [PubMed] [Google Scholar]
- 21.Chen H, Hailey D, Wang N, Yu P. A review of data quality assessment methods for public health information systems. Int J Environ Res Public Health. 2014. May;11(5):5170–207. [DOI] [PMC free article] [PubMed] [Google Scholar]
- 22.Long J, Richards J, Seko C. The Canadian Institute for Health Information (CIHI) Data Quality Framework, Version 1: A Meta-Evaluation and Future Directions. In: Proceedings of the Sixth International Conference on Information Quality [Internet] 2001. [cited 2016 Jul 8]. p. 370–83. Available from: http://ssm-vm030.mit.edu/ICIQ/Documents/IQ%20Conference%202001/Papers/TheCanadianInstitute4HealthInfoDQFrame.pdf [Google Scholar]
- 23.Bauck A, Bachman D, Riedlinger K, Walker K, Luke S, Donovan J, et al. C-A1-02: Developing a Structure for Programmatic Quality Assurance Checks on the Virtual Data Warehouse. Clin Med Res. 2011;9(3-4):184–184. [Google Scholar]
- 24.Hartzema AG, Reich CG, Ryan PB, Stang PE, Madigan D, Welebob E, et al. Managing data quality for a drug safety surveillance system. Drug Saf. 2013. October;36 Suppl 1:S49–58. [DOI] [PubMed] [Google Scholar]
- 25.Kahn M, Callahan T, Barnard J, Bauck A, Brown J, Davidson B, et al. A Harmonized Data Quality Assessment Terminology and Framework for the Secondary Use of Electronic Health Record Data. EGEMs Gener Evid Methods Improve Patient Outcomes [Internet]. 2016. September 11;4(1). Available from: http://repository.edm-forum.org/egems/vol4/iss1/18 [DOI] [PMC free article] [PubMed] [Google Scholar]
- 26.Wang RY, Strong DM. Beyond accuracy: What data quality means to data consumers. J Manag Inf Syst. 1996;12(4):5–33. [Google Scholar]
- 27.Center for Effectiveness & Safety Research [Internet]. [cited 2016 Aug 24]. Available from: http://cesr.kp.org/en/
- 28.Ball R, Robb M, Anderson S, Dal Pan G. The FDA’s sentinel initiative—A comprehensive approach to medical product surveillance. Clin Pharmacol Ther. 2016. March 1;99(3):265–8. [DOI] [PubMed] [Google Scholar]
- 29.Behrman RE, Benner JS, Brown JS, McClellan M, Woodcock J, Platt R. Developing the Sentinel System — A National Resource for Evidence Development. N Engl J Med. 2011. February 10;364(6):498–9. [DOI] [PubMed] [Google Scholar]
- 30.Utidjian LH, Khare R, Burrows E, Schulte G. Identifying and Understanding Data Quality Issues in a Pediatric Distributed Research Network. In: 2015 AAP National Conference and Exhibition [Internet] American Academy of Pediatrics; 2015 [cited 2016 Aug 24]. Available from: https://aap.confex.com/aap/2015/webprogrampress/Paper30131.html [Google Scholar]
- 31.PHIS [Internet]. [cited 2016 Aug 24]. Available from: https://www.childrenshospitals.org/programs-and-services/data-analytics-and-research/pediatric-analytic-solutions/pediatric-health-information-system
- 32.Bhattacharya S, Dunham AA, Cornish MA, Christian VA, Ginsburg GS, Tenenbaum JD, et al. The Measurement to Understand Reclassification of Disease of Cabarrus/Kannapolis (MURDOCK) Study Community Registry and Biorepository. Am J Transl Res. 2012;4(4):458–70. [PMC free article] [PubMed] [Google Scholar]
- 33.Hripcsak G, Duke JD, Shah NH, Reich CG, Huser V, Schuemie MJ, et al. Observational Health Data Sciences and Informatics (OHDSI): Opportunities for Observational Researchers. Stud Health Technol Inform. 2015;216:574–8. [PMC free article] [PubMed] [Google Scholar]
- 34.Overhage JM, Ryan PB, Reich CG, Hartzema AG, Stang PE. Validation of a common data model for active safety surveillance research. J Am Med Inform Assoc JAMIA. 2012;19(1):54–60. [DOI] [PMC free article] [PubMed] [Google Scholar]
- 35.Baskarada S, Gao J, Koronios A. Agile Maturity Model Approach to Assessing and Enhancing the Quality of Asset Information in Engineering Asset Management Information Systems [Internet] Rochester, NY: Social Science Research Network; 2005. May [cited 2016 Aug 22]. Report No.: ID 2149356. Available from: http://papers.ssrn.com/abstract=2149356 [Google Scholar]
- 36.Paulk M. Capability maturity model for software. Encycl Softw Eng [Internet]. 1993. [cited 2016 Jul 20]; Available from: http://onlinelibrarywiley.com/doi/10.1002/0471028959.sof589/full
- 37.Paulk M, Weber C, Garcia-Miller S, Chrissis MB, Bush M. Key Practices of the Capability Maturity Model Version 1.1 [Internet]. Software Engineering Institute; 1993. Available from: http://resources.sei.cmu.edu/library/asset-view.cfm?assetid=11965
- 38.Assessments of Health Outcomes Among Individuals Exposed to Medical Products | Mini-Sentinel [Internet]. [cited 2016 Aug 24]. Available from: http://mini-sentinel.org/assessments/medical_events/default.aspx
- 39.Fleurence RL, Curtis LH, Califf RM, Platt R, Selby JV, Brown JS. Launching PCORnet, a national patient-centered clinical research network. J Am Med Inform Assoc JAMIA. 2014. August;21(4):578–82. [DOI] [PMC free article] [PubMed] [Google Scholar]