

Abstract
Glioblastoma (GBM) is the most common and deadly malignant brain cancer of glial cell origin, with a median patient survival of less than 20 months. Transcription factors FOXG1 and TLE1 promote GBM propagation by supporting maintenance of brain tumour‐initiating cells (BTICs) with stem‐like properties. Here, we characterize FOXG1 and TLE1 target genes in GBM patient‐derived BTICs using ChIP‐Seq and RNA‐Seq approaches. These studies identify 150 direct FOXG1 targets, several of which are also TLE1 targets, involved in cell proliferation, differentiation, survival, chemotaxis and angiogenesis. Negative regulators of NOTCH signalling, including CHAC1, are among the transcriptional repression targets of FOXG1:TLE1 complexes, suggesting a crosstalk between FOXG1:TLE1 and NOTCH‐mediated pathways in GBM. These results provide previously unavailable insight into the transcriptional programs underlying the tumour‐promoting functions of FOXG1:TLE1 in GBM.
Keywords: CHAC1, ChIP‐Seq/RNA‐Seq, FOXG1, glioblastoma, Groucho/transducin‐like Enhancer of split, NOTCH
Abbreviations
- BTIC
brain tumour‐initiating cell
- ChIP
chromatin immunoprecipitation
- DMEM
Dulbecco's modified Eagle's medium
- ENCODE
Encyclopedia of DNA Elements
- FOXG1
Forkhead Box G1
- GBM
glioblastoma
- GRG
Groucho‐related gene
- IgG
immunoglobulin G
- PBS
phosphate‐buffered saline
- PWM
positional weight matrix
- TLE1
transducin‐like Enhancer of split 1
- TMZ
Temozolomide
1. Introduction
Glioblastoma (GBM) is the most common and deadly of all brain tumours of glial cell origin (gliomas), with a median survival of less than 20 months (Aldape et al., 2015; Louis et al., 2007). GBM tumourigenic potential has been partly attributed to the presence of a subpopulation of cells with stem cell‐like properties, termed GBM stem‐like cells or brain tumour‐initiating cells (BTICs) (Dirks, 2006; Lathia et al., 2015; Singh et al., 2004; Vescovi et al., 2006; Yan et al., 2013). BTICs fuel tumour growth and initiate tumours after chemotherapy (Chen et al., 2012). Elucidating BTIC pathobiology is therefore of the utmost importance for the understanding of gliomagenesis.
We have previously shown that the transcription factor forkhead box protein G1 (FOXG1) contributes to the brain tumour‐initiating ability of GBM patient‐derived BTICs. FOXG1 promotes BTIC self‐renewal potential, inhibits BTIC cell cycle exit and replicative senescence and impedes BTIC progression towards more developmentally mature neural phenotypes (Verginelli et al., 2013). FOXG1 also plays similar oncogenic roles in BTICs derived from medulloblastoma, a fast‐growing, high‐grade paediatric brain cancer (Manoranjan et al., 2013).
In agreement with these findings, recent work profiling the expression of several forkhead proteins, including FOXG1, as a function of glioma patient survival concluded that forkhead proteins are attractive biomarkers of GBM and warrant further investigation of their roles in gliomagenesis (Robertson et al., 2015). Moreover, FOXG1 has been implicated downstream of EGF receptor signalling, one of the most common oncogenic drivers in GBM (Liu et al., 2015), further suggesting that FOXG1 is an important effector of GBM tumourigenesis.
In the healthy brain, FOXG1 represses gene expression, at least in part, by forming transcription complexes with Groucho/transducin‐like Enhancer of split (TLE) proteins (Marcal et al., 2005; Roth et al., 2010; Yao et al., 2001). TLE family members are general transcriptional corepressors involved in controlling a variety of cellular processes, including the regulation of cell proliferation and differentiation (Buscarlet and Stifani, 2007; Turki‐Judeh and Courey, 2012; Yuan et al., 2017). There are four full‐length TLE family members in mammals, named TLE1‐4, and two shorter isoforms, commonly referred to as Groucho‐related gene product (GRG) 5 and 6. Only full‐length TLE and GRG6 proteins contain a conserved C‐terminal WD40 repeat domain mediating interaction with FOXG1. Full‐length TLE proteins provide a transcriptional corepressor function to FOXG1. In contrast, GRG6 is not endowed with corepressor activity and acts as a dominant‐negative regulator of FOXG1:TLE transcriptional repressor complexes (Marcal et al., 2005).
Consistent with the above observations, we have previously shown that FOXG1 physically and functionally interacts with TLE proteins in GBM patient‐derived BTICs, and that TLE knockdown, as well as overexpression of the TLE antagonist GRG6, mimics the effects of FOXG1 attenuation in these cells (Verginelli et al., 2013). These findings identify FOXG1:TLE transcriptional complexes as GBM drivers and suggest that the characterization of their transcriptional programs in GBM may contribute to elucidating mechanisms of gliomagenesis and identifying potential targets of therapies for GBM.
FOXG1 and TLE are important for neural stem cell biology and neuronal survival in the healthy brain (Buscarlet and Stifani, 2007; Dastidar et al., 2011, 2012; Fasano et al., 2009). Thus, they are unlikely drug targets in the fight against GBM. This situation underscores the importance of characterizing the downstream transcriptional targets of FOXG1:TLE complexes as more suitable potential targets for GBM treatment. Here, we sought to identify transcriptional targets of FOXG1 and TLE1 in BTICs using a combination of high‐throughput chromatin immunoprecipitation followed by sequencing (ChIP‐Seq) and RNA sequencing (RNA‐Seq) approaches. The results of these studies provide the first comprehensive genomewide map of FOXG1 and TLE1 targets in GBM cells and identify the gene cation transport regulator‐like protein 1 (CHAC1), a negative regulator of NOTCH signalling and a mediator of apoptosis, as a FOXG1:TLE1 target in GBM.
2. Materials and methods
2.1. Brain tumour‐initiating cell culture
Two previously characterized GBM patient‐derived BTIC lines, BT048 and BT025 (Cusulin et al., 2015; Kelly et al., 2009; Verginelli et al., 2013), were used. These cells were obtained from Samuel Weiss at the Hotchkiss Brain Institute at the University of Calgary, in Calgary, Alberta, Canada. BTICs were maintained under previously described culture conditions (Verginelli et al., 2013).
2.2. Lentiviral transduction of brain tumour‐initiating cells
For knockdown studies, bicistronic lentiviral particles expressing either a control, nonsilencing (‘scrambled’) shRNA reagent (catalog No. RHS‐4348) or previously validated (Verginelli et al., 2013) shRNA sequences targeting human FOXG1 (sense sequence #1: 5′‐ATGGGACCAGACTGTAAGTGAA; Clone ID V3LHS_40 7592; sense sequence #2: 5′‐CCAGCTCCGTGTTGACTCAGAA; Clone ID V3LHS_353952) or TLE1 (sense sequence #1: 5′‐AGCAGTCTCCACTTGGCAATAA; Clone ID V2LHS_18400) were obtained from Open Biosystems (Lafayette, CO). Additional FOXG1 shRNA sequences were as follows: sense sequence #3: 5′‐CCGTGTTTGTCACTTACAA; Clone ID V3LHS_407593; and sense sequence #4: GAGAATACATTGTAGAATA; Clone ID V2LHS_43017. Low passage number BTICs were transduced at a multiplicity of infection of 5 and were analysed 5 days post‐transduction. Knockdown efficiency was evaluated by western blotting analysis of FOXG1 or TLE1 protein expression as described (Verginelli et al., 2013).
2.3. ChIP‐Seq
Cultured BTIC spheres were dissociated in Accumax (Innovative Cell Technologies, San Diego, CA, USA; catalog No. AM1) and washed with PBS. Aliquots of 3.3 × 10⁷ cells were suspended in 1% formaldehyde in 10 mL of Dulbecco's modified Eagle's medium for 10 min, followed by incubation in 1 mL of 125 mm glycine for 5 min. Each aliquot was washed twice with PBS and stored at −80 °C until use. ChIP was carried out using the Magna ChIPT/M A/G kit (Millipore Canada, Etobicoke, ON, Canada; catalog No. 17‐10085) according to the manufacturers’ instructions. Each aliquot was sonicated to about 100–500 bp in size using a Diagenode Bioruptor UCD‐300 water bath sonicator using the following settings: 10 s ON followed by 20 s OFF for six sets of 15 cycles each on HIGH. Sonicated DNA was reverse cross‐linked and RNAse treated, then fractionated on agarose gel to confirm DNA size distribution. Antibodies used were rabbit anti‐FOXG1 (Abcam Inc., Toronto, ON, Canada; catalog No. ab18259) at 3 μL per cell aliquot, and rabbit anti‐TLE1 antibody (Nuthall et al., 2004; Verginelli et al., 2013; Yao et al., 2001) at 3 μL per cell aliquot. Rabbit immunoglobulin G (IgG) (Cell Signalling Technology, Danvers, MA, USA; catalog No. 2729) was used as negative control. ChIP products were collected in water and quantified. PCR was used to evaluate ChIP outcome before library preparation using CDKN1A/p21 Cip1 promoter primers as positive control (Verginelli et al., 2013). Libraries were created from successful large‐scaled ChIP experiments using Illumina's TruSeq Library Prep Kit following instructions in the user manual (Illumina, San Diego, CA, USA). Library size selection was carried out using the PippinPrep kit (Sage Science, Beverly, MA, USA) to select DNA fragments between 200 and 400 bp. Successful libraries were submitted for sequencing on the Illumina HiSeq2000 at 50‐bp single‐read sequencing. ChIP‐Seq experiments were run in two replicates.
2.4. ChIP‐Seq bioinformatics analysis
ChIP‐Seq reads were quality controlled and trimmed for adapter sequences using Trim Galore (Babraham Bioinformatics, Cambridge, UK). Filtered reads were aligned to hg38 using Bowtie2 (Langmead and Salzberg, 2012). Peaks were called using MACS14 (Zhang et al., 2008) using both IgG or input DNA as control. Putative positional weight matrices were identified using the ‘findMotifsGenome’ module form HOMER (Heinz et al., 2010). Peaks were annotated using the ‘BSgenome.Hsapiens.UCSC.hg38’ library from R/Bioconductor. The genomewide peak distribution was assessed using the ‘ChIPpeakAnno’ library (Zhu et al., 2010) from R/Bioconductor. ENCODE human transcription factor binding sites (Dunham et al., 2012) were downloaded from the UCSC Genome Browser (http://hgdownload.cse.ucsc.edu/goldenPath/hg19/encodeDCC/wgEncodeRegTfbsClustered/wgEncodeRegTfbsClusteredV3.bed) and intersected with FOXG1 or TLE1 peaks using ‘GenomicRanges’ package (Lawrence et al., 2013) in R/Bioconductor at a maximum distance of 500 bps.
2.5. RNA‐Seq
FOXG1 or TLE1 were silenced in BTICs (1.5 × 10⁶ cells) using previously validated (Verginelli et al., 2013) shRNA reagents (sense sequence #1 for either FOXG1 or TLE1; both sequences as defined in section 2.5 above) delivered by lentiviral transduction. Cells were cultured for 5 days after transduction then harvested for protein and RNA isolation. Total RNA was extracted using TRIzol Reagent (Invitrogen, Carlsbad, CA, USA; catalog No. 15596‐026) and sent to the McGill University and Genome Quebec Innovation Centre for quality control, polyA+ selection, library preparation and sequencing on Illumina HiSeq2000 at 100 bp pair‐ended. Two replicates of the RNA‐Seq experiments were performed.
2.6. RNA‐Seq bioinformatics analysis
RNA‐Seq reads were quality controlled and trimmed for adapter sequences using Trim Galore (Babraham Bioinformatics). Filtered reads were aligned to hg38 using TopHat (Trapnell et al., 2012). Read counts for each gene were carried out using HT‐Seq (Anders et al., 2015) using the hg38 refSeq refFlat GTF file accessed on July 2015. Batch effects in the two replicates of the RNA‐Seq experiments were corrected using ComBat from Bioconductor. Differentially expressed genes were analysed using the DESeq package (Anders and Huber, 2010) at an adjusted P‐value cut‐off of 0.1. Gene ontology analysis was carried out based on the PANTHER classification system (Mi et al., 2013, 2016).
2.7. Polymerase chain reaction
PCR primers were ordered from Integrated DNA Technologies (Coralville, IA, USA) and suspended in water to a final concentration of 10 μm. Primers were designed to have a melting temperature near 54–56 °C. ChIP DNA products (1 μL) were diluted to a final volume of 30 μL for each PCR mixture. PCR program was 2 min at 94 °C, then 30 cycles of 94 °C for 30 seconds, primer pair melting temperature for 30 s then 72 °C for 30 s, followed by a final extension phase at 72 °C for 5 min. PCR products were run on 1% agarose gel containing ethidium bromide. The sequences of the oligonucleotides used in PCR experiments are listed in Table S1.
2.8. RT‐qPCR
Total RNA was isolated from BTICs using TRIzol reagent and reverse transcribed using Bio‐Rad iScript™ Reverse Transcription Supermix for RT‐qPCR (Bio‐Rad, Mississauga, ON, Canada; catalog No. 170‐8840). qPCR was performed using the Bio‐Rad CFX96 Touch™ Real‐Time PCR Detection System using SsoFast™ EvaGreen Supermix (catalog No. 172‐5201). Expression values were expressed as fold change of FOXG1 or TLE1 in silencing shRNA‐transduced cells over nonsilencing shRNA‐transduced cells using β‐ACTIN as a control by the Comparative CT Method of analysis (means of three technical replicates). The sequences of the oligonucleotides used in qPCR experiments are listed in Table S1.
3. Results
3.1. FOXG1 and TLE1 genomic binding sites in brain tumour‐initiating cells
To identify FOXG1 and TLE1 gene targets in BTICs, large‐scale ChIP experiments for FOXG1 and TLE1 proteins were conducted using the previously characterized BTIC line BT048 (Cusulin et al., 2015; Kelly et al., 2009). Rabbit IgG was used as a negative control for nonspecific pull‐down products, and input DNA not subjected to ChIP was assessed to control for unequal coverage across the genome. A total of 2890 FOXG1 peaks and 1478 TLE1 peaks were identified using input or IgG as control: of these, 268 peaks were shared (Fig. 1A). To validate the specificity of the FOXG1 ChIP‐Seq experiments, abundant positional weight matrices (PWM) were assessed using HOMER (Heinz et al., 2010). Although the PWM of FOXG1 itself is not included in most databases, several binding motifs containing the Forkhead core binding motif were identifiable, including the PWM of FOXA1, FOXP1 and FOXH1. The position of FOXG1 and TLE1 peaks relative to gene annotations was evaluated (Fig. 1B). Over 60% of the FOXG1 peaks and 75% of the TLE1 peaks were located in distal intergenic regions, suggesting long‐range transcriptional function or genomic functions that extend beyond transcriptional regulation. About 20% of peaks for both proteins were close to genes.
Figure 1.
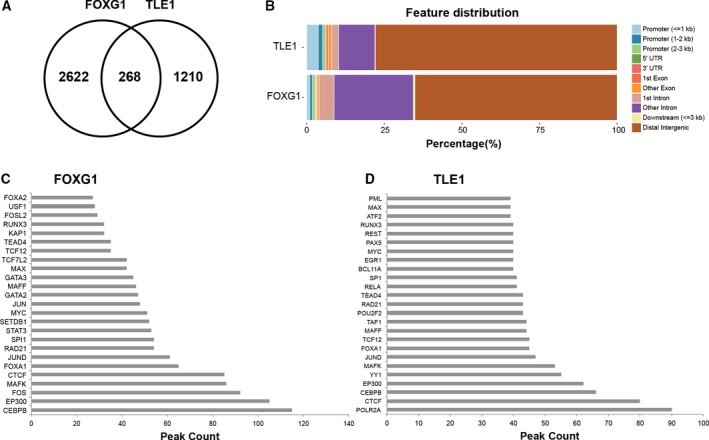
Analysis of FOXG1 and TLE1 ChIP‐Seq experiments. (A) Common FOXG1 and TLE1 ChIP‐Seq peaks. FOXG1 and TLE1 share 268 common regions with a minimum overlap of at least 1 bp. (B) Genomewide distribution of peaks from FOXG1 ChIP‐Seq (bottom bar plot) and TLE1 ChIP‐Seq (top bar plot). (C) Peak count of ENCODE transcription factor ChIP‐Seq peaks overlapping with FOXG1 peaks within a maximum gap of 500 bp. (D) Peak count of ENCODE transcription factor ChIP‐Seq peaks overlapping with TLE1 peaks within a maximum gap of 500 bp.
To identify putative transcriptional partners, FOXG1 (Fig. 1C) or TLE1 (Fig. 1D) peak coordinates were intersected with genomewide ENCODE‐identified transcription factor peaks: the number of common peaks between the top 25 transcription factors, whose co‐occurrence with FOXG1 or TLE1 is higher than what would be expected by chance, was reported allowing a maximum gap of 500 bp. The top transcription factors overlapping with FOXG1 peaks were CEBPB, CTCF and FOXA1, among others. Amid the top transcription factors overlapping with TLE1 peaks were transcription factors that overlapped FOXG1 peaks, including CEBPB, CTCF, JUND and FOXA1. Known TLE transcriptional partners like TCF12 and RUNX (Buscarlet and Stifani, 2007) were also identified. These findings suggest potential transcriptional interactions involving FOXG1 and TLE1 with other factors previously implicated in GBM, including CEBPB, CTCF and JUND (Ayala‐Ortega et al., 2016; Rong et al., 2009; Talasila et al., 2017).
3.2. FOXG1 binds FOXA1 sites
FOXG1 and FOXA1 are members of the same family of transcription factors and share a common DNA‐binding domain known as the forkhead domain. Multiple sequence alignment of both proteins shows a large degree of conservation, especially within the DNA‐binding forkhead domain (Fig. S1A). The PWM bound by FOXG1 shows similarity to the FOXA1 PWM (Fig. S1B), suggesting that FOXG1 and FOXA1 may bind similar genomic regions; in agreement with this, our ChIP‐Seq analysis showed that FOXG1 binds several ENCODE‐identified FOXA1 sites (Fig. 1C). To test this hypothesis further, FOXA1 ENCODE‐identified peaks were tested for FOXG1 binding. ChIP was conducted in triplicates in two characterized BTIC lines, BT048 and BT025. Most tested FOXA1 sites bound FOXG1 in BTICs: two of these sites, ANAPC10 and CDKN1B/p27 Kip1, are shown in Fig. S1C.
3.3. Identification of FOXG1‐ and TLE‐regulated genes with RNA‐Seq
Next we sought to identify genes whose expression is regulated by FOXG1 and TLE1. BT048 cells were transduced with lentivirus encoding previously validated shRNA sequences targeting FOXG1 or TLE1, or nonsilencing shRNA control (Verginelli et al., 2013). After confirming FOXG1 or TLE1 protein attenuation (Fig. 2A), RNA was collected and sequenced. The RNA‐Seq analysis exhibited a batch effect (Fig. 2B left panel), which was corrected using Combat in Bioconductor (Leek et al., 2016) (Fig. 2B right panel). Expression analysis identified 216 genes that were differentially regulated following FOXG1 knockdown (Fig. 2C) and 990 genes following TLE1 knockdown (Fig. 2D), with 155 genes in common (Fig. 2E; Table S2). More genes were upregulated than downregulated following FOXG1 or TLE1 knockdown (Fig. 2C, D), consistent with the previously characterized transcriptional repressor function of these proteins. Gene ontology of modulated genes following FOXG1 knockdown, analysed using the PANTHER classification system (Mi et al., 2013, 2016), showed several predicted categories, like ‘nervous system development’, ‘cell proliferation’ and ‘cell differentiation’ (Fig. 2F; Table S3). Other categories, such as ‘chemotaxis’ and ‘angiogenesis’, were unanticipated. Gene ontology categories following TLE1 knockdown (Fig. 2G) showed common categories with FOXG1, but also included other groups suggesting a role for TLE1 in chromatin structure, which has been previously proposed (Sekiya and Zaret, 2007).
Figure 2.
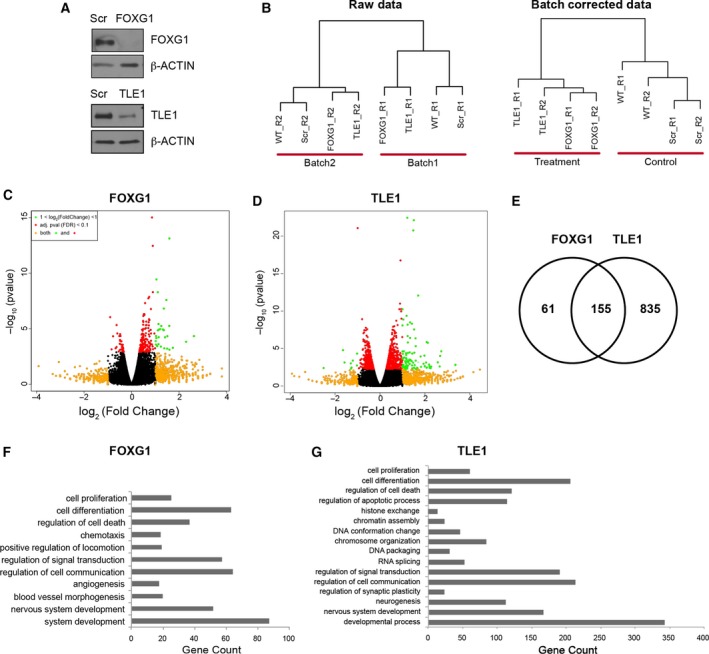
Analysis of RNA‐Seq data following FOXG1 and TLE1 knockdown. (A) Western blotting analysis of FOXG1 and TLE1 protein levels following lentivirus‐mediated delivery of specific shRNA reagents in BTIC line BT048. Scr = scrambled, nonsilencing shRNA control; FOXG1 = shRNA targeting FOXG1; TLE1 = shRNA targeting TLE1. Expression of β‐ACTIN is shown as loading control. (B) Hierarchical clustering of samples before and after batch correction. WT = wild‐type, nontransduced, BT048 cells; Scr = BT048 cells expressing scrambled control shRNA; FOXG1 = BT048 cells expressing shRNA targeting FOXG1; TLE1 = BT048 cells expressing shRNA targeting TLE1. R1 = replicate #1; R2 = replicate #2. (C) Volcano plot of differentially expressed genes after FOXG1 knockdown. Genes with an adjusted P‐value [false discovery rate (FDR)] greater than 0.1 are coloured in orange. Genes with log2 (fold change) greater than 1 are coloured in red. Genes with adjusted P‐value greater than 0.1 and log2 (fold change) greater than 1 are coloured in green. (D) Volcano plot of differentially expressed genes after TLE1 knockdown. (E) Genes differentially expressed following FOXG1 or TLE1 knockdown at an adjusted P‐value of 0.1. (F) Selected significant gene ontology categories of differentially regulated genes following FOXG1 knockdown. (G) Selected significant gene ontology categories of differentially regulated genes following TLE1 knockdown.
3.4. Integrative analysis of ChIP‐Seq and RNA‐Seq
To identify FOXG1 direct target genes, we integrated the results of ChIP‐Seq and RNA‐Seq analyses. ChIP‐Seq results contain both functional transcription factor occupancy that leads to transcriptional modulation and nonfunctional occupancy where the transcription factor binds DNA but does not affect nearby genes. RNA‐Seq results contain direct gene targets regulated by the transcription factor of interest but also include second‐order targets that might be modulated by the transcription factor's first‐order targets. Combining ChIP‐Seq and RNA‐Seq results provides a better understanding of the direct targets of a given transcription factor (Fig. 3A). This analysis identified 925 genes that are within 5 kb from a FOXG1 or FOXA1 ENCODE peak, of which 150 had differential gene expression upon FOXG1 knockdown, consistent with the notion that they correspond to direct FOXG1 targets (Fig. 3B, Table S4). In agreement with the role of FOXG1 as a transcriptional repressor, 89% of the 150 identified genes showed increased expression following FOXG1 knockdown. Of note, two of the genes upregulated following knockdown of FOXG1 in BTICs, DMRTA1 and EGR2 (Table S4), had been identified previously as high‐probability transcriptional repression targets of mouse Foxg1 in the developing brain (Kumamoto et al., 2013). Importantly, 106 of these direct FOXG1 targets were also identified as genes whose expression is modulated following TLE1 knockdown (Table S5; see also Table S2).
Figure 3.
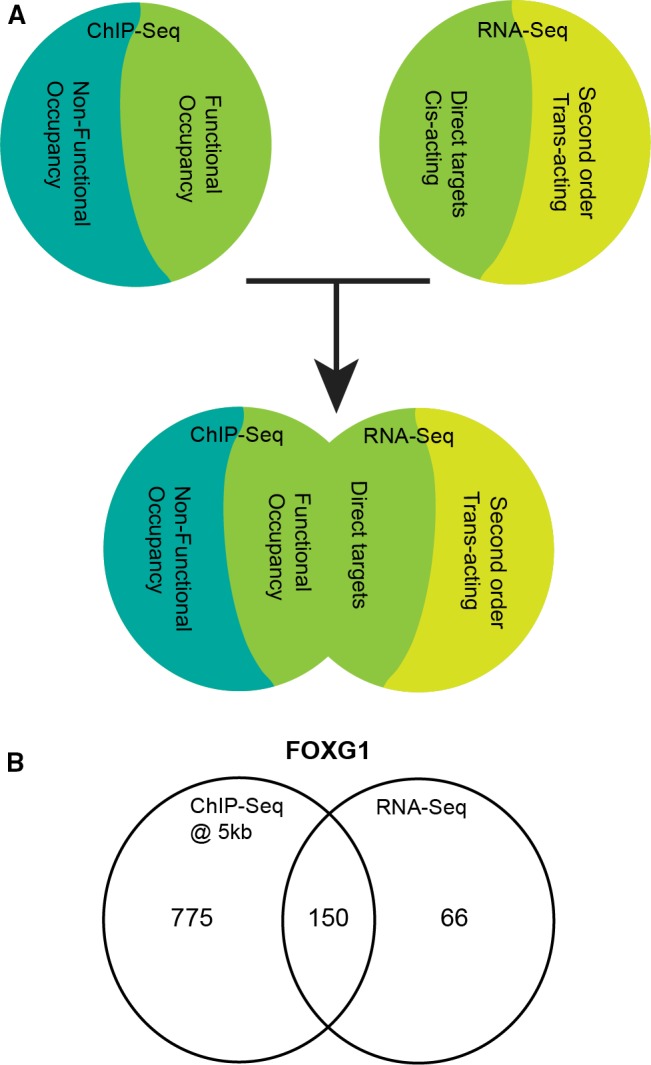
Integration of ChIP‐Seq and RNA‐Seq data. (A) Schematic representation of the integrative analysis of ChIP‐Seq and RNA‐Seq experiments. (B) Gene counts resulting from the integrative analysis of FOXG1 ChIP‐Seq and RNA‐Seq approaches.
To extend the analysis of FOXG1‐regulated genes, we selected two different categories of candidate FOXG1 transcriptional targets for direct ChIP and RT‐qPCR analysis. These candidates included examples of both genes identified by combined RNA‐Seq and ChIP‐Seq data and genes with upregulated expression following FOXG1 knockdown but located at > 5 kb from nearby ChIP peaks (Fig. 4). Most of these selected candidates had been previously implicated in mechanisms relevant to gliomagenesis, such as regulation of cell proliferation and survival, inhibition of neural cell differentiation and participation in signalling pathways implicated in cancer development. Direct ChIP assays demonstrated that many of the selected sites were occupied by both FOXG1 and TLE1 in both BTIC lines BT048 and BT025 (Fig. 4, left panel). Moreover, most of these target genes displayed increased expression upon FOXG1 knockdown using RT‐qPCR (Fig. 4, right panel). Together, these results identify a number of transcriptional targets of FOXG1:TLE1 complexes in BTICs, providing previously unavailable information on the transcriptional programs regulated by these proteins during gliomagenesis.
Figure 4.
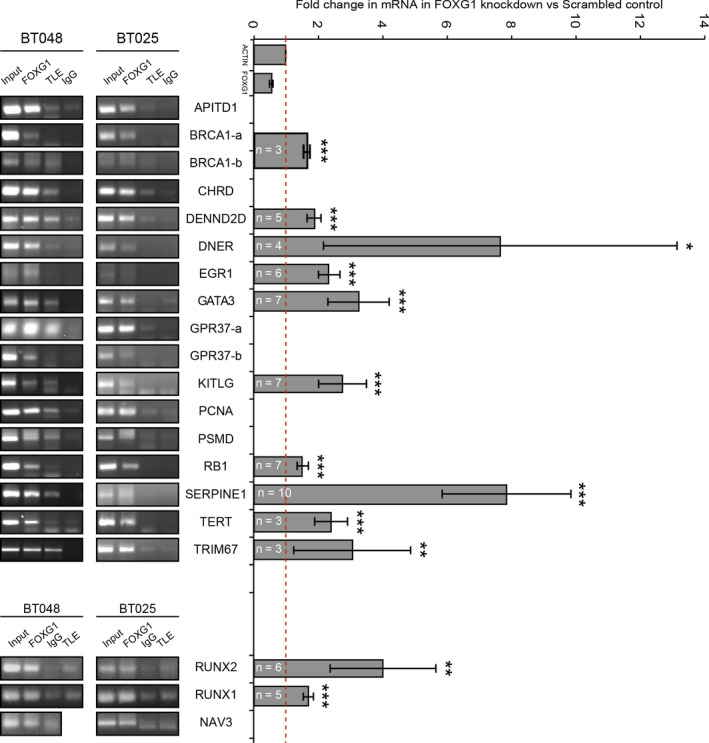
Validation of selected FOXG1 targets by direct ChIP and RT‐qPCR. ChIP analysis of selected FOXG1 or TLE1 binding sites in BT048 and BT025 cells using anti‐FOXG1, anti‐TLE1 or control (IgG) antibodies, as indicated, followed by PCR with primers specific for each region (left panel). Right panel depicts fold changes in gene expression following lentiviral‐mediated FOXG1 knockdown compared to nonsilencing shRNA control in BT048 cells assayed using RT‐qPCR (*P < 0.05; **P < 0.01; ***P < 0.001).
3.5. CHAC1 is a FOXG1 and TLE1 target in brain tumour initiating cells
The gene CHAC1 exhibited the most robust upregulation following both FOXG1 and TLE1 knockdown (Table S2). Moreover, a FOXG1 ChIP peak was identified approximately 8 kb from the CHAC1 gene (not shown), suggesting that CHAC1 is a FOXG1 target. Previous studies showed that CHAC1 protein expression is upregulated in glioma cells in response to treatment with Temozolomide (TMZ), the most common antiglioma chemotherapeutic agent, and that CHAC1 overexpression enhances glioma apoptotic death (Chen et al., 2017). CHAC1 acts as a pro‐apoptotic factor involved in apoptosis initiation and execution through the depletion of glutathione (Kumar et al., 2012; Mungrue et al., 2009). Moreover, TMZ‐induced upregulation of CHAC1 expression in glioma cells results in the binding of CHAC1 to the NOTCH3 protein and consequent inhibition of NOTCH3 activation, resulting in attenuation of NOTCH3‐mediated pathways (Chen et al., 2017). NOTCH activation has oncogenic roles in GBM (Lino et al., 2010; Sarkar et al., 2017; Takebe et al., 2014). Together, these observations suggest that mechanisms that negatively regulate CHAC1 expression are involved in gliomagenesis.
We observed that both CHAC1 mRNA and CHAC1 protein levels are lower in GBM compared to control samples from noncancerous brain tissues (Fig. 5A,B). More importantly, mRNA expression of CHAC1 and FOXG1 in selected samples from the MediSapiens database (Kilpinen et al., 2008) and The Cancer Genome Atlas showed an inverse correlation of FOXG1 (high) and CHAC1 (low) levels in GBM; in contrast, the opposite situation was observed in mesenchymal stem cells (Fig. 5C; Fig. S2). While both genes are tissue specific and are not expressed in most samples, tissues that do express these genes seem to preferentially express one or the other resulting in very few samples with high expression of both. Together, these results suggest that FOXG1 may repress CHAC1 expression in GBM together with TLE1.
Figure 5.
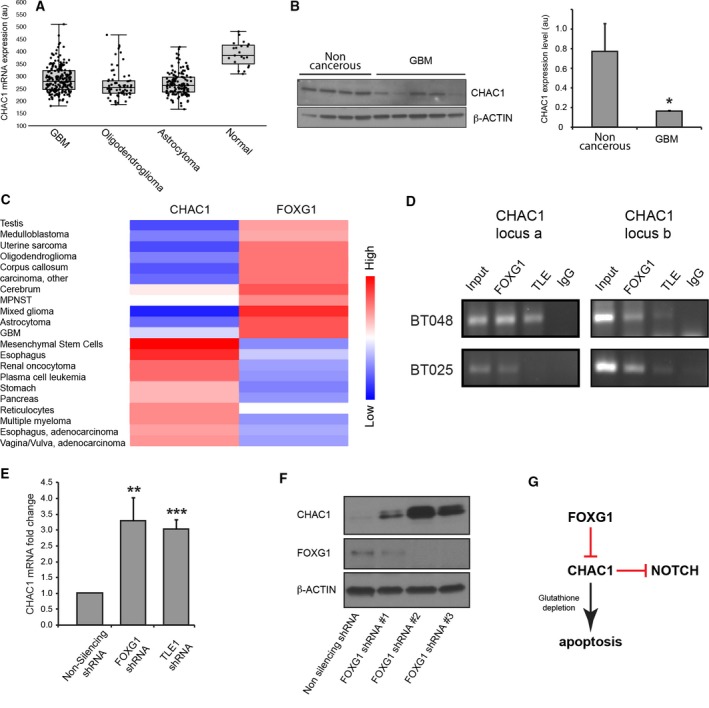
CHAC1 is a FOXG1 target in BTICs. (A) CHAC1 mRNA expression in normal brain and high‐ or low‐grade gliomas based on microarray data from Rembrandt database through the Betastasis portal. (B) Western blotting analysis showing the expression of CHAC1 protein in four noncancerous brain samples and five GBM samples (left panel). Average intensity of CHAC1 protein bands in noncancerous brain and GBM after normalization by β‐ACTIN expression (right panel, au = arbitrary units) (*P < 0.05). (C) Heatmap of mRNA expression of CHAC1 and FOXG1 in various normal and cancer samples. (D) ChIP analysis of FOXG1 and TLE1 binding to the CHAC1 promoter at two different binding sites, operationally termed a and b. (E) Bar plot showing increase in CHAC1 mRNA level following FOXG1 or TLE1 knockdown (n = 3; **P < 0.01; ***P < 0.001). (F) Western blotting analysis showing CHAC1 protein upregulation following FOXG1 knockdown using three different shRNA reagents. (G) Schematic model depicting a direct role for FOXG1 in the transcriptional repression of CHAC1, which is proposed to act both as pro‐apoptotic factor and inhibitor of NOTCH signalling in GBM cells.
To examine this possibility further, we performed direct ChIP and RT‐qPCR experiments. Studies using two different BTIC lines showed that both FOXG1 and TLE1 are localized to the CHAC1 promoter at two different genomic loci (Fig. 5D) (these loci are operationally termed ‘a’, located at chr15:41 237 139–41 237 414, and ‘b’, located at chr15:41 230 193–41 230 469 – Fig. S3). Control ChIP experiments using primers designed for negative control regions within the CHAC1 locus revealed only negligible binding (Fig. S3). Consistent with these results, CHAC1 mRNA increased in response to FOXG1 or TLE1 knockdown (Fig. 5E). CHAC1 protein was also upregulated following FOXG1 knockdown, as shown using three different FOXG1‐targeting shRNA sequences (Fig. 5F). Together, these results provide evidence suggesting that CHAC1 is a direct FOXG1:TLE1 transcription repression target in GBM. Furthermore, they suggest that FOXG1:TLE1 may promote gliomagenesis, at least in part, through inhibition of the pro‐apoptotic and/or NOTCH inhibitory functions of CHAC1 (Fig. 5G).
4. Discussion
We utilized GBM patient‐derived cell cultures with in vitro stem‐like properties and in vivo tumour‐initiating ability to characterize FOXG1 and TLE1 genomewide occupancy patterns and identify their direct target genes. Combined ChIP‐seq and RNA‐seq studies, with the latter performed in BTICs with endogenous vs attenuated levels of FOXG1:TLE1, identified a subset of 150 genes as direct targets of FOXG1‐containing transcription repression complexes in GBM cells. Most of these direct FOXG1 targets showed increased expression following FOXG1 or TLE1 knockdown, in agreement with the demonstration that FOXG1 mediates transcriptional repression together with TLE proteins. Numerous FOXG1 peaks were not shared with TLE1, possibly because the efficiency of TLE1 immunoprecipitation was inferior to that of FOXG1 in ChIP experiments. This situation may also result in part from the broad participation of TLE1 in gene regulatory mechanisms with a variety of other transcription factors that recruit TLE proteins to DNA, thereby targeting TLE1 to many DNA sites not occupied by FOXG1.
As predicted based on previous studies showing promotion of GBM propagation by FOXG1:TLE1 (Verginelli et al., 2013), the identified target genes include several tumour suppressor, such as APITD1, BRCA1 and GADD45A (Asuthkar et al., 2011; Krona et al., 2004; Silver and Livingston, 2012). We also identified as targets of FOXG1:TLE1 transcriptional repression a number of genes previously proposed to promote glioma invasion, including EGR1, EGR2, GDF15, SERPINE1 and SRPX2 (Codó et al., 2016; Han et al., 2014; Tang et al., 2016; Yukinaga et al., 2014). This finding, combined with the previous demonstration that FOXG1 promotes cancer stem‐like cell maintenance in GBM (Verginelli et al., 2013), raises the possibility that FOXG1:TLE1‐mediated transcription repression mechanisms may act to prevent transition of GBM stem‐like cells towards a more differentiated, ‘glioblast‐like’, state associated with enhanced migratory behaviour. This possibility is consistent with the involvement of FOXG1 and TLE1 in repressing the expression of genes associated with a more developmentally advanced astroglial phenotype, such as GFAP, S100β and GLUL (glutamine synthetase) (Verginelli et al., 2013).
Further insight into the mechanisms underlying the functions of FOXG1 and TLE1 complexes in GBM is provided by the present identification of CHAC1 as a direct FOXG1:TLE1 target gene. CHAC1 expression is lower in GBM compared to control noncancerous brain (this study and Chen et al., 2017). Treatment of glioma cells with TMZ causes upregulation of CHAC1 expression, which is in turn correlated with enhanced apoptotic cell death via caspase 3/9 activation (Chen et al., 2017). This response is consistent with the previously demonstrated role of CHAC1 as a pro‐apoptotic factor (Kumar et al., 2012; Mungrue et al., 2009). When considered together with the previously shown prosurvival function of FOXG1 and TLE1 in healthy neurons (Dastidar et al., 2011, 2012), these observations suggest that FOXG1:TLE1 may promote glioma cell survival, at least in part, through inhibition of the pro‐apoptotic function of CHAC1 (Fig. 5G).
Another effect of TMZ‐induced upregulation of CHAC1 expression in glioma cells is the binding of CHAC1 to the NOTCH3 protein and consequent inhibition of NOTCH3 activation, resulting in attenuation of NOTCH3‐mediated pathways (Chen et al., 2017). NOTCH signalling has well‐recognized tumour‐promoting functions in GBM (Lino et al., 2010; Sarkar et al., 2017; Takebe et al., 2014). The ability of CHAC1 to inhibit NOTCH signalling was first recognized during murine cortical neurogenesis (Chi et al., 2012), when CHAC1 (referred to as Botch in that study) prevents maturation, and proper cell surface presentation, of NOTCH receptors by inhibiting the S1 furin‐like cleavage of the full‐length form of NOTCH. Based on these observations, it is reasonable to propose that FOXG1:TLE1 complexes cooperate with NOTCH signalling to promote gliomagenesis by directly repressing CHAC1 expression in GBM cells (Fig. 5G).
The possibility that transcriptional programs controlled by FOXG1:TLE1 complexes may act to repress genes that negatively regulate NOTCH signalling in GBM, thereby contributing to maintenance of activated NOTCH pathways, is also consistent with the present identification of GATA3 as another FOXG1:TLE1 transcription repression target in GBM. GATA3 was shown to induce human T‐cell lineage commitment in part by restraining NOTCH activity (Van de Walle et al., 2016). It is worth mentioning that our studies have identified Delta and Notch‐like epidermal growth factor‐related receptor (DNER) as an additional potential transcription repression target of FOXG1:TLE1. DNER inhibits GBM‐derived tumoursphere growth and promotes their differentiation in vivo and in vitro, opposite to the effect of FOXG1 and TLE1. Accordingly, DNER reduces the growth of brain tumour stem‐like cell‐initiated xenografts in host brains (Sun et al., 2009). DNER was proposed to act as an inhibitor of NOTCH signalling, although this possibility remains controversial (Eiraku et al., 2005; Greene et al., 2016). Together, these observations suggest that FOXG1 and NOTCH signalling pathways may functionally interact at various levels to promote gliomagenesis.
In conclusion, the identification of FOXG1:TLE1 target genes in GBM has provided evidence suggesting that this transcription repression complex promotes the tumourigenic potential of BTICs through a number of mechanisms impacting on several oncogenic pathways and has identified potentially attractive targets for antiglioma therapies.
Author contributions
RD carried out experiments and helped draft the manuscript. FV carried out experiments. AP and RS participated in the design of high‐throughput genomic studies and provided reagents. SS participated in the design and coordination of the study and helped draft the manuscript. All authors read and approved the final manuscript.
Supporting information
Fig. S1. FOXG1 binds FOXA1 DNA‐binding sites.
Fig. S2. CHAC1 gene expression as function of FOXG1 expression in GBM patients.
Fig. S3. FOXG1 binding sites upstream of CHAC1 gene.
Table S1. PCR and qPCR primers.
Table S2. Common genes differentially regulated in brain tumor‐initiating cells following FOXG1 or TLE1 knockdown.
Table S3. Gene ontology statistics.
Table S4. FOXG1‐regulated genes in brain tumor‐initiating cells.
Table S5. Common genes that are differentially regulated in brain tumor‐initiating cells following FOXG1 or TLE1 knockdown and have proximal FOXG1 binding sites.
Acknowledgements
The authors wish to thank Dr. S. Weiss for providing BTIC lines and Ms. Rita Lo for excellent technical assistance. They also acknowledge the contribution of scientists at the McGill University and Génome Québec Innovation Centre, Montréal, QC, Canada, for high‐throughput sequencing. RD was supported by Studentships from the Banting and Best CGS Master's Award, Fonds de la Recherche en Sante du Quebec and Vanier Canada CGS. SS is a James McGill Professor of McGill University. RS is the recipient of a Chercheur Boursier award from the Fonds de la Recherche en Santé du Québec and a New Investigator Award from the Canadian Institutes of Health Research. This work was supported by Operating Grants to SS from the Canadian Institutes of Health Research (MOP‐13957 and IC1‐115711).
References
- Aldape K, Zadeh G, Mansouri S, Reifenberger G and von Deimling A (2015) Glioblastoma: pathology, molecular mechanisms and markers. Acta Neuropathol 129, 829–848. [DOI] [PubMed] [Google Scholar]
- Anders S and Huber W (2010) Differential expression analysis for sequence count data. Genome Biol 11, R106. [DOI] [PMC free article] [PubMed] [Google Scholar]
- Anders S, Pyl PT and Huber W (2015) HTSeq — A Python framework to work with high‐throughput sequencing data. Bioinformatics 31, 166–169. [DOI] [PMC free article] [PubMed] [Google Scholar]
- Asuthkar S, Nalla AK, Gondi CS, Dinh DH, Gujrati M, Mohanam S and Rao JS (2011) Gadd45a sensitizes medulloblastoma cells to irradiation and suppresses MMP‐9‐mediated EMT. Neuro Oncol 13, 1059–1073. [DOI] [PMC free article] [PubMed] [Google Scholar]
- Ayala‐Ortega E, Arzate‐Mejía R, Pérez‐Molina R, González‐Buendía E, Meier K, Guerrero G and Recillas‐Targa F (2016) Epigenetic silencing of miR‐181c by DNA methylation in glioblastoma cell lines. BMC Cancer 16, 226. [DOI] [PMC free article] [PubMed] [Google Scholar]
- Buscarlet M and Stifani S (2007) The ‘Marx’ of Groucho on development and disease. Trends Cell Biol 17, 353–361. [DOI] [PubMed] [Google Scholar]
- Chen J, Li Y, Yu TS, McKay RM, Burns DK, Kernie SG and Parada LF (2012) A restricted cell population propagates glioblastoma growth after chemotherapy. Nature 488, 522–526. [DOI] [PMC free article] [PubMed] [Google Scholar]
- Chen PH, Shen WL, Shih CM, Ho KH, Cheng CH, Lin CW, Lee CC, Liu AJ and Chen KC (2017) The CHAC1‐inhibited Notch3 pathway is involved in temozolomide‐induced glioma cytotoxicity. Neuropharmacology 116, 300–314. [DOI] [PubMed] [Google Scholar]
- Chi Z, Zhang J, Tokunaga A, Harraz MM, Byrne ST, Dolinko A, Xu J, Blackshaw S, Gaiano N, Dawson TM et al (2012) Botch promotes neurogenesis by antagonizing Notch. Dev Cell 22, 707–720. [DOI] [PMC free article] [PubMed] [Google Scholar]
- Codó P, Weller M, Kaulich K, Schraivogel D, Silginer M, Reifenberger G, Meister G and Roth P (2016) Control of glioma cell migration and invasiveness by GDF‐15. Oncotarget 7, 7732–7746. [DOI] [PMC free article] [PubMed] [Google Scholar]
- Cusulin C, Chesnelong C, Bose P, Bilenky M, Kopciuk K, Chan JA, Cairncross JG, Jones SJ, Marra MA, Luchman HA et al (2015) Precursor states of brain tumor initiating cell lines are predictive of survival in xenografts and associated with glioblastoma subtypes. Stem Cell Reports 5, 1–9. [DOI] [PMC free article] [PubMed] [Google Scholar]
- Dastidar SG, Landrieu PM and D'Mello R (2011) FoxG1 promotes the survival of postmitotic neurons. J Biol Chem 31, 402–413. [DOI] [PMC free article] [PubMed] [Google Scholar]
- Dastidar SG, Narayanan S, Stifani S and D'Mello SR (2012) Transducin‐like Enhancer of split‐1 (TLE1) combines with Forkhead box protein G1 (FoxG1) to promote neuronal survival. J Biol Chem 287, 14749–14759. [DOI] [PMC free article] [PubMed] [Google Scholar]
- Dirks PB (2006) Cancer: stem cells and brain tumours. Nature 444, 687–688. [DOI] [PubMed] [Google Scholar]
- Dunham I, Kundaje A, Aldred SF, Collins PJ, Davis CA, Doyle F, Epstein CB, Frietze S, Harrow J, Kaul R et al (2012) An integrated encyclopedia of DNA elements in the human genome. Nature 489, 57–74. [DOI] [PMC free article] [PubMed] [Google Scholar]
- Eiraku M, Tohgo A, Ono K, Kaneko M, Fujishima K, Hirano T and Kengaku M (2005) DNER acts as a neuron‐specific Notch ligand during Bergmann glial development. Nat Neurosci 8, 873–880. [DOI] [PubMed] [Google Scholar]
- Fasano CA, Phoenix TN, Kokovay E, Lowry N, Elkabetz Y, Dimos JT, Lemischka IR, Studer L and Temple S (2009) Bmi‐1 cooperates with Foxg1 to maintain neural stem cell self‐renewal in the forebrain. Genes Dev 23, 561–574. [DOI] [PMC free article] [PubMed] [Google Scholar]
- Greene M, Lai Y, Pajcini K, Bailis W, Pear WS and Lancaster E (2016) Delta/Notch‐like EGF‐related receptor (DNER) is not a Notch ligand. PLoS One 11, e0161157. [DOI] [PMC free article] [PubMed] [Google Scholar]
- Han ZX, Wang XX, Zhang SN, Wu JX, Qian HY, Wen YY, Tian H, Pei DS and Zheng JN (2014) Downregulation of PAK5 inhibits glioma cell migration and invasion potentially through the PAK5‐Egr1‐MMP2 signaling pathway. Brain Tumor Pathol 31, 234–241. [DOI] [PubMed] [Google Scholar]
- Heinz S, Benner C, Spann N, Bertolino E, Lin C, Laslo P, Cheng JX, Murre C, Singh H and Glass CK (2010) Simple combinations of lineage‐determining transcription factors prime cis‐regulatory elements required for macrophage and B cell identities. Mol Cell 38, 576–589. [DOI] [PMC free article] [PubMed] [Google Scholar]
- Kelly JJ, Stechishin O, Chojnacki A, Lun X, Sun B, Senger DL, Forsyth P, Auer RN, Dunn JF, Cairncross JG et al (2009) Proliferation of human glioblastoma stem cells occurs independently of exogenous mitogens. Stem Cells 27, 1722–1733. [DOI] [PubMed] [Google Scholar]
- Kilpinen S, Autio R, Ojala K, Iljin K, Bucher E, Sara H, Pisto T, Saarela M, Skotheim RI, Bjorkman M et al (2008) Systematic bioinformatic analysis of expression levels of 17,330 human genes across 9,783 samples from 175 types of healthy and pathological tissues. Genome Biol 9, R139. [DOI] [PMC free article] [PubMed] [Google Scholar]
- Krona C, Ejeskär K, Carén H, Abel F, Sjöberg RM and Martinsson T (2004) A novel 1p36.2 located gene, APITD1, with tumour‐suppressive properties and a putative p53‐binding domain, shows low expression in neuroblastoma tumours. Br J Cancer 91, 1119–1130. [DOI] [PMC free article] [PubMed] [Google Scholar]
- Kumamoto T, Toma K, Gunadi, McKenna WL, Kasukawa T, Chen B and Hanashima C (2013) Foxg1 coordinates the switch from non‐radially to radially migrating glutamatergic subtypes in the neocortex through spatiotemporal repression. Cell Rep 3, 931–945. [DOI] [PMC free article] [PubMed] [Google Scholar]
- Kumar A, Tikoo S, Maity S, Sengupta S, Sengupta S, Kaur A and Bachhawat AK (2012) Mammalian proapoptotic factor ChaC1 and its homologues function as gamma‐glutamyl cyclotransferases acting specifically on glutathione. EMBO Rep 13, 1095–1101. [DOI] [PMC free article] [PubMed] [Google Scholar]
- Langmead B and Salzberg SL (2012) Fast gapped‐read alignment with Bowtie 2. Nat Methods 9, 357–359. [DOI] [PMC free article] [PubMed] [Google Scholar]
- Lathia JD, Mack SC, Mulkearns‐Hubert EE, Valentim CL and Rich JN (2015) Cancer stem cells in glioblastoma. Genes Dev 29, 1203–1217. [DOI] [PMC free article] [PubMed] [Google Scholar]
- Lawrence M, Huber W, Pages H, Aboyoun P, Carlson M, Gentleman R, Morgan MT and Carey VJ (2013) Software for computing and annotating genomic ranges. PLoS Comput Biol 9, e1003118. [DOI] [PMC free article] [PubMed] [Google Scholar]
- Leek JT, Johnson WE, Parker HS, Fertig EJ, Jaffe AE and Storey JD. (2016) sva: Surrogate Variable Analysis. R package version 3.22.0. https://bioconductor.org/packages/release/bioc/manuals/sva/man/sva.pdf.
- Lino MM, Merlo A and Boulay JL (2010) Notch signaling in glioblastoma: a developmental drug target? BMC Med 8, 72. [DOI] [PMC free article] [PubMed] [Google Scholar]
- Liu F, Hon GC, Villa GR, Turner KM, Ikegami S, Yang H, Ye Z, Li B, Kuan S, Lee AY et al (2015) EGFR mutation promotes glioblastoma through epigenome and transcription factor network remodeling. Mol Cell 60, 307–318. [DOI] [PMC free article] [PubMed] [Google Scholar]
- Louis DN, Ohgaki H, Wiestler OD, Cavenee WK, Burger PC, Jouvet A, Scheithauer BW and Kleihues P (2007) The 2007 WHO classification of tumours of the central nervous system. Acta Neuropathol 114, 97–109. [DOI] [PMC free article] [PubMed] [Google Scholar]
- Manoranjan B, Wang X, Hallett RM, Venugopal C, Mack SC, McFarlane N, Nolte SM, Scheinemann K, Gunnarsson T, Hassell JA et al (2013) FoxG1 interacts with Bmi1 to regulate self‐renewal and tumorigenicity of medulloblastoma stem cells. Stem Cells 31, 1266–1277. [DOI] [PubMed] [Google Scholar]
- Marcal N, Patel H, Dong Z, Belanger‐Jasmin S, Hoffman B, Helgason CD, Dang J and Stifani S (2005) Antagonistic effects of Grg6 and Groucho/TLE on the transcription repression activity of brain factor 1/FoxG1 and cortical neuron differentiation. Mol Cell Biol 25, 10916–10929. [DOI] [PMC free article] [PubMed] [Google Scholar]
- Mi H, Muruganujan A, Casagrande JT and Thomas PD (2013) Large‐scale gene function analysis with the PANTHER classification system. Nat Protoc 8, 1551–1566. [DOI] [PMC free article] [PubMed] [Google Scholar]
- Mi H, Poudel S, Muruganujan A, Casagrande JT and Thomas PD (2016) PANTHER version 10: expanded protein families and functions, and analysis tools. Nucleic Acids Res 44, D336–D342. [DOI] [PMC free article] [PubMed] [Google Scholar]
- Mungrue IN, Pagnon J, Kohannim O, Gargalovic P and Lusis AJ (2009) CHAC1/MGC4504 is a novel proapoptotic component of the unfolded protein response, downstream of the ATF4‐ATF3‐CHOP cascade. J Immunol 182, 466–476. [DOI] [PMC free article] [PubMed] [Google Scholar]
- Nuthall HN, Joachim K and Stifani S (2004) Phosphorylation of serine 239 of Groucho/TLE1 by protein kinase CK2 is important for inhibition of neuronal differentiation. Mol Cell Biol 24, 8395–8407. [DOI] [PMC free article] [PubMed] [Google Scholar]
- Robertson E, Perry C, Doherty R and Madhusudan S (2015) Transcriptomic profiling of Forkhead box transcription factors in adult glioblastoma multiforme. Cancer Genomics Proteomics 12, 103–112. [PubMed] [Google Scholar]
- Rong Y, Belozerov VE, Tucker‐Burden C, Chen G, Durden DL, Olson JJ, Van Meir EG, Mackman N and Brat DJ (2009) Epidermal growth factor receptor and PTEN modulate tissue factor expression in glioblastoma through JunD/activator protein‐1 transcriptional activity. Cancer Res 69, 2540–2549. [DOI] [PMC free article] [PubMed] [Google Scholar]
- Roth M, Bonev B, Lindsay J, Lea R, Panagiotaki N, Houart C and Papalopulu N (2010) FoxG1 and TLE2 act cooperatively to regulate ventral telencephalon formation. Development 137, 1553–1562. [DOI] [PMC free article] [PubMed] [Google Scholar]
- Sarkar S, Mirzaei R, Zemp FJ, Wei W, Senger DL, Robbins SM and Yong VW (2017) Activation of NOTCH signaling by Tenascin‐C promotes growth of human brain tumor‐initiating cells. Cancer Res 77, 3231–3243. [DOI] [PubMed] [Google Scholar]
- Sekiya T and Zaret KS (2007) Repression by Groucho/TLE/Grg proteins: genomic site recruitment generates compacted chromatin in vitro and impairs activator binding in vivo. Mol Cell 28, 291–303. [DOI] [PMC free article] [PubMed] [Google Scholar]
- Silver DP and Livingston DM (2012) Mechanisms of BRCA1 tumor suppression. Cancer Discov 2, 679–684. [DOI] [PMC free article] [PubMed] [Google Scholar]
- Singh SK, Hawkins C, Clarke ID, Squire JA, Bayani J, Hide T, Henkelman RM, Cusimano MD and Dirks PB (2004) Identification of human brain tumour initiating cells. Nature 432, 396–401. [DOI] [PubMed] [Google Scholar]
- Sun P, Xia S, Lal B, Eberhart CG, Quinones‐Hinojosa A, Maciaczyk J, Matsui W, Dimeco F, Piccirillo SM, Vescovi AL et al (2009) DNER, an epigenetically modulated gene, regulates glioblastoma‐derived neurosphere cell differentiation and tumor propagation. Stem Cells 27, 1473–1486. [DOI] [PMC free article] [PubMed] [Google Scholar]
- Takebe N, Nguyen D and Yang SX (2014) Targeting notch signaling pathway in cancer: clinical development advances and challenges. Pharmacol Ther 141, 140–149. [DOI] [PMC free article] [PubMed] [Google Scholar]
- Talasila KM, Røsland GV, Hagland HR, Eskilsson E, Flønes IH, Fritah S, Azuaje F, Atai N, Harter PN, Mittelbronn M et al (2017) The angiogenic switch leads to a metabolic shift in human glioblastoma. Neuro Oncol 19, 383–393. [DOI] [PMC free article] [PubMed] [Google Scholar]
- Tang H, Zhao J, Zhang L, Zhao J, Zhuang Y and Liang P (2016) SRPX2 enhances the epithelial‐mesenchymal transition and temozolomide resistance in glioblastoma cells. Cell Mol Neurobiol 36, 1067–1076. [DOI] [PMC free article] [PubMed] [Google Scholar]
- Trapnell C, Roberts A, Goff L, Pertea G, Kim D, Kelley DR, Pimentel H, Salzberg SL, Rinn JL and Pachter L (2012) Differential gene and transcript expression analysis of RNA‐seq experiments with TopHat and Cufflinks. Nat Protoc 7, 562–578. [DOI] [PMC free article] [PubMed] [Google Scholar]
- Turki‐Judeh W and Courey AJ (2012) Groucho: a corepressor with instructive roles in development. Curr Top Dev Biol 98, 65–96. [DOI] [PubMed] [Google Scholar]
- Van de Walle I, Dolens AC, Durinck K, De Mulder K, Van Loocke W, Damle S, Waegemans E, De Medts J, Velghe I, De Smedt M et al (2016) GATA3 induces human T‐cell commitment by restraining Notch activity and repressing NK‐cell fate. Nat Commun 7, 11171. [DOI] [PMC free article] [PubMed] [Google Scholar]
- Verginelli F, Perin A, Dali R, Fung K, Lo R, Longatti P, Guiot M, Del Maestro R, Rossi S, di Porzio U et al (2013) Transcription factors FOXG1 and Groucho/TLE promote glioblastoma progression. Nat Commun 4, 2956. [DOI] [PMC free article] [PubMed] [Google Scholar]
- Vescovi AL, Galli R and Reynolds BA (2006) Brain tumour stem cells. Nat Rev Cancer 6, 425–436. [DOI] [PubMed] [Google Scholar]
- Yan K, Yang K and Rich JN (2013) The evolving landscape of glioblastoma stem cells. Curr Opin Neurol 26, 701–707. [DOI] [PMC free article] [PubMed] [Google Scholar]
- Yao J, Lai E and Stifani S (2001) The winged‐helix protein brain factor 1 interacts with groucho and hes proteins to repress transcription. Mol Cell Biol 21, 1962–1972. [DOI] [PMC free article] [PubMed] [Google Scholar]
- Yuan D, Yang X, Yuan Z, Zhao Y and Guo J (2017) TLE1 function and therapeutic potential in cancer. Oncotarget 8, 15971–15976. [DOI] [PMC free article] [PubMed] [Google Scholar]
- Yukinaga H, Shionyu C, Hirata E, Ui‐Tei K, Nagashima T, Kondo S, Okada‐Hatakeyama M, Naoki H and Matsuda M (2014) Fluctuation of Rac1 activity is associated with the phenotypic and transcriptional heterogeneity of glioma cells. J Cell Sci 127, 1805–1815. [DOI] [PubMed] [Google Scholar]
- Zhang Y, Liu T, Meyer CA, Eeckhoute J, Johnson DS, Bernstein BE, Nusbaum C, Myers RM, Brown M, Li W et al (2008) Model‐based analysis of ChIP‐Seq (MACS). Genome Biol 9, R137. [DOI] [PMC free article] [PubMed] [Google Scholar]
- Zhu LJ, Gazin C, Lawson N, Pages H, Lin S, Lapointe D and Green MR (2010) ChIPpeakAnno: a bioconductor package to annotate ChIP‐seq and ChIP‐chip data. BMC Bioinformatics 11, 237. [DOI] [PMC free article] [PubMed] [Google Scholar]
Associated Data
This section collects any data citations, data availability statements, or supplementary materials included in this article.
Supplementary Materials
Fig. S1. FOXG1 binds FOXA1 DNA‐binding sites.
Fig. S2. CHAC1 gene expression as function of FOXG1 expression in GBM patients.
Fig. S3. FOXG1 binding sites upstream of CHAC1 gene.
Table S1. PCR and qPCR primers.
Table S2. Common genes differentially regulated in brain tumor‐initiating cells following FOXG1 or TLE1 knockdown.
Table S3. Gene ontology statistics.
Table S4. FOXG1‐regulated genes in brain tumor‐initiating cells.
Table S5. Common genes that are differentially regulated in brain tumor‐initiating cells following FOXG1 or TLE1 knockdown and have proximal FOXG1 binding sites.