

Abstract
Key points
Neuronal oscillations observed in sensory systems are physiological carriers of information about stimulus features.
Rhythm in the infra‐slow range, originating from the retina, was previously found in the firing of subcortical visual system nuclei involved in both image and non‐image forming functions.
The present study shows that the firing of neurons in the lateral geniculate nucleus is also governed by gamma oscillation (∼35 Hz) time‐locked to high phase of infra‐slow rhythm that codes the intensity of transient light stimulation.
We show that both physiological rhythms are synchronized within and between ipsilateral nuclei of the subcortical visual system and are dependent on retinal activity.
The present study shows that neurophysiological oscillations characterized by various frequencies not only coexist in the subcortical visual system, but also are subjected to complex interference and synchronization processes.
Abstract
The physiological function of rhythmic firing in the neuronal networks of sensory systems has been linked with information coding. Also, neuronal oscillations in different frequency bands often change as a signature of brain state or sensory processing. Infra‐slow oscillation (ISO) in the neuronal firing dependent on the retinal network has been described previously in the structures of the subcortical visual system. In the present study, we show for the first time that firing of ISO neurons in the lateral geniculate nucleus is also characterized by a harmonic discharge pattern (i.e. action potentials are separated by the intervals governed by fundamental frequency in the gamma range: ∼35 Hz). A similar phenomenon was recently described in the suprachiasmatic nuclei of the hypothalamus: the master biological clock. We found that both gamma and ISO rhythms were synchronized within and between ipsilateral nuclei of the subcortical visual system and were dependent on the retinal activity of the contralateral eye. These oscillatory patterns were differentially influenced by transient and prolonged light stimulation with respect to both frequency change direction and sustainability. The results of the present study show that the firing pattern of neurons in the subcortical visual system is shaped by oscillations from infra‐slow and gamma frequency bands that are plausibly generated by the retinal network. Additionally, the results demonstrate that both rhythms are not a distinctive feature of image or non‐image forming visual systems but, instead, they comprise two channels carrying distinctive properties of photic information.
Keywords: electrophysiology, gamma frequency, infra‐slow oscillation, lateral geniculate nucleus, subcortical visual system
Key points
Neuronal oscillations observed in sensory systems are physiological carriers of information about stimulus features.
Rhythm in the infra‐slow range, originating from the retina, was previously found in the firing of subcortical visual system nuclei involved in both image and non‐image forming functions.
The present study shows that the firing of neurons in the lateral geniculate nucleus is also governed by gamma oscillation (∼35 Hz) time‐locked to high phase of infra‐slow rhythm that codes the intensity of transient light stimulation.
We show that both physiological rhythms are synchronized within and between ipsilateral nuclei of the subcortical visual system and are dependent on retinal activity.
The present study shows that neurophysiological oscillations characterized by various frequencies not only coexist in the subcortical visual system, but also are subjected to complex interference and synchronization processes.
Introduction
Rhythms that stem from oscillations in the firing rate and membrane potential are crucial physiological phenomena that tune the temporal dynamics of many neuronal networks in the vertebrate brain. Synchronized activity of oscillatory networks is considered to be a good candidate for linking neuronal spiking with function and behaviour (Buzsaki & Draguhn, 2004; Buzsaki et al. 2013). The information flow between both single neurons and interconnected structures can be encoded not only by average firing rate, but also by precise spike timing and relative interspike intervals (ISI) (Buzsaki & Chrobak, 1995; Gollisch & Meister, 2008). Therefore, neuronal networks can operate at various time scales, which is reflected in the broad range of oscillatory frequencies found in the brain (Buzsaki, 2006). The neighbouring frequency bands often change within one structure as a signature of different physiological brain states or sensory processing (Buzsaki & Draguhn, 2004; Schroeder & Lakatos, 2009; Buzsaki & Wang, 2012). However, diverse rhythms can coexist in the activity of a single neuron and influence each other (White et al. 2000; Canolty et al. 2006; Jansen & Colgin, 2007; Sirota et al. 2008).
The lateral geniculate nucleus of the thalamus (LGN) is part of the subcortical visual system that, in rodents, can be further divided into three anatomically and physiologically distinct divisions: the dorsolateral geniculate nucleus (DLG), the intergeniculate leaflet (IGL) and the ventrolateral geniculate nucleus (VLG). The DLG is implicated in the physiology of image‐forming vision, whereas the IGL and VLG are a part of a non‐image forming visual system involved in the modulation of circadian rhythmicity and visuomotor functions, respectively. The whole complex is densely innervated by retinal ganglion cells but also receives non‐photic input (e.g. from the brainstem and cortex) (Harrington, 1997; Sherman & Guillery, 2002; Sherman, 2005). Infra‐slow oscillatory (ISO) (<0.01 Hz) activity that originates in the retina (cat: Ascoli & Maffei, 1964; Rodieck, 1967; rat: Freeman et al. 2008) is maintained by a subpopulation of LGN cells (Albrecht & Gabriel, 1994; Albrecht et al. 1998; Lewandowski et al. 2000, 2002; Lewandowski & Blasiak, 2004; Filippov & Frolov, 2005; Blasiak & Lewandowski, 2013; Chrobok et al. 2017b). Furthermore, this characteristic pattern is found in other structures of the subcortical visual system, such as the olivary pretectal nucleus, which is responsible for pupil constriction (OPN) (Szkudlarek et al. 2008, 2012), and the suprachiasmatic nucleus of the hypothalamus, which comprises the master biological clock (SCN) (Miller & Fuller, 1992). The ISO pattern was shown to be synchronized in neurons innervated by the same (contralateral) eye and is dependent on retinal activity (Lewandowski & Blasiak, 2004; Szkudlarek et al. 2008; Orlowska‐Feuer et al. 2016a, b ).
A recent study of the rat SCN reports a novel rhythm found at the level of ISIs, which was also recorded in ISO neurons (Tsuji et al. 2016). This fast oscillation (∼32 Hz) with an unknown origin was named the harmonic distribution pattern (HDP) because the modes in the ISI histogram created the harmonics of a sine wave. However, a multimodal distribution of ISI with the same fundamental frequency has been previously found in rats at the level of the retinal ganglion cell axons and was recorded from the optic tract under different anaesthetic conditions (cat: Heiss & Bornschein, 1966; rat: Freeman et al. 2008). These gamma frequency oscillations were extensively studied in the frog retina (Ishikane et al. 1999) and putatively arose from the GABAA receptor‐dependent rhythmic activity of amacrine cells (Arai et al. 2004). Similarly, recent studies in mouse highlight the dependency of retinal gamma on electrical coupling amongst amacrine cells (Roy et al. 2017). Higher frequency gamma oscillations were also found in the cat retina and DLG (Arnett, 1975; Munemori et al. 1984; Neuenschwander & Singer, 1996; Ito et al. 2010). Furthermore, multimodal ISI histograms are proposed to be a feature of sensory systems and were also found in shark thermoreceptor cells (Braun et al. 1994).
In the present study, we show that there is fast oscillatory activity in the gamma frequency range (named HDP; ∼35 Hz) exhibited by ISO neurons in the rat LGN. Our results highlight the ability of single LGN cells to conjoin several oscillatory rhythms as bursting, gamma oscillatory activity, ISO activity and firing rate changes evoked by alternating brain states. The reported data show that gamma frequency is modulated by transient but not sustained changes in lighting conditions that depend on light intensity. Also, gamma band oscillation is synchronized among neurons innervated by the same (contralateral) retina in one LGN and between subcortical visual structures (ipsilateral LGN and OPN).
Methods
Ethical approval
All procedures were approved by the Local Ethics Committee of the Jagiellonian University in Krakow. Animals were maintained and used in accordance with Polish regulations and the European Communities Council Directive (86/609/EEC). Experimental protocols were designed to minimize suffering and the number of animals used in the study.
Animals
Rats were bred at the Institute of Zoology and Biomedical Research Animal Facility at the Jagiellonian University in Krakow under restricted lighting conditions (12:12 h light/dark cycle; lights on 07.00 h) at 23°C and 67% relative humidity. Food and water were provided ad libitum. Male, Wistar rats were housed two to six per cage. All experiments were conducted on adult rats, weighing 215–390 g.
Anaesthesia and surgery
Before each surgery, rats were anaesthetized with an i.p. injection of urethane (1.5 g kg−1) diluted in saline and up to two additional doses (10% of the initial dose) were supplied when withdrawal reflexes indicated that animal had not reached a deep anaesthetic state. Throughout the whole experiment, the electrocardiogram was monitored and deep body temperature was adjusted to 37°C with the use of automatic heating pad. Deeply anaesthetized rats were mounted in the stereotaxic frame (Advanced Stereotaxic Instruments, Warren, MI, USA) on the ear and incisor bars. Next, the cranium was exposed by the sagittal incision and stereotactic points were set. Craniotomy was performed above the LGN (4.0 mm lateral, 4.2–5.0 mm posterior) or OPN (1.5 mm lateral, 4.8 mm posterior, using the bregma as a reference) (Paxinos & Watson, 2007). Additional craniotomy was made for epidural electrocorticogram (ECoG) recordings. Exposed brain surfaces were covered with mineral oil to minimize tissue drying. Eyes were kept open, atropinized and covered with mineral oil.
Single‐channel recordings
Borosilicate electrodes pulled at the horizontal puller (CO P‐97; Sutter Instruments, Novato, CA, USA) were filled with 4% Chicago Sky Blue dissolved in 2 m NaCl solution and placed in the LGN or, in the case of simultaneous recordings, in two contralateral LGNs or in ipsilateral LGN and OPN. Extracellular signals were amplified 10 000× with the preamplifier and CyberAmp 380 amplifier (Axon Instruments, Foster City, CA, USA) and filtered at 300–3000 Hz. The signal was digitized and recorded with a CED Micro mkII interface (sampling rate of 20 kHz) and Spike2 software (Cambridge Electronic Design Inc., Cambridge, UK). Experimental protocols were initialized in the lights on condition when ISO activity was found, as visualized online with the firing histogram (bin of 1 s). Additionally, instantaneous frequency plots and ISI histograms were generated online. General light responsiveness was established by the response to the transient LED light flash (duration of 5 s). After a stable recording in the lights on conditions (minimum 20 min), the light was turned off (the Faraday cage was protected with light‐impermeable black foil) and the recording maintained for next 20 min or more. In part of the recordings, light pulses of 280 lux (eight pulses, duration of 5 s, pulse latency of 30 s) or three repetitive sets of pulses (intensities: 5, 80 and 280 lux; set latency of 5 min) were presented on the contralateral eye after a minimum of a 30 min long dark adaptation. During one protocol, intraocular injections of TTX (1 mm, 5 μL) were made to contralateral or ipsi‐ and contralateral eyes to block retinal activity, after the reinducement of lights on conditions. After each recording, negative current (20 μA) was applied for 10 min to deposit a dye mark at the recording site.
Multichannel recordings
Next, 32‐channel, 4‐shank silicon probes were placed in the LGN or OPN (LGN: model E32+R150‐S4‐L10‐200 NT; OPN: model E32+R50‐S4‐L10‐200 NT; ATLAS Neuroengineering, Leuven, Belgium). The unamplified signal was digitized (40 kHz; digital headstage processor, HDP; Plexon Inc., TX, USA) and feed to OmniPlex D Neural Data Acquisition System (Plexon Inc.) for band pass filtering (300–7500 Hz) and storage. The multi‐unit signal was recorded for at least 30 min under lights on and lights off conditions, respectively. Then, the responsiveness to light was assessed with three light flashes presented to the contralateral eye (pulse duration of 5 s). To mark the recording location, electrodes were covered with fluoresecent green dye.
EcoG recording
ECoG was recorded simultaneously with both single‐ and multichannel recordings. Recordings were conducted with silver wire electrode mounted on the stainless steel screw. The signal was amplified 10 000× and band‐pass filtered at 1–300 Hz with a CyberAmp 380 amplifier. To record ECoG signal at the computer, CED Micro mkII interface and Spike2 software were used.
Histological verification
After each successful experiment, animals were given an overdose of barbiturates. Brains were extracted and fixed with 4% paraformaldehyde in 0.1 m phosphate buffered saline (pH 7.4) for at least 24 h. Then, the tissue was cut into 100 μm thick coronal slices on the vibroslicer (VT1000S; Leica, Heidelberg, Germany). Chicago Sky Blue and fluoresecent green marks were visualized using light microscopy. The locations of recording sites were established with the rat brain atlas (Paxinos & Watson, 2007).
In vitro extracellular recording
An additional set of experiment was performed with 250 μm thick coronal thalamic slices obtained from six young (14–28 days old) Wistar rats. Animals were anaesthetized with isoflurane (2 ml kg−1 body weight) and decapitated. The brain was quickly removed from the scull and immersed in ice‐cold oxygenated artificial cerebrospinal fluid composed of 118 mm NaCl, 25 mm NaHCO3, 3 mm KCl, 1.2 mm NaH2PO4, 2 mm CaCl2, 2 mm MgCl2 and 10 mm glucose. Subsequently, the block of tissue containing thalamus was dissected from the brain and cut on the cold plate of a vibroslicer (VT1000S; Leica). Slices containing VLG were placed in the pre‐incubation chamber for at least 1 h at 32°C and then in the recording chamber, also at 32 °C. Glass electrodes filled with 2 m NaCl were placed in VLG under visual microscopic control. To record single units, the signal was filtered (50 Hz to 2 kHz), amplified 10 000× using an X‐3Cell amplifier (FHC Inc., Bowdoin, ME, USA) and digitized at 20 kHz. Spike2 software was used for data recording and analysis.
Statistical analysis
Single units were sorted manually in Spike2 and an Offline Sorter (Plexon, Dallas, TX, USA) based on principal components analysis. Firing frequency histograms and instantaneous frequency plots were prepared in Spike2. Analysis of the ISO pattern (intra‐ and extraburst length and rate) and its frequency (as assessed by fast Fourier transformation) was carried out in MATLAB (MathWorks Inc., Natick, MA, USA) with the use of custom made script. The fundamental frequency of the HDP was calculated from ISI histograms created in NeuroExplorer (Nex Technologies, Madison, AL, USA). Peristimulus histograms, auto‐ and cross‐correlograms were also computed in NeuroExplorer. For all ISI histograms, autocorrelograms and cross‐correlograms, bins equal 0.001 s (1 s for the firing rate histograms). Statistical tests (one‐way ANOVA, paired/unpaired t tests, Tukey's, Holm–Sidak, Mann–Whitney, Kruskal–Wallis and Wilcoxon tests) were performed in Prism, version 5 (GraphPad Software Inc., San Diego, CA, USA). The images reported in the Results were prepared with CorelDraw 6 (Corel, Ottawa, Ontario, Canada).
Results
General characteristics of ISO neurons in LGN
During the first set of single‐channel extracellular experiments, we recorded a total of 68 ISO neurons from 29 Wistar rats that were localized at the LGN, as confirmed by post‐recording histological verification. All of the recordings were started under bright room light conditions (∼300 lux) and therefore only units that exhibited an ISO pattern in light were studied further. This characteristic firing pattern with a mean period of 162.2 ± 61 s (range 76–352 s) was found in the DLG (n = 19) (Fig. 1 Aa), IGL (n = 25) (Fig. 1 Ba) and VLG (n = 24) (Fig. 1 Ca). The oscillation period did not vary between structures (P = 0.0944, Kruskal–Wallis test) and all neurons responded to the short light flash presented to the contralateral eye. After recording a stable ISO pattern for at least 20 min, the lights were turned off and the Faraday cage was covered with light‐impermeable foil (<1 lux). Under these dark conditions, the ISO pattern remained present in the DLG and VLG but vanished or had a strongly reduced amplitude in IGL neurons (Fig. 1 Aa, Ba and Ca). Nevertheless, the characteristics of the ISO pattern changed in the darkness. The period was shortened (DLG: 169.6 ± 13.75 s vs. 131.0 ± 10.82 s, P = 0.0001, n = 17, paired t test; VLG: 143.1 ± 8.0 s vs. 125.2 ± 9.4 s, P = 0.0073, n = 24, Wilcoxon test) (Fig. 2) as a result of shorter intraburst intervals (DLG: 93.4 ± 7.9 s vs. 79.8 ± 6.3 s, P = 0.0452, paired t test; VLG: 78.2 ± 4.9 s vs. 59.3 ± 4.8, P < 0.0001, Wilcoxon test) (Fig. 2), although changes in extraburst intervals were not significant (DLG: 82.6 ± 7.8 s vs. 74.4 ± 9.0 s, P = 0.3529; VLG: 65.6 ± 7.2 s vs. 64.7 ± 6.8 s, P = 0.8061, Wilcoxon tests) (Fig. 2). The firing rate of ISO neurons in LGN was differentially affected by lighting conditions. In the case of DLG, the firing rate in extrabursts and intrabursts did not differ between lights on and lights off conditions (intraburst: 4.5 ± 0.8 Hz vs. 3.7 ± 0.6 Hz, P = 0.1202, n = 17; extraburst: 1.5 ± 0.3 Hz vs. 1.2 ± 0.3 Hz, P = 0.0856, n = 16, Wilcoxon tests; one neuron was excluded from analysis as an outlier) (Fig. 2). However, the activity of VLG neurons was lowered in darkness, which was significant for intraburst intervals (intraburst: 6.5 ± 1.2 Hz vs. 4.9 ± 0.8 Hz, P = 0.0179, n = 24; extraburst: 1.9 ± 0.5 Hz vs. 1.3 ± 0.4 Hz, P = 0.1695, n = 24, Wilcoxon tests) (Fig. 2). Two DLG neurons were omitted from the analysis as a result of their very low firing; similarly, an analysis was not performed on IGL neurons because of sparse activity in darkness.
Figure 1. Firing patterns of ISO neurons in the LGN.

Exemplary recordings of ISO units in DLG (Aa), IGL (Ba) and VLG (Ca) are presented as firing histograms (bin: 1 s; below) with corresponding instantaneous frequency plots (each dot represents 1/ISI; above). ISI histograms (Ab, Bb, Cb) and autocorrelation plots (Ac, Bc, Cc) were created for the recordings shown (bin: 1 ms). Yellow boxes indicate plots and recordings under lights on conditions. (Da) Regularity of firing was assessed in accordance with Young's regularity criterion: dots in the scatterplot localized below the dashed line (coefficient of variation; Cv ≤ 0.35) were classified as regular. Note that the striking majority of neurons were firing in an irregular manner. Units with a HDP of ISIs are marked in red. (Db) The HDP was characterized by multiple modes in ISI histograms occurring with the fundamental frequency. (Dd) Relative proportions of regular and non‐regular neurons in three substructures of LGN recorded in Wistar rats are presented as pie charts. Regardless of the regularity of firing, 53% (10/19) of ISO neurons located in DLG, 12% (3/25) in IGL and 59% (13/22) in VLG expressed a HDP. Grey indicates non‐regular neurons (Cv > 0.35); red indicates non‐regular neurons that express a HDP; yellow indicates regular neurons (Cv ≤ 0.35) and orange indicates regular neurons with a HDP. For all ISI histograms and autocorrelograms, bins equal 0.001 s. [Color figure can be viewed at http://wileyonlinelibrary.com]
Figure 2. Light‐evoked changes in the ISO pattern in the LGN.

Period of ISO activity was shaped by lighting conditions: the significant sustained period shortening evoked by darkness was apparent for DLG (*** P = 0.0001, paired t test) and VLG (** P = 0.0073, Wilcoxon test). The period shortening in darkness resulted from narrowed intrabursts (DLG: * P = 0.0452; VLG: **** P < 0.0001, paired t tests) rather than extrabursts. No evident firing rate modulation by lighting conditions was seen in DLG. However, the firing rate in intra‐ but not the extraburst phase was lowered in darkness in VLG (* P = 0.0179, Wilcoxon test). As a result of the absence of the ISO pattern in IGL in darkness, we were unable to compare lighting conditions in this group. [Color figure can be viewed at http://wileyonlinelibrary.com]
Firing patterns of ISO neurons in LGN
ISI histograms were prepared and further analysed for 66 ISO neurons recorded in Wistar rats (Fig. 1 Aa, Ba and Ca) (two neurons were omitted from the analysis as a result of their very low firing). The regularity of firing was assessed by a coefficient of variation (Cv) for ISI according to Young's regularity criterion (Young et al. 1988). A substantial minority of neurons, for which the coefficient of variation (Cv) did not exceed 0.35, were classified as regular. In the DLG and VLG, there was only one regular neuron each, whereas eight neurons were firing in a regular manner in the IGL (Fig. 1 Da). Neurons for which Cv was higher than 0.35 were classified as generating action potentials in a non‐regular manner (referred to as ‘non‐regular’).
The HDP of ISIs shapes the firing of ISO LGN neurons in the gamma frequency range
The large subpopulation of recorded ISO neurons in the LGN (26 out of 66 cells, 39%) (Fig. 1 Da and Dd) could be described by ISI histograms with multiple modes separated by a common interval named the fundamental interval (i.e. modes creating the harmonics of the fundamental frequency) (Fig. 1 Db; see also Fig. 1 Ab and Cb). Modes of repeated multiplied frequencies are also clearly seen as ‘bands’ in the instantaneous frequency plots (Fig. 1 Aa and Ca). Neurons firing with various mean frequencies possessed very similar fundamental intervals between modes, and they varied only in high relative modes (i.e. more active neurons possessed relatively higher modes of shorter ISIs). The HDP was recently described in light‐responsive SCN neurons of Sprague–Dawley rats in a study by Tsuji et al. (2016) with a fundamental frequency of ∼32 Hz. The ISO neurons characterized by a HDP recorded in the LGN of Wistar rats in the present study had a similar fundamental frequency of 35.14 ± 0.59 Hz (range 26.32–44.44 Hz, n = 57; all LGN neurons with a HDP that were recorded during single‐channel protocols) (Fig. 1 Dc). Overall, a HDP was found in more than half of the ISO neurons in the DLG and VLG but was less frequent in the IGL (Fig. 1 Dd). The apparent fundamental frequency of the HDP (∼35 Hz) found in LGN neurons (recorded in the present study) and SCN cells (recorded by Tsuji et al. 2016) indicates that the activity of investigated cells is shaped by the gamma band oscillation.
ISO neurons recorded in the LGN possessed an ability to generate bursts of action potentials (Fig. 3 A and B), which appear as a sharp peak at <4 ms in the ISI histogram and are also noted in the autocorrelation graph (Fig. 3 C and D). This peak corresponded to doublets of spikes (also triples and quadruplets; data not shown) presented in Fig. 3 E. Bursts of spikes emerged in most (but not all) neurons with a HDP, which appear as a peak preceding the first harmonic mode in the ISI histogram and autocorrelogram (Fig. 3 F and G). In this case, not one but two (or more) spikes appear at the top of a sine wave representing the fundamental frequency of the HDP (Fig. 3 E). Therefore, bursting enables ISO neurons with a HDP to display a higher firing rate than their fundamental frequency.
Figure 3. Bursting of ISO neurons in the LGN.

Exemplary recordings of ISO activity in DLG (A) and VLG (B) are presented as firing histograms (bin: 1 s; below) and instantaneous frequency plots (above). Note that high frequencies (>250 Hz) can be seen in the plots. These frequency band corresponds to sharp peaks in ISI histograms (indicated by arrows; C and F) and autocorrelograms (D and G). Yellow boxes indicate plots and recordings under lights on conditions. Doublets of spikes of a short ISI (marked with asterisks; <4 ms; E) can be found not only in the ‘bursting’ subtype of ISO neurons, but also characterize the majority (but not all) of HDP‐expressing cells (B, F, G). Sine wave in (E) represents the harmonic frequency of the recorded ISO neurons. Note that more than one spike (burst) can occur at the top of a wave. For all ISI histograms and autocorrelograms, bins equal 0.001 s. [Color figure can be viewed at http://wileyonlinelibrary.com]
Infra‐slow oscillatory activity across alternating brain states
Previous studies have demonstrated that urethane anaesthetized animals show repetitive changes in the level of cortical activation, as accompanied by variations of physiological parameters and neuronal activity of many brain sites, resembling the cyclic changes observed during sleep (Clement et al. 2008; Whitten et al. 2009; Devonshire et al. 2010; Pagliardini et al. 2012, 2013a, b ; Crook & Lovick, 2016; Walczak & Blasiak, 2017). During our recordings, we observed spontaneous brain state alternations expressed as cyclic changes in the ECoG. Distinct theta oscillations (∼4 Hz) were present during cortical activation, whereas dominant delta frequency (<1 Hz) was observed during cortical slow wave activity (SWA) (Fig. 4). Thirty‐five ISO neurons were recorded and analysed across alternating brain states. The remaining recordings were performed during constant SWA, or the cortical activation was too short to analyse the brain state‐dependent changes in the ISO pattern. The period of ISO differed between brain states neither in lights on conditions (DLG: P = 0.3125, n = 9, Wilcoxon test; IGL: P = 0.5557, n = 12; VLG: P = 0.9687, n = 14, paired t tests) (Fig. 4), nor in darkness (DLG: P = 0.6875, n = 8, paired t test; VLG: P = 0.6627, n = 18, Wilcoxon test) (Fig. 4 A and C). However, lengthening of intrabursts during cortical activation was noted in IGL (P = 0.0162, n = 12, paired t test) (Fig. 4 B).
Figure 4. Modulation of ISO neurons by alternating brain states.

Exemplary recordings of ISO activity are shown for DLG (A), IGL (B) and VLG (C) as firing histograms (bin: 1 s) and corresponding instantaneous frequency (If) plots. Simultaneous ECoG recordings are shown as a raw signal (in blue) and frequency content (fast Fourier transformation, Hanning window function, greyscale: 0–50 dB, resolution: 0.125 Hz). Spontaneous cycles of cortical activation (Act; low amplitude waves in theta frequency ∼4 Hz) and SWA (high amplitude waves in delta frequency ∼1 Hz) were observed. In general, alternating brain states did not evoke any changes in the ISO period; however, the increase of intraburst phase length during Act was observed in IGL (* P = 0.0162, paired t test). DLG and VLG neurons increased their firing rate during Act under lights on conditions (DLGintraburst: * P = 0.0173; DLGextraburst: * P = 0.0495; VLGintraburst: * P = 0.0156, paired t tests; VLGextraburst: * P = 0.0353, Wilcoxon test), although rate modulation by brain states in darkness was significant only for DLG ISO neurons (DLGintraburst: * P = 0.0473, paired t test; DLGextraburst: * P = 0.0391, Wilcoxon test). The firing rate of IGL ISO neurons was not significantly modulated by alternating brain states. [Color figure can be viewed at http://wileyonlinelibrary.com]
Alternating brain states differentially modulated the activity of three parts of LGN. In lights on conditions, the firing rate of DLG and VLG neurons was significantly higher during cortical activation in both intra‐ (DLG: P = 0.0173, n = 10; VLG: P = 0.0156, n = 14, paired t tests) (Fig. 4 A and C) and extraburst phases of ISO (DLG: P = 0.0495, paired t test; VLG: P = 0.0353, Wilcoxon test) (Fig. 4 A and C). In darkness, the modulation of firing rate was significant only in case of DLG recordings (intraburst: P = 0.0473, paired t test; extraburst: P = 0.0391, n = 8, Wilcoxon test) (Fig. 4 A). The activity of IGL neurons did not differ between SWA and cortical activation (intraburst rate: P = 0.6221, paired t test; extraburst rate: P = 0.0923, n = 12, Wilcoxon test) (Fig. 4 B).
Light‐evoked changes in gamma frequency oscillation in LGN
A subsequent section of the present study was devoted to characterizing the recently discovered HDP of ISO neurons in the LGN, a fingerprint of a gamma oscillatory activity. First, because all of the ISO neurons are light‐sensitive, we aimed to determine whether transient and sustained changes in ambient light conditions influence this contiguous discharge patterning. Neurons exhibiting a HDP showed no preference for any particular type of light response (data not shown). After 30 min under lights off conditions, 14 ISO neurons recorded in the LGN were subjected to three repetitive light pulse trains (eight pulses in each train with a duration of 5 s) of three different light intensities (5, 80 and 280 lux) separated by ten minutes of darkness (Fig. 5 A). ISI plots were created for the sum of discrete time windows for each light intensity and they were compared with the baseline (Fig. 5 B). Nine neurons transiently increased the fundamental frequency of the HDP in a light intensity‐dependent manner (P < 0.0001, ANOVA) (Fig. 5 C and D). The observed increase in fundamental frequency was significantly stronger for each subsequent light intensity (0 – 5 lux: P = 0.0175; 5–80 lux: P = 0.0002; 80–280 lux: P = 0.0032; Tukey's tests). For five neurons, transient light stimulation abolished the HDP (Fig. 5 D). Sixteen neurons with a HDP recorded in the LGN and OPN (the descriptions of OPN recordings are presented in consecutive sections) were subjected to a similar protocol, and only the 280 lux light pulses were presented to the contralateral eye. In eleven cases, light stimulation increased the fundamental frequency of the HDP (P = 0.0002, paired t test) (Fig. 5 C and D), whereas, in seven cases, the HDP vanished in response to light (Fig. 5 D). Observations of light‐evoked changes in the HDP were performed in the lights on cells because, in the case of lights off neurons, the number of spikes was insufficient for reliable analysis. Neurons were classified as lights on when an increase in firing rate was recorded during the light pulse. By contrast, lights off neurons decreased their firing rate during the stimulus.
Figure 5. Changes in HDP evoked by transient light stimulation.

A, exemplary recording of a lights on ISO neuron exhibiting HDP in LGN shown as a firing histogram (bin: 1 s) and instantaneous frequency plot. Trains of eight light pulses (pulse duration: 5 s, pulse latency: 30 s) of the increasing light intensity (yellow bars), separated by 10 min of darkness, were presented to the contralateral eye. Enlargements of 100 s recording time windows including neuronal responses [(1) 5 lux; (1) 80 lux; (3) 280 lux] are presented below. B, ISI histograms created from dissected stimulation times show the increase of the fundamental frequency of the HDP dependent on the increasing light intensity. C, LGN neurons tested significantly increased the fundamental frequency upon transient light stimulation in three different light intensities (above; **** P < 0.0001, ANOVA). Other lights on ISO neurons in LGN and OPN were tested with 280 lux light pulse intensity only; the fundamental frequency of HDP increased during transient light stimulation (below, *** P = 0.0002, paired t test). D, proportion of cells that changed the fundamental frequency of the HDP in both protocols (in grey) to those neurons that failed to express a HDP in the response to transient light stimulation (in red) or HDP vanished during light pulses of an intensity >5 lux (in pink). For all ISI histograms, bins equal 0.001 s. [Color figure can be viewed at http://wileyonlinelibrary.com]
By contrast, we observed that the HDP was invulnerable to sustained changes in ambient light and remained very stable across alternating brain states (Fig. 6 A). When light was reinstated after the prolonged period of darkness (>30 min), the fundamental frequency of the HDP increased only for a short time and then returned to control values (Fig. 6 C and D). It is worth noting that the ISO pattern underwent permanent changes under different constant light conditions (e.g. period shortening in darkness) (Fig. 2), whereas the HDP was changed only in a transient manner. Also, the direction of light‐induced change was the opposite with an increase in the fundamental frequency of the HDP and a decrease in ISO frequency. No significant changes in fundamental frequency were noted between lights on and lights off conditions (P = 0.3361, paired t test, n = 59) (Fig. 6 B), as well as between alternating brain states (lights on: P = 0.1075, n = 29; lights off: P = 0.3293, n = 26) (Fig. 6 B).
Figure 6. Oscillatory activity in gamma range is stable in LGN ISO neurons across alternating brain states and sustained lighting conditions.

A, exemplary recording of an ISO neuron shown as a firing histogram. Additional oscillatory activity of ∼40 Hz can be observed in the power spectral density plot (PSD; fast Fourier transformation, Hamming window function, resolution: 256 Hz). No changes in gamma frequency were noted over time, between lights on and lights off conditions and across brain activation states (shown as a raw electrocorticogram recording; ECoG, in blue). B, in summary, fundamental frequency of gamma oscillation was stable in LGN between lights on and lights off conditions (light/dark; P = 0.3361, paired t test), as well as between alternating brain state changes assessed by SWA and cortical activation (Act) seen in ECoG (lights on: P = 0.1075; lights off: P = 0.3293). C, exemplary block of recording of a different ISO neuron (see firing rate histogram; bin: 1 s) in LGN displaying gamma oscillatory activity seen as the HDP of ISIs (HDP; see instantaneous frequency plot) that responds to transient light stimulation (yellow bars). After the prolonged period of darkness (>30 min), light was turned on. D, ISI histograms show that the fundamental frequency of the HDP is altered by the sustained ambient light changes only in a transient manner (ISI created from 200 s recording after light change; in red) and returns to control values. Note that characteristics of the ISO pattern are changed by light in a sustained fashion. For all ISI histograms, bins equal 0.001 s; for firing histograms, bins equal 1 s. Yellow boxes at recordings and plots indicate lights on conditions. [Color figure can be viewed at http://wileyonlinelibrary.com]
Retinal dependence of the HDP in the LGN
As previously established, the ISO pattern is dependent on the retinal activity and intraocular injections of TTX that abolish rhythmic firing recorded in subcortical visual structures (Lewandowski & Blasiak, 2004; Szkudlarek et al. 2008). In the present study, we wanted to determine the retinal dependency of the HDP and also confirm previous observations concerning ISO. Therefore, when recording ISO activity in 17 LGN neurons, injections of TTX (5 μL) to the contralateral eye were performed. In all LGN neurons recorded, ISO activity was diminished after the retinal blockage. Seven recorded neurons were also characterized by a harmonic discharge pattern and, in all cases, after TTX injection, we observed the disappearance of the HDP. To further explore this observation, we performed simultaneous, bilateral recordings of LGN neurons displaying both a HDP and ISOs (for a detailed description of all double recordings, see below). During this protocol, TTX was sequentially injected into both eyes (injections were separated by at least 30 min) in three rats. Again, the blockage disrupted both ISO and HDP on the side contralateral to the intraocular injection (n = 3), although there were no alterations in any of the activity patterns of neurons in the ipsilateral LGN (n = 5, as a result of double unit recordings) (Fig. 7).
Figure 7. Dependence of the HDP recorded in LGN on retinal activity in the contralateral eye.

Above: exemplary simultaneous recording of two ISO neurons expressing a HDP in two contralaterally located LGNs, presented as firing histograms (bin: 1 s) with corresponding instantaneous frequency plots. Injection of TTX to the left eye (left, 5 μL) evoked disruption of the ISO pattern and disappearance of the HDP in the right LGN but not at the left side. Note the deficiency of conspicuous banding in the instantaneous frequency plot after retinal blockage. Second injection of TTX to the right eye (right, 5 μL) resulted in the disappearance of both the ISO pattern and HDP in the left LGN. Below: ISI histograms (bins: 0.001 s) created from three time ranges: before, after first and after second intraocular injection. Note that, after relative contralateral retinal blockages, the HDP‐expressing neuron in the left LGN changed its ISI distribution towards unimodal, whereas the cell recorded in right LGN changed towards random spiking.
Gamma oscillation is not present in the LGN in vitro
The hypothesis that the HDP is not an intrinsic pattern created by thalamic cells (analogously to ISO) was strengthened by our in vitro extracellular recordings. Because previous in vitro recordings of IGL neurons (Blasiak & Lewandowski, 2004) did not indicate the presence of a HDP and the DLG neurons are quiet in the slice preparation (based on our personal observations), we studied the firing pattern of VLG cells. In 50 neurons recorded from six rats, no HDP‐exhibiting cells were found. A detailed ISI description of VLG cells recorded in vitro is provided in Fig. 8.
Figure 8. In vitro extracellular recordings of VLG neurons.

A, neurons classified as regular expressed a stable firing rate and contiguous narrow band of one frequency in the instantaneous frequency plot. B, ISI histograms of regular cells were characterized by a single, sharp peak. Accordingly, the autocorrelograms exhibited a high amplitude modulation with multiple peaks. C, a portion of VLG cells fired in the tonic non‐regular manner, which can be seen in the firing histogram and as a broad band of instantaneous frequencies. D, ISI histograms of non‐regular cells were unimodal but much broader than in case of regular neurons. A lack of regularities was also apparent in autocorrelograms. E, the last type of neuron was classified as phasic as a result of the eruptive activity seen in the firing histograms. These cells were the most irregularly spiking, which could be seen in the instantaneous frequency plots (E), ISI histograms and autocorrelograms (F). G, the division of VLG neurons into presented classes was performed in accordance with Young's regularity criterion (Young et al. 1988); units for which the coefficient of variation (Cv) for spike intervals did not exceed 0.35 were classified as regular (in dark grey). Note that phasic neurons (in red) were characterized by the highest values of Cv amongst other non‐regular units (in light grey). H, the firing rate of regular cells was significantly higher compared to both non‐regular (* P = 0.0244, Dunn's test) and phasic ones (* P = 0.0470, Dunn's test). I, half of the recorded neurons were classified as regular (n = 25/50), 16 as non‐regular and nine as phasic. Note that no neurons displaying a HDP were found under in vitro conditions. Bins in frequency histograms equal 1 s; for ISI histograms and autocorrelograms, bins equal 0.001 s. [Color figure can be viewed at http://wileyonlinelibrary.com]
Synchronization of gamma oscillation between ipsilateral but not contralateral structures
Previous studies have shown that ISO neurons receiving inputs from the same eye (recorded on the ipsilateral side; e.g. in IGL and OPN) show synchronized activity, whereas the ISO pattern is not synchronized between the contralateral LGNs (Lewandowski et al. 2002; Szkudlarek et al. 2012). To address the issue of neuronal synchronization in the gamma frequency range, we performed 12 simultaneous single‐unit recordings of ISO neurons in the LGN and OPN receiving inputs from the same eye, in five rats. First, we found that a HDP was also observed in the firing of OPN neurons characterized by ISOs (Fig. 9 Aa). Second, we observed that fundamental frequencies of the HDP did not vary between recorded pairs of neurons (i.e. one neuron from the LGN and one from the OPN). This observation was supported by a similarity between ISI histograms (Fig. 9 Ab and Ac) and autocorrelograms (Fig. 9 Ae and Af) of ipsilateral cells. Additionally, the HDP was highly synchronized within recorded pairs of neurons, both under lights on and lights off conditions (Fig. 9 Ad and Ag).
Figure 9. Synchronization of the HDP on the ipsi‐ but not contralateral side.

Aa, exemplary traces of two simultaneously recorded ISO neurons expressing HDP in the OPN (in red) and LGN (in grey) localized at the ipsilateral side, presented as firing histograms (bin: 1 s) and instantaneous frequency plots. Note that the ISO pattern is synchronized between recorded units. The same fundamental frequency of HDP can be assessed from ISI histograms (Ab and Ae) and merged autocorrelograms (Ac and Af). Ad and Ag, cross‐correlations between recorded cells show the synchrony in the firing at the level of HDP. Ba, exemplary recording of two ISO neurons exhibiting HDP in two contralaterally located LGNs (dark grey: left LGN; light grey: right LGN), shown as firing histograms (bin: 1 s) and instantaneous frequency plots. Note that the ISO pattern is not synchronized between recorded units because it shows different periods. ISI histogram indicating the same fundamental frequency of HDP between two recorded neurons (Bb and Be), which is also visible in the strikingly similar merged autocorrelograms (Bc and Bf). Bd and Bg, cross‐correlograms show no synchronization of firing at the level of the HDP between contralaterally located LGN neurons. Yellow boxes indicate lights on conditions, including all recording plots, ISI histograms and correlograms. Bins in all ISI histograms and correlograms equal 0.001 s. [Color figure can be viewed at http://wileyonlinelibrary.com]
In the next step, we performed bilateral paired recordings (12 pairs with one cell per side of the brain) of LGN ISO neurons exhibiting a HDP (five rats) (Fig. 9 Ba). Similar to ipsilateral recordings, we found that fundamental frequencies of the HDPs in the two LGNs were very similar, if not the same. The resemblance of ISI histograms and autocorrelograms between two bilateral cells recorded simultaneously was strong under both lights on conditions and in darkness (Fig. 9 Bb, Bc, Be and Bf). However, an analysis of cross‐correlation revealed a lack of synchronization between HDP‐induced firing in LGNs located on opposite sides of the brain (Fig. 9 Bd and Bg).
The last set of experiments aimed to investigate synchronization in the gamma frequency range within the network of a single LGN. Therefore, we performed four multisite recordings by placing a 32‐channel microelectrode array in the LGN of three rats. In total, 76 neurons localized in the LGN were successfully recorded (on average, 19 units were isolated per single recording; range: 7–39) and ISI histograms were plotted for each individual unit (Fig. 10 A and B). Fifty‐seven out of 76 cells (75%) responded to contralateral eye illumination and 39 (68%; 51% of total) of those cells exhibited an ISO pattern. A HDP was found in 35 light‐responsive cells (61%) and many (but not all) of the units showing harmonic bands in ISI histograms were also characterized by an ISO pattern (n = 24/35, 69%) (Fig. 10 D). Interestingly, one ISO neuron was not sensitive to contralateral eye stimulation through light and displayed a different period compared to all other ISO units that were recorded simultaneously (putative ipsilateral retinal innervation). The described neuron expressed a HDP at a common fundamental frequency (Fig. 10 B), although its firing was not synchronized with all other HDP‐displaying units (Fig. 10 C). All other neurons that were recorded in a particular session fired in a synchronized manner at both infra‐slow and gamma frequency levels. Neurons that were insensitive to contralateral eye illumination did not express ISO or HDP (except for one ‘putative ipsilateral’ cell, as described above). Similar observations were made for OPN recordings from two Wistar rats (Fig. 11).
Figure 10. At the area of one LGN, neurons expressing a HDP innervated by the same eye fire at synchrony.
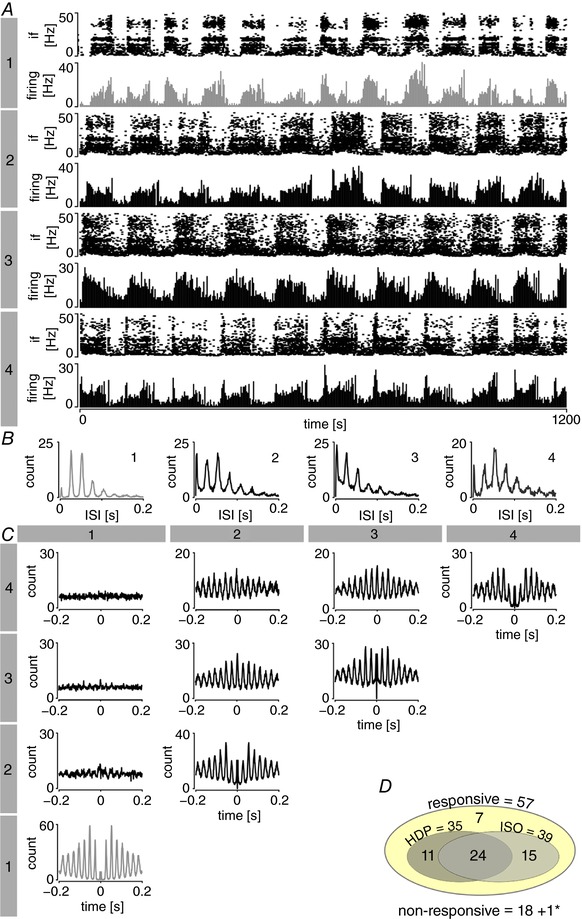
A, exemplary traces of four ISO neurons displaying a HDP recorded by the 32‐channel electrode located in LGN, shown as firing histograms (bin: 1 s) and corresponding instantaneous frequency (If) plots. Neurons numbered 2–4 (in dark grey) exhibited synchronized ISO activity and responded to contralateral eye stimulation by light. Unit no. 1 (in light grey) also displayed an ISO pattern but of a different period and this was not sensitive to contralateral eye illumination (putatively innervated by ipsilateral retina). B, ISI histograms show harmonic bands of a common fundamental frequency for all of the cells shown. C, correlation matrix (bins: 0.001 s) indicates that HDP‐expressing neurons no. 2–4 are synchronized within one LGN (innervated by the same retina) but do not fire in synchrony with unit no. 1. D, characteristics of neurons recorded in LGN in all multichannel experiments, responsive to contralateral eye illumination (yellow oval). Only one non‐responsive neuron (marked with an asterisk) expressed both ISO and HDP (shown as unit no. 1 in A). Note that the ISO pattern and HDP in LGN are strongly interconnected. [Color figure can be viewed at http://wileyonlinelibrary.com]
Figure 11. Synchronous firing of HDP‐expressing neurons in OPN.

A, exemplary raw traces of three ISO neurons displaying a HDP recorded by the 32‐channel electrode located in OPN, shown as firing histograms (bin: 1 s; in red) and corresponding instantaneous frequency (If) plots. Note that all recorded neurons exhibited synchronized ISO activity. B, ISI histograms show harmonic bands of a common fundamental frequency for all of the cells shown. C, correlation matrix (bins: 0.001 s) indicates that HDP‐expressing neurons are synchronized within one OPN. Autocorrelation is shown in red, whereas cross‐correlograms are shown in black. D, characteristics of 30 neurons recorded in OPN in two multichannel experiments. Twenty‐six units were responsive to contralateral eye illumination (yellow oval); four remained non‐responsive. Among light‐responsive neurons, 17 were characterized by an ISO pattern. Nine ISO neurons were further classified as HDP‐expressing units. Note that only one recorded OPN neuron expressed HDP but not ISO. [Color figure can be viewed at http://wileyonlinelibrary.com]
Discussion
Infra‐slow oscillatory neurons in the LGN form a heterogeneous population that integrates multiple rhythms
Until now, ISO neurons in the respective nuclei of the subcortical visual system were considered to be homogenous populations of neurons sharing a common retinal input that drives rhythmic, oscillatory changes through their firing rate. Infra‐slow oscillations were described, both in awake and in anaesthetized rats, in the level of neuronal firing in the LGN, OPN and SCN, as well as in the diameter of the pupil (Miller & Fuller, 1992; Albrecht & Gabriel, 1994; Albrecht et al. 1998; Lewandowski et al. 2000, 2002; Lewandowski & Blasiak, 2004; Filippov and Frolov, 2005; Szkudlarek et al. 2008, 2012; Blasiak et al. 2013; Blasiak & Lewandowski, 2013; Orlowska‐Feuer et al. 2016a, b ; Chrobok et al. 2017b). It has been shown that ISO can interfere with much slower rhythms of sleep‐like brain state alternations induced by urethane anaesthesia (Clement et al. 2009) and the result of this interference can be observed as complex oscillations in the pupil area (Blasiak et al. 2013). The results of the present study show that ISO neurons in the LGN (especially the DLG and VLG) may integrate those two oscillatory signals at the level of the thalamus. Amplitude (but not frequency) of the ISO rhythm differs between alternating brain states (i.e. higher amplitude during activation compared to the slow‐wave phase). This outcome suggests that rhythmically changing brainstem output does not influence the putative driver of the ISO rhythm (retina) but acts upon LGN neurons, which correlates with the anatomical data (Takatsuji & Tohyama, 1989; Kolmac & Mitrofanis, 2000).
However, a recent report on the SCN showed that ISO neurons may possess other oscillatory properties in a higher frequency range (Tsuji et al. 2016). Therefore, in the present study, we focused not only on the characterization of the firing properties of ISO neurons by studying the mean frequency of firing in discrete periods of time (1 s bins), but also on ISIs and their distributions.
Therefore, we divided ISO neurons in the LGN according to their regularity of firing with the use of Young's criterion (Young et al. 1988). A striking minority of LGN cells in vivo were classified as generating action potentials in a regular manner. However, the irregularity of spike generation, which is a dominant observation in vivo, stems from synaptic inputs rather than from intrinsic features because regular firing is much more common in vitro (IGL: Blasiak & Lewandowski, 2004; VLG: the results of the present study). Another firing property of ISO neurons in the LGN is the ability to generate bursts of spikes, which can be depicted as a distinct peak occurring at short ISIs <4 ms in the ISI distribution. Bursting is an intrinsic feature of thalamic neurons that is plausibly a result of the activation of T‐type calcium conductance and is expressed in the DLG, IGL and VLG (Zhu & Lytton, 1999; Ling et al. 2012; Chrobok et al. 2016a). However, the most intriguing observation concerned a group of ISO neurons for which firing was characterized by the multimodal distribution of ISIs and distinct modes located at intervals indicating harmonics with a fundamental frequency close to 35 Hz.
Distinct firing properties of ISO neurons in the LGN can be a result of different innervation by various types of retinal ganglion cells that happen to fire in synchrony in the infra‐slow time scale. Another explanation may be the intrinsic firing features of LGN neurons or a dependency on non‐retinal inputs but with retinal ISO superimposed on it.
HDP as a fast oscillation in the gamma frequency range
Firing of almost half of the recorded ISO neurons was characterized by the HDP of ISIs. The fundamental frequency of the HDP indicated low gamma oscillation (Buzsaki & Wang, 2012). This firing pattern was dependent on retinal activity and vanished after injection of TTX to the contralateral eye but not the ipsilateral eye. Therefore, recorded rhythm is putatively a fingerprint of rhythmic excitatory drive from retinal axons. In cats, retinal‐driven high frequency gamma oscillation was previously found to evoke oscillatory activity in the LGN (Koepsell et al. 2009). We cannot be sure that the HDP recorded in the present study corresponds to high gamma oscillations found in cats (Arnett, 1975; Munemori et al. 1984; Neuenschwander and Singer, 1996; Koepsell et al. 2009; Ito et al. 2010), although it is tempting to speculate that the HDP in the LGN and OPN share the same origin as that reported in the SCN (Tsuji et al. 2016) because they have similar characteristics. This speculation may be strengthened by the results of a recent study showing gamma band oscillatory activity of ∼60 Hz in the DLG of an awake mouse in contrast to ∼40 Hz oscillation in an anaesthetized mouse (Storchi et al. 2017).
Slower brain rhythms are known to bind large neuronal domains and facilitate the precise timing of higher frequency oscillations (Buzsaki & Draguhn, 2004). Our results show that manifestation of LGN gamma oscillations, which appeared as the HDP observed in the neuronal firing, is gated by infra‐slow oscillations that are modulated by rhythmic brain state alternations. During the cortical slow‐wave activity, the neuronal firing of ISO neurons in subcortical visual structures is very sparse during the extrabursts; therefore, in these phases, the retinal gamma cannot be relayed to higher‐order structures. This effect is further potentiated in darkness, when the intraburst length is lowered, which results in shorter time periods for gamma transmission. By contrast, during cortical activation, under the lights on conditions, the intrabursts of the ongoing ISO are longer and the neuronal activity of brain state‐modulated neurons is higher even in extrabursts, which facilitates a stronger expression of gamma frequency band in terms of the rhythmic firing of subcortical visual neurons.
Therefore, the results of the present study show that firing of a subpopulation of neurons in the LGN is governed by oscillations from two distant frequency bands: infra‐slow and gamma. Phase‐locking of gamma oscillations within the theta rhythm has been well‐studied in the hippocampus in which 7 ± 2 gamma cycles are present in one theta phase (Jensen & Colgin, 2007). Gamma oscillations were also described with different frequency range rhythms, including infra‐slow ones (Leopold et al. 2003; Buzsaki & Wang, 2012).
Modulation by light and retinal origin of infra‐slow and gamma oscillations
The results of the present study demonstrate that the infra‐slow oscillation‐ and gamma oscillation‐driven HDPs in neuronal firing are differentially modulated by lighting conditions. Both phenomena differ from each other in terms of temporal stability of light‐induced modulation and the direction of the observed frequency shift. ISO rhythm was found to decrease its frequency in response to light and this effect was stationary. In Wistar rats, this was true for the DLG and VLG, whereas no observation could be made in the IGL, which has diminished oscillatory activity in darkness. This effect may be a result of the potent GABAergic network within the IGL itself and/or strong afferent inhibitory inputs to the IGL that allow ISOs to break through only when there is strong light stimulation (Lewandowski et al. 2000; Lewandowski & Blasiak, 2004; Blasiak et al. 2006; Chrobok et al. 2017b). The increase in ISO frequency in darkness was noted previously in the SCN (Miller & Fuller, 1992), OPN (Szkudlarek et al. 2012) and IGL of an epilepsy model: WAG/Rij rats (where the putative disinhibition of IGL network was observed and the ISO activity in this structure was also recorded in darkness) (Chrobok et al. 2017b). Previous studies showed that ISO in the DLG is exclusively present under lights off conditions (Albrecht et al. 1998). Our results supplement those observations with a population of DLG neurons that maintained a stable ISO pattern under both dark and lights on conditions. Because tonic neurons were not the focus of the present study, and all of the recordings reported here were initiated when the light was turned on, we were unable to identify any DLG units that switched their firing pattern from tonic to oscillatory in darkness.
By contrast, the results of the present study show that the fundamental frequency of the HDP increases only transiently in response to light pulses and then remains stable at the basal level during prolonged light stimulation. The amplitude of an observed transient increase in fundamental frequency was light intensity‐dependent. Similarly, high gamma frequency oscillations found in cat and mouse DLG were reported to be modulated by the background light intensity (cat: Laufer and Verzeano, 1967; mouse: Storchi et al. 2017). Interestingly, stimulus intensity coding by the HDP was also previously found in the thermoreceptive cells of shark ampullae of Lorenzini that display a strikingly similar rhythm in the gamma frequency range, which is also seen as a multimodal ISI histogram (Braun et al. 1994). A recent study by Saleem et al. (2017) reported a gamma frequency oscillation (∼60 Hz) in the mouse visual cortex that was putatively derived from LGN activity and was sensitive to changes in light intensity. Therefore, it can be hypothesized that the HDP‐induced firing of LGN neurons observed in the present study may lead to neurotransmitter release in the target areas with a gamma frequency pattern. In turn, subcortical visual structures may constitute a relay for the sensory channel encoded in gamma band oscillation for further image and non‐image forming visual functions.
Contrasting results for HDP light dependency were obtained from the SCN. In a small population of SCN neurons, the HDP was exclusively recorded under lights on or lights off conditions (Tsuji et al. 2016). In the experimental conditions of the present study, HDP control over the firing of LGN and OPN neurons was persistent regardless of the light conditions. This discrepancy may not stem from the retinal driver but from differences in local network functions. A possible candidate for HDP modulation is the electrical coupling between SCN neurons via gap junctions (Long et al. 2005) that was not found in the LGN or OPN. Our previous whole‐cell patch clamp studies on DLG, IGL and VLG neurons also suggested that electrical synapses do not function in the LGN because the diffusion of biocytin from the intrapipette solution was never found to embrace neighbouring neurons (Palus et al. 2015, 2016; Chrobok et al. 2016a, b , 2017a, b ). Also, the slight decrease in HDP frequency in darkness (the shift of multimodal interval distribution peaks towards longer intervals) was previously reported in recordings from rat retinal ganglion cell axons (Freeman et al. 2008). However, no information on the time scale of this phenomenon was provided.
Not all of the ISO neurons in the LGN and OPN show a HDP and, conversely, the firing levels of some but not all HDP‐expressing neurons oscillate in the infra‐slow band. In the present study, we show that those two rhythms, which are plausibly driven from the retina, overlap in some parts of the subcortical visual system but were separated in other parts (as seen previously in the SCN) (Tsuji et al. 2016). This observation, along with the fact that ISO and HDP are differentially influenced by light stimulation (in terms of direction of change and their kinetics), supports the hypothesis of two distinct retinal drivers. The question of the dependence of two rhythms on the specific retinal cell type remains open. The classical study by Heiss and Bornschein (1966) shows that the firing of retinal ganglion cells is not always oscillatory and may also be characterized by unimodal ISI plots. This observation is in agreement with our results showing that gamma frequency oscillation governs the firing of a subset of retinorecipient LGN neurons, whereas the activity of others is stationary at this time scale. In cat LGN, high gamma oscillatory activity was found irrespective of receptive field properties or laminar position (Ito et al. 2010), which is similar to the present study showing that the expression of a HDP was not confined to any particular type of visual response.
The neuronal origin of ISO in the retina remains unknown. Previous observations from our laboratory suggest that the ISO is dependent on the activity of retinal neurons because it was abolished by an intraocular TTX injection (Lewandowski & Blasiak, 2004; Szkudlarek et al. 2008). This infra‐slow oscillation can also be disrupted by the synaptic imbalance caused by blockage of excitatory transmission, or synchronicity distortion by the gap junction blockage (Orlowska‐Feuer et al. 2016a, b ). As a result of the putative extensive synchronization of retinal output, which can be seen in the synchronization of contralateral subcortical visual neurons (Szkudlarek et al. 2012), the most plausible candidates for driving the infra‐slow rhythm are the non‐vertical retinal connections. Also, in the present study, we have shown that ISO neurons display various types of responses (both ON and OFF), which enables us to speculate that the ISO pattern is not generated by a specific type of retinal ganglion cell.
Studies of the frog retina provide a possible explanation of the gamma oscillation origin and mechanism of its generation (Ishikane et al. 1999; Arai et al. 2004). Most probably, the oscillation underlying the HDP is generated by the amacrine cells of the inner retina. The mechanism described involves rhythmic activation of GABAA receptors, which are putatively located in the reciprocal synapses at the terminals of bipolar cells (frog: Arai et al. 2004; rat: Hartveit, 1999). In mice, it was suggested that amacrine cells oscillate as a result of the pulsatile release of glutamate from bipolar cells, and this oscillatory activity is calcium‐dependent (Petit‐Jacques et al. 2005; Petit‐Jacques & Bloomfield, 2008). The putative involvement of amacrine cells in the generation of fast oscillations in the rat optic tract was hypothesized previously (Freeman et al. 2008). This gamma frequency oscillation might be powerfully synchronized between amacrine cells through extensive electrical coupling via gap junctions (Demb & Singer, 2012; Hartveit & Veruki, 2012) and can be modulated by light‐dependent excitatory inputs from bipolar cells (Petit‐Jacques & Bloomfield, 2008). This hypothesis was confirmed by recent studies conducted on mouse retinas that showed a dependence of gamma oscillation, as recorded from retinal ganglion cells, on the electrical coupling among amacrine cells (Roy et al. 2017).
Synchronization of rhythmic spiking in the subcortical visual system
Infra‐slow oscillations observed in the nuclei of the subcortical visual system display intrahemispheric but not interhemispheric synchronization and, in each hemisphere, the ISOs have significantly different periods (Lewandowski et al. 2002; Szkudlarek et al. 2008). This observation was confirmed by our study in which the ISO pattern was synchronized between the ipsilateral IGL and OPN but not contralateral LGNs. As expected, we also observed that multiple neurons recorded simultaneously in one nucleus exhibit synchronization at the level of ISO. However, this general rule is true only for neurons that are innervated from the same retina, which is usually contralateral. It has been shown that LGN cells sensitive to illumination of the ipsilateral eye can also be found, although this comprises a very small population (Harrington, 1997). We have shown that, in these rare circumstances for neurons (i.e. innervated from the ipsilateral eye), there is a lack of synchronization between a synchronously firing, dominant population of neurons innervated from the contralateral eye.
In cases of oscillatory activity in gamma range, our observations concerning synchronicity are similar. Neurons expressing a HDP fired in synchrony between ipsilateral subcortical visual structures and within one nucleus. Again, this was true only when recorded neurons were innervated by the retina of the same, usually contralateral, eye. As noted above, ISOs generated by two different retinas are characterized by different periods (Lewandowski et al. 2002; Szkudlarek et al. 2008). By contrast, HDPs observed simultaneously in both hemispheres were characterized by a strikingly similar fundamental frequency. Nevertheless, flat interhemispheric cross‐correlation suggests that bilateral gamma oscillations underlying the observed HDP are not synchronized in phase. That result strongly suggests that there are two independent retinal drivers (in each of two eyes) that oscillate at a similar frequency. Similar results were reported previously by Neuenschwander and Singer (1996) in a study on the anaesthetized cat, demonstrating that oscillatory activity in the high gamma range is synchronous only for the LGN layers receiving inputs from the same eye. However, the results of the present study were based on the cross‐correlation of spontaneous rate, in contrast to those that analysed the oscillatory responses to the visual stimuli. To separate the effect of stimulus from the intrinsic synchronicity of neural pathway, the so‐called ‘shift predictor’ procedure was used. Flat shift‐predictor controls indicated that the studied gamma oscillations were not phase‐locked to stimulus onset of offset but rather resulted from horizontal interactions in the retina (Neuenschwander & Singer, 1996; Storchi et al. 2017).
The results reported in the present study show a variation in the HDP fundamental frequency between studied cells; however, multiple recordings made from one individual did not differ significantly in cases of gamma oscillation frequency. This observation is similar to previous reports from the SCN (Tsuji et al. 2016). Conservation of oscillation frequency is characteristic not only for gamma rhythm, but also for many oscillation bands encountered in vertebrate brains (Buzsaki et al. 2013).
The synchronized activity of neurons over long distances can serve a variety of neurophysiological functions, including information processing, transfer and storage (Buzsaki & Draguhn, 2004). In cases of ISO synchronization in the subcortical visual system, it has been hypothesized previously that the subcortical visual system has a role in circadian entrainment and other non‐image forming functions (Miller & Fuller, 1992; Lewandowski & Blasiak, 2004; Szkudlarek et al. 2012). However, the presence of rhythm in DLG may suggest the physiological relevance of ISO activity for image‐forming vision. Neuronal synchronization in the gamma frequency range is considered to indicate cortical processing; however, it remains an open question whether cortical and retinal gamma frequencies are physiologically parallel phenomena (Buzsaki & Draguhn, 2004; Buzsaki & Wang, 2012). Recent reports indicate that at least some of the cortical gamma (narrowband gamma oscillation) ranges may be a direct result of subcortical drive, unlike broadband gamma activity, which is independent of the sensory input (Saleem et al. 2017).
In the image‐forming visual system, oscillatory activities were assumed to establish relationships amongst distributed responses, which is crucial for distinguishing between an object and its background (Singer et al. 1997). Synchrony in the gamma frequency band is probably not involved in the representation of object features exclusively because it has been observed in the nuclei that serve non‐image forming visual functions (i.e. the IGL, VLG, OPN and SCN). Furthermore, studies in frogs indicate that the synchronized oscillatory activity of the retina (which presumably corresponds to the HDP in rat LGN) enables the escape behaviour elicited by a large shadow that mimics a predator, although it does not play a role in small object recognition (Ishikane et al. 2005). This functional hypothesis was strengthened by the results of a recent study in mice showing that retinal gamma encodes information critical for global object recognition (Ito et al. 2010), which also comprises relevant information for non‐image forming functions and reflexes.
The synchrony in the gamma frequency range may also serve a function in the augmentation of weak synaptic inputs. It has been shown that the tight synchrony of synaptic inputs may greatly enhance postsynaptic responses (Alonso et al. 1996; Bruno & Sakmann, 2006). Accordingly, the greater the synchrony (i.e. as set by oscillatory activities), the greater the gain in information (Dan et al. 1998). This possible mechanism may function in the thalamocortical network, whereas cortical neurons can act as finely tuned detectors of coincident synaptic input (Azouz & Gray, 2000, 2003, 2008), as well as in the subcortical visual system itself, as a result of the extensive connectivity amongst its elements (Morin & Blanchard, 1998; Morin, 2013). However, the importance of different frequency oscillatory patterns with respect to the firing of neurons in the nuclei of the subcortical visual system requires further detailed study.
Summary and conclusions
The results of the present study indicate that gamma oscillation of a putative retinal origin synchronously patterns neuronal firing in the subcortical visual system. Furthermore, a gamma rhythm was found to be present both under lights on conditions and in darkness, and it was time‐locked to ongoing infra‐slow oscillation. Parameters of infra‐slow oscillations were altered by sustained changes in the lighting conditions, whereas the gamma oscillation‐driven pattern of firing was resistant to the long‐term alteration of illuminance. By contrast, transient changes in the light intensity were coded by the fundamental frequency of the harmonic discharge pattern. The present study shows that neurophysiological oscillations characterized by frequencies varying in magnitude not only coexist in the subcortical visual system, but also are subjected to complex interference and synchronization processes.
Additional information
Competing interests
The authors declare that they have no competing financial interests.
Author contributions
LC, KP‐C and JSJ‐L conceived the project. LC, KP‐C, JSJ‐L, TB and MHL contributed to the design of experiments. LC and KP‐C performed single‐channel experiments. LC, JSJ‐L and KP‐C analysed and interpreted single‐channel experiments. LC and JSJ‐L performed multichannel experiments with help from TB. LC and TB analysed and interpreted multichannel recordings. LC wrote the paper with the help from TB and all authors revised the manuscript critically and approved the final version submitted for publication.
Funding
The study was supported by the Ministry of Science and Higher Education project ‘Diamentowy grant III’ No. 0001/DIA/2014/43, 2014–2017 and the research grant for PhD students No. K/DSC/004644, 2017–2018 obtained from Institute of Zoology and Biomedical Research, Jagiellonian University in Krakow. LC was additionally supported by the Polish National Science Centre doctoral scholarship ‘Etiuda IV’ 2016/20/T/NZ4/00273. The authors declare that they have no competing financial interests.
Acknowledgements
We thank Kamil Zajac (MSc, AGH University of Science and Technology, Krakow, Poland) for help with the preparation of MATLAB scripts for the analysis of the ISO pattern.
Biography
Lukasz Chrobok received his PhD in Biology from the Jagiellonian University in Krakow, Poland, in October 2017, having investigated the effects of orexins on the rat lateral geniculate nucleus and its pathophysiology in the absence of epilepsy. Prior to this, he undertook a Bachelor of Science degree in Neurobiology at the Jagiellonian University in Krakow. Currently, he is a visiting post‐doctoral fellow at the University of Manchester, UK. His research interests include the subcortical visual system and oscillatory processes at different time‐scales.

Edited by: Ian Forsythe & Diego Contreras
Contributor Information
Lukasz Chrobok, Email: lukasz.chrobok@uj.edu.pl.
Marian Henryk Lewandowski, Email: marian.lewandowski@uj.edu.pl.
References
- Albrecht D & Gabriel S (1994). Very slow oscillations of activity in geniculate neurons of urethane‐anaesthetised rats. NeuroReport 5, 1909–1912. [DOI] [PubMed] [Google Scholar]
- Albrecht D, Royl G & Kaneoke Y (1998). Very slow oscillatory activities in lateral geniculate neurons of freely moving and anaesthetised rats. Neurosci Res 32, 209–220. [DOI] [PubMed] [Google Scholar]
- Alonso JM, Usrey WM & Reid RC (1996). Precisely correlated firing in cells of the lateral geniculate nucleus. Nature 383, 815–819. [DOI] [PubMed] [Google Scholar]
- Arai I, Yamada Y, Asaka T & Tachibana M (2004). Light‐evoked oscillatory discharges in retinal ganglion cells are generated by rhythmic synaptic inputs. J Neurophysiol 92, 715–725. [DOI] [PubMed] [Google Scholar]
- Arnett DW (1975). Correlation analysis of units recorded in the cat dorsal lateral geniculate nucleus. Exp Brain Res 24, 111–130. [DOI] [PubMed] [Google Scholar]
- Ascoli D & Maffei L (1964). Slow periodicity in the dark discharge of retinal units. Experientia (Basel) 20, 226–227. [DOI] [PubMed] [Google Scholar]
- Azouz R & Gray CM (2000). Dynamic spike threshold reveals a mechanism for synaptic coincidence detection in cortical neurons in vivo. Proc Natl Acad Sci USA 97, 8110–8115. [DOI] [PMC free article] [PubMed] [Google Scholar]
- Azouz R & Gray CM (2003). Adaptive coincidence detection and dynamic gain control in visual cortical neurons in vivo. Neuron 37, 513–523. [DOI] [PubMed] [Google Scholar]
- Azouz R & Gray CM (2008). Stimulus selective spiking is driven by the relative timing of synchronous excitation and disinhibition in cat striate neurons in vivo. Eur J Neurosci 28, 1286–1300. [DOI] [PubMed] [Google Scholar]
- Blasiak A & Lewandowski MH (2004). In vitro extracellular recording of spontaneous activity of the intergeniculate leaflet neurons. Brain Res 1015, 82–86. [DOI] [PubMed] [Google Scholar]
- Blasiak T & Lewandowski MH (2013). Differential firing pattern and response to lighting conditions of rat intergeniculate leaflet neurons projecting to suprachiasmatic nucleus or contralateral intergeniculate leaflet. Neuroscience 228, 315–324. [DOI] [PubMed] [Google Scholar]
- Blasiak T, Siejka S, Raison S, Pevet P & Lewandowski MH (2006). The serotonergic inhibition of slowly bursting cells in the intergeniculate leaflet of the rat. Eur J Neurosci 24, 2769–2780. [DOI] [PubMed] [Google Scholar]
- Blasiak T, Zawadzki A & Lewandowski MH (2013). Infra‐slow oscillation (ISO) of the pupil size of urethane‐anaesthetised rats. PLoS ONE 8, e62430. [DOI] [PMC free article] [PubMed] [Google Scholar]
- Braun HA, Wissing H, Schafer K & Hirsch MC (1994). Oscillation and noise determine signal transduction in shark multimodal sensory cells. Nature 367, 270–273. [DOI] [PubMed] [Google Scholar]
- Bruno RM & Sakmann B (2006). Cortex is driven by weak but synchronous active thalamocortical synapses. Science 312, 1622–1627. [DOI] [PubMed] [Google Scholar]
- Buzsaki G (2006). Rhythms of the Brain. New York, NY: Oxford University Press. [Google Scholar]
- Buzsaki G & Chrobak JJ (1995). Temporal structure in spatially organized neuronal ensembles: a role for interneuronal networks. Curr Opin Neurobiol 5, 504–510. [DOI] [PubMed] [Google Scholar]
- Buzsaki G & Draguhn A (2004). Neuronal oscillations in cortical networks. Science 304, 1926–1929. [DOI] [PubMed] [Google Scholar]
- Buzsaki G & Wang XJ (2012). Mechanisms of gamma oscillations. Annu Rev Neurosci 35, 203–225. [DOI] [PMC free article] [PubMed] [Google Scholar]
- Buzsaki G, Logothetis N & Singer W (2013). Scaling brain size, keeping timing: evolutionary preservation of brain rhythms. Neuron 80, 751–764. [DOI] [PMC free article] [PubMed] [Google Scholar]
- Canolty RT, Edwards E, Dalal SS, Soltani M, Nagarajan SS, Kirsch HE, Berger MS, Barbaro NM & Knight RT (2006). High gamma power is phase‐locked to theta oscillations in human neocortex. Science 313, 1626–1628. [DOI] [PMC free article] [PubMed] [Google Scholar]
- Chrobok L, Palus K & Lewandowski MH (2016a). Two distinct subpopulations of neurons in the thalamic intergeniculate leaflet identified by subthreshold currents. Neuroscience 329, 306–317. [DOI] [PubMed] [Google Scholar]
- Chrobok L, Palus K & Lewandowski MH (2016b). Orexins excite ventrolateral geniculate nucleus neurons predominantly via OX2 receptors. Neuropharmacology 103, 236–246. [DOI] [PubMed] [Google Scholar]
- Chrobok L, Palus K, Chrzanowska A, Kepczynski M & Lewandowski MH (2017a). Multiple excitatory actions of orexins upon thalamo‐cortical neurons in dorsal lateral geniculate nucleus – implications for vision modulation by arousal. Sci Rep 7, 7713. [DOI] [PMC free article] [PubMed] [Google Scholar]
- Chrobok L, Palus K, Jeczmien‐Lazur JS, Chrzanowska A, Kepczynski M & Lewandowski MH (2017b). Disinhibition of the intergeniculate leaflet network in the WAG/Rij rat model of absence epilepsy. Exp Neurol 289, 103–116. [DOI] [PubMed] [Google Scholar]
- Clement EA, Richard A, Thwaites M, Ailon J, Peters S & Dickson CT (2008). Cyclic and sleep‐like spontaneous alternations of brain state under urethane anaesthesia. PLoS ONE 3, e2004. [DOI] [PMC free article] [PubMed] [Google Scholar]
- Crook J & Lovick T (2016). Urodynamic function during sleep‐like brain states in urethane anesthetized rats. Neuroscience 313, 73–82. [DOI] [PMC free article] [PubMed] [Google Scholar]
- Dan Y, Alonso JM, Usrey WM & Reid RC (1998). Coding of visual information by precisely correlated spikes in the LGN. Nat Neurosci 1, 501–7. [DOI] [PubMed] [Google Scholar]
- Demb JB & Singer JH (2012). Intrinsic properties and functional circuitry of the AII amacrine cell. Vis Neurosci 29, 51–60. [DOI] [PMC free article] [PubMed] [Google Scholar]
- Devonshire IM, Grandy TH, Dommett EJ & Greenfield SA (2010). Effects of urethane anaesthesia on sensory processing in the rat barrel cortex revealed by combined optical imaging and electrophysiology. Eur J Neurosci 32, 786–97. [DOI] [PubMed] [Google Scholar]
- Filippov IV & Frolov VA (2005). Very slow potentials in the lateral geniculate complex and primary visual cortex during different illumination changes in freely moving rats. Neurosci Lett 373, 51–56. [DOI] [PubMed] [Google Scholar]
- Freeman DK, Heine WF & Passaglia CL (2008). The maintained discharge of rat retinal ganglion cells. Vis Neurosci 25, 535–548. [DOI] [PMC free article] [PubMed] [Google Scholar]
- Gollisch T & Meister M (2008). Rapid neural coding in the retina with relative spike latencies. Science 319, 1108–1111. [DOI] [PubMed] [Google Scholar]
- Harrington ME (1997). The ventral lateral geniculate nucleus and the intergeniculate leaflet: interrelated structures in the visual and circadian systems. Neurosci Biobehav Rev 21, 705–727. [DOI] [PubMed] [Google Scholar]
- Hartveit E (1999). Reciprocal synaptic interactions between rod bipolar cells and amacrine cells in the rat retina. J Neurophysiol 81, 2923–2936. [DOI] [PubMed] [Google Scholar]
- Hartveit E & Veruki ML (2012). Electrical synapses between AII amacrine cells in the retina: Function and modulation. Brain Res 1487, 160–172. [DOI] [PubMed] [Google Scholar]
- Heiss WD & Bornschein H (1966). Multimodale Intervallhistogramme der Daueraktivitat von retinalen Neuronen der Katze. Kybernetik 3, 187–191. [DOI] [PubMed] [Google Scholar]
- Ishikane H, Gangi M, Honda S & Tachibana M (2005). Synchronized retinal oscillations encode essential information for escape behavior in frogs. Nat Neurosci 8, 1087–1095. [DOI] [PubMed] [Google Scholar]
- Ishikane H, Kawana A & Tachibana M (1999). Short‐ and long‐range synchronous activities in dimming detectors of the frog retina. Vis Neurosci 16, 1001–1014. [DOI] [PubMed] [Google Scholar]
- Ito H, Maldonado PE & Gray CM (2010). Dynamics of stimulus‐evoked spike timing correlations in the cat lateral geniculate nucleus. J Neurophysiol 104, 3276–3292. [DOI] [PubMed] [Google Scholar]
- Jensen O & Colgin L (2007). Cross‐frequency coupling between neuronal oscillations. Trends Cogn Sci 11, 267–269. [DOI] [PubMed] [Google Scholar]
- Koepsell K, Wang X, Vaingankar V, Wei Y, Wang Q, Rathbun DL, Usrey WM, Hirsch JA & Sommer FT, et al (2009). Retinal oscillations carry visual information to cortex. Front Syst Neurosci 3, 1–18. [DOI] [PMC free article] [PubMed] [Google Scholar]
- Kolmac C & Mitrofanis J (2000). Organization of brain stem afferents to the ventral lateral geniculate nucleus of rats. Vis Neurosci 17, 313–318. [DOI] [PubMed] [Google Scholar]
- Laufer M & Verzeano M (1967). Periodic activity in the visual system of the cat. Vision Res 7, 215–229. [DOI] [PubMed] [Google Scholar]
- Leopold D, Murayama Y & Logothetis N (2003). Very slow activity fluctuations in monkey visual cortex: implications for functional brain imaging. Cereb Cortex 13, 422–433. [DOI] [PubMed] [Google Scholar]
- Lewandowski MH & Blasiak T (2004). Slow oscillation circuit of the intergeniculate leaflet. Acta Neurobiol Exp (Wars) 64, 277–288. [DOI] [PubMed] [Google Scholar]
- Lewandowski MH, Blasiak T & Blasiak A (2002). Are ultra‐slow isoperiodic oscillations in rat intergeniculate leaflet neurons dependent on reciprocal connection with its contralaterally located counterpart? Neurosci Lett 330, 243–246. [DOI] [PubMed] [Google Scholar]
- Lewandowski MH, Blasiak T, Domoslawski J & Wolkowska A (2000). Ultradian rhythmic neuronal oscillation in the intergeniculate leaflet. NeuroReport 11, 317–321. [DOI] [PubMed] [Google Scholar]
- Ling C, Hendrickson ML & Kalil RE (2012). Morphology, classification, and distribution of the projection neurons in the dorsal lateral geniculate nucleus of the rat. PLoS ONE 7:e49161. [DOI] [PMC free article] [PubMed] [Google Scholar]
- Long MA, Jutras MJ, Connors BW & Burwell RD (2005). Electrical synapses coordinate activity in the suprachiasmatic nucleus. Nat Neurosci 8, 61–66. [DOI] [PubMed] [Google Scholar]
- Miller JD & Fuller CA (1992). Isoperiodic neuronal activity in suprachiasmatic nucleus of the rat. Am J Physiol 263, 51–58. [DOI] [PubMed] [Google Scholar]
- Morin LP (2013). Neuroanatomy of the extended circadian rhythm system. Exp Neurol 243, 4–20. [DOI] [PMC free article] [PubMed] [Google Scholar]
- Morin LP & Blanchard JH (1998). Interconnections among nuclei of the subcortical visual shell: the intergeniculate leaflet is a major constituent of the hamster subcortical visual system. J Comp Neurol 396, 288–309. [PubMed] [Google Scholar]
- Munemori J, Hara K, Kimura M & Sato R (1984). Statistical features of impulse trains in cat's lateral geniculate neurons. Biol Cybern 50, 167–172. [DOI] [PubMed] [Google Scholar]
- Neuenschwander S & Singer W (1996). Long‐range synchronization of oscillatory light responses in the cat retina and lateral geniculate nucleus. Nature 379, 728–733. [DOI] [PubMed] [Google Scholar]
- Orlowska‐Feuer P, Allen AE, Storchi R, Szkudlarek HJ & Lewandowski MH (2016a). The contribution of inner and outer retinal photoreceptors to infra‐slow oscillations in the rat olivary pretectal nucleus. Eur J Neurosci 43, 823–833. [DOI] [PubMed] [Google Scholar]
- Orlowska‐Feuer P, Jeczmien‐Lazur JS, Szkudlarek H & Lewandowski MH (2016b). Retinal gap junctions are involved in rhythmogenesis of neuronal activity at remote locations – study on infra‐slow oscillations in the rat olivary pretectal nucleus. Neuroscience 339, 150–161. [DOI] [PubMed] [Google Scholar]
- Pagliardini S, Greer JJ, Funk GD & Dickson CT (2012). State‐dependent modulation of breathing in urethane‐anesthetized rats. J Neurosci 32, 11259–11270. [DOI] [PMC free article] [PubMed] [Google Scholar]
- Pagliardini S, Funk GD & Dickson CT (2013a). Breathing and brain state: urethane anesthesia as a model for natural sleep. Respir Physiol Neurobiol 188, 324–332. [DOI] [PubMed] [Google Scholar]
- Pagliardini S, Gosgnach S & Dickson CT (2013b). Spontaneous sleep‐like brain state alternations and breathing characteristics in urethane anesthetized mice. PLoS ONE 8:e70411. [DOI] [PMC free article] [PubMed] [Google Scholar]
- Palus K, Chrobok L & Lewandowski MH (2015). Orexins/Hypocretins modulate the activity of NPY‐positive and –negative neurons in the rat intergeniculate leaflet via OX1 and OX2 receptors. Neuroscience 300, 370–380. [DOI] [PubMed] [Google Scholar]
- Palus K, Chrobok L, Kepczynski M & Lewandowski MH (2016). Enkephalin and neuropeptide‐Y interaction in the intergeniculate leaflet network, a part of the mammalian biological clock. Neuroscience 343, 10–20. [DOI] [PubMed] [Google Scholar]
- Paxinos G & Watson C. (2007) The Rat Brain in Stereotaxic Coordinates. Amsterdam: Elsevier. [DOI] [PubMed] [Google Scholar]
- Petit‐Jacques J & Blooomfield SA (2008). Synaptic regulation of the light‐dependent oscillatory currents in starburst amacrine cells of the mouse retina. J Neurophysiol 100, 993–1006. [DOI] [PMC free article] [PubMed] [Google Scholar]
- Petit‐Jacques J, Volgyi B, Rudy B & Blooomfield SA (2005). Spontaneous oscillatory activity of starburst amacrine cells in the mouse retina. J Neurophysiol 94, 1770–1780. [DOI] [PubMed] [Google Scholar]
- Rodieck RW (1967). Maintained activity of cat retinal ganglion cells. J Neurophysiol 30, 1043–1071. [DOI] [PubMed] [Google Scholar]
- Roy K, Kumar S & Bloomfield SA (2017). Gap junctional coupling between retinal amacrine and ganglion cells underlies coherent activity integral to global object perception. Proc Natl Acad Sci USA 114, E10484–E10493. [DOI] [PMC free article] [PubMed] [Google Scholar]
- Saleem AB, Lien AD, Krumin M, Haider B, Roson MR, Ayaz A, Reinhold K, Busse L, Carandin M & Harris KD (2017). Subcortical source and modulation of the narrowband gamma oscillation in mouse visual cortex. Neuron 93, 315–322. [DOI] [PMC free article] [PubMed] [Google Scholar]
- Schroeder CE & Lakatos P (2009). Low‐frequency neuronal oscillations as instruments of sensory selection. Trends Neurosci 32, 9–18. [DOI] [PMC free article] [PubMed] [Google Scholar]
- Sherman SM (2005). Thalamic relays and cortical functioning. Prog Brain Res 149, 107–126. [DOI] [PubMed] [Google Scholar]
- Sherman SM & Guillery RW (2002). The role of the thalamus in the flow of information to the cortex. Philos Trans R Soc Lond B Biol Sci 357, 1695–1708. [DOI] [PMC free article] [PubMed] [Google Scholar]
- Singer W, Engel AK, Kreiter AK, Munk MH, Neuenschwander S & Roelfsema PR (1997). Neuronal assemblies: Necessity, signature and detectability. Trends Cogn Sci 1, 252–261. [DOI] [PubMed] [Google Scholar]
- Sirota A, Montgomery S, Fujisawa S, Isomura Y, Zugaro M & Buzsaki G (2008). Entrainment of neocortical neurons and gamma oscillations by the hippocampal theta rhythm. Neuron 60, 683–697. [DOI] [PMC free article] [PubMed] [Google Scholar]
- Storchi R, Bedford RA, Martial FP, Allen AE, Wynne J, Montemurro MA, Petersen RS & Lucas RJ (2017). Modulation of fast narrowband oscillations in the mouse retina and dLGN according to background light intensity. Neuron 93, 299–307. [DOI] [PubMed] [Google Scholar]
- Szkudlarek H, Orlowska P & Lewandowski MH (2012). Light‐induced responses of slow oscillatory neurons of the rat olivary pretectal nucleus. PLoS ONE 7:e33083. [DOI] [PMC free article] [PubMed] [Google Scholar]
- Szkudlarek HJ, Herdzina O & Lewandowski MH (2008). Ultra‐slow oscillatory neuronal activity in the rat olivary pretectal nucleus: comparison with oscillations within the intergeniculate leaflet. Eur J Neurosci 27, 2657–2664. [DOI] [PubMed] [Google Scholar]
- Takatsuji K & Tohyama M (1989). The organization of the rat lateral geniculate body by immunohistochemical analysis of neuroactive substances. Brain Res 480, 198–209. [DOI] [PubMed] [Google Scholar]
- Tsuji T, Tsuji C, Ludwig M & Leng G (2016). The rat suprachiasmatic nucleus: the master clock ticks at 30 Hz. J Physiol 594, 3629–3650. [DOI] [PMC free article] [PubMed] [Google Scholar]
- Walczak M & Blasiak T (2017). Midbrain dopaminergic neuron activity across alternating brain states of urethane anaesthetized rat. Eur J Neurosci 45, 1068–1077. [DOI] [PubMed] [Google Scholar]
- White JA, Banks MI, Pearce RA & Kopell NJ (2000). Networks of interneurons with fast and slow gamma‐aminobutyric acid type A (GABAA) kinetics provide substrate for mixed gamma‐theta rhythm. Proc Natl Acad Sci USA 97, 8128–8133. [DOI] [PMC free article] [PubMed] [Google Scholar]
- Whitten TA, Martz LJ, Guico A, Gervais N & Dickson CT (2009). Heat synch: inter‐ and independence of body‐temperature fluctuations and brain‐state alternations in urethane‐anesthetized rats. J Neurophysiol 102, 1647–1656. [DOI] [PubMed] [Google Scholar]
- Young ED, Robert JM & Shofner WP (1988). Regularity and latency of units in ventral cochlear nucleus: implications for unit classification and generation of response properties. J Neurophysiol 60, 1–29. [DOI] [PubMed] [Google Scholar]
- Zhu J & Lytton W (1999). An intrinsic oscillation in interneurons of the rat lateral geniculate nucleus. J Neurophysiol 81, 702–711. [DOI] [PubMed] [Google Scholar]