

Abstract
Key points
Strategies to enhance the loss of fat while preserving muscle mass during energy restriction are of great importance to prevent sarcopenia in overweight older adults.
We show for the first time that the integrated rate of synthesis of numerous individual contractile, cytosolic and mitochondrial skeletal muscle proteins was increased by resistance training (RT) and unaffected by dietary protein intake pattern during energy restriction in free‐living, obese older men.
We observed a correlation between the synthetic rates of skeletal muscle‐derived proteins obtained in serum (creatine kinase M‐type, carbonic anhydrase 3) and the synthetic rates of proteins obtained via muscle sampling; and that the synthesis rates of these proteins in serum revealed the stimulatory effects of RT.
These results have ramifications for understanding the influence of RT on skeletal muscle and are consistent with the role of RT in maintaining muscle protein synthesis and potentially supporting muscle mass preservation during weight loss.
Abstract
We determined how the pattern of protein intake and resistance training (RT) influenced longer‐term (2 weeks) integrated myofibrillar protein synthesis (MyoPS) during energy restriction (ER). MyoPS and proteome kinetics were measured during 2 weeks of ER alone and 2 weeks of ER plus RT (ER + RT) in overweight/obese older men. Participants were randomized to consume dietary protein in a balanced (BAL: 25% daily protein per meal × 4 meals) or skewed (SKEW: 7:17:72:4% daily protein per meal) pattern (n = 10 per group). Participants ingested deuterated water during the consecutive 2‐week periods, and skeletal muscle biopsies and serum were obtained at the beginning and conclusion of ER and ER + RT. Bulk MyoPS (i.e. synthesis of the myofibrillar protein sub‐fraction) and the synthetic rates of numerous individual skeletal muscle proteins were quantified. Bulk MyoPS was not affected by protein distribution during ER or ER + RT (ER: BAL = 1.24 ± 0.31%/day, SKEW = 1.26 ± 0.37%/day; ER + RT: BAL = 1.64 ± 0.48%/day, SKEW = 1.52 ± 0.66%/day) but was ∼26% higher during ER + RT than during ER (P = 0.023). The synthetic rates of 175 of 190 contractile, cytosolic and mitochondrial skeletal muscle proteins, as well as synthesis of muscle‐derived proteins measured in serum, creatine kinase M‐type (CK‐M) and carbonic anhydrase 3 (CA‐3), were higher during ER + RT than during ER (P < 0.05). In addition, the synthetic rates of CK‐M and CA‐3 measured in serum correlated with the synthetic rates of proteins obtained via muscle sampling (P < 0.05). This study provides novel data on the skeletal muscle adaptations to RT and dietary protein distribution.
Keywords: aging, muscle protein synthesis, proteome dynamics
Key points
Strategies to enhance the loss of fat while preserving muscle mass during energy restriction are of great importance to prevent sarcopenia in overweight older adults.
We show for the first time that the integrated rate of synthesis of numerous individual contractile, cytosolic and mitochondrial skeletal muscle proteins was increased by resistance training (RT) and unaffected by dietary protein intake pattern during energy restriction in free‐living, obese older men.
We observed a correlation between the synthetic rates of skeletal muscle‐derived proteins obtained in serum (creatine kinase M‐type, carbonic anhydrase 3) and the synthetic rates of proteins obtained via muscle sampling; and that the synthesis rates of these proteins in serum revealed the stimulatory effects of RT.
These results have ramifications for understanding the influence of RT on skeletal muscle and are consistent with the role of RT in maintaining muscle protein synthesis and potentially supporting muscle mass preservation during weight loss.
Introduction
Sarcopenia, the progressive loss of skeletal muscle mass with age, is associated with a decline in strength and functional capacity, and increased risk for numerous adverse health and quality of life‐based outcomes (Janssen et al. 2004; Landi et al. 2013). Sarcopenia is often concomitant with obesity in older adults (Diouf et al. 2010; Flegal et al. 2012; Gutierrez‐Fisac et al. 2012; Parr et al. 2013). In older adults obesity is associated with increased risk for comorbidities (Nicklas et al. 2006; Rossi et al. 2008; Mathus‐Vliegen, 2012) and exacerbates age‐related functional decline and disability risk (Vasquez et al. 2014), particularly when superimposed on sarcopenia (Baumgartner et al. 2004; Chung et al. 2013). The recommendation of weight loss in overweight older adults remains somewhat controversial (Waters et al. 2013), primarily due to concerns that dietary energy restriction (ER) interventions designed to reduce excess adiposity may simultaneously accelerate muscle loss (Bouchonville & Villareal, 2013; Waters et al. 2013).
Both ageing (Moore et al. 2015) and ER (Hector et al. 2015) have been shown to attenuate the acute muscle protein synthetic response to protein feeding. We reported that during ER in overweight and obese older men a balanced distribution of dietary protein ingestion more effectively stimulated myofibrillar protein synthesis (MyoPS) versus a skewed distribution (Murphy et al. 2015). Furthermore, we showed that combining resistance training (RT) with a balanced protein distribution restored the reduced rates of MyoPS during ER to those observed during energy balance (EB). These data suggest that the combination of RT and a balanced distribution of daily protein during ER may represent an effective strategy to slow or abate muscle loss during weight loss in older adults. Nevertheless, the short‐term (11 h) nature of the MyoPS measurements in that study (Murphy et al. 2015) restricted our ability to extrapolate these findings because they do not account for all of the integrated aspects of daily activity and diet over time. To overcome this limitation, we simultaneously administered oral deuterated water (D2O) to the participants in our previous study (Murphy et al. 2015). This represents a more powerful approach to determine muscle protein synthesis (MPS) over longer periods of time (weeks or longer) and, using recently developed methods combining D2O ingestion with tandem‐mass spectrometric proteomic analyses, permits the measurement of the synthetic rates of a large number of individual skeletal muscle proteins (Price et al. 2012; Scalzo et al. 2014). Such methodology can capture the time‐integrated responses of skeletal muscle protein synthesis across the proteome, including numerous myofibrillar, sarcoplasmic and mitochondrial proteins, to an intervention among free‐living participants, thereby providing unique insight into skeletal muscle adaptations. We have recently extended this approach to measure the synthetic rate of skeletal muscle‐synthesized proteins that escape into circulation such as creatine kinase M‐type (CK‐M) and carbonic anhydrase (CA‐3) (Shankaran et al. 2016a). The underlying concept is that the synthetic rates of blood‐borne proteins that were synthesized in skeletal muscle can provide a minimally invasive biomarker of MPS (Shankaran et al. 2016a) and, if successful, could have implications for the diagnosis, clinical management and monitoring of musculoskeletal diseases.
The purpose of the current study was to examine the interaction between daily protein distribution and RT on the longer‐term, integrated rate of bulk MyoPS (i.e. synthesis of the myofibrillar protein sub‐fraction) and on the synthetic rates of individual skeletal muscle proteins in the setting of ER. The study design comprised 2 weeks of ER alone and 2 weeks of ER + RT, combined with either a skewed or balanced dietary protein intake pattern, in the overweight and obese older men who took part in our previous study (Murphy et al. 2015). Based on our previous findings (Murphy et al. 2015), we hypothesized that a balanced distribution of dietary protein intake throughout the day would stimulate the longer‐term synthesis rate of bulk MyoPS and the synthesis rates of individual myofibrillar skeletal muscle proteins (%/day) to a greater extent than a skewed distribution and that this effect would be enhanced while undertaking RT.
Methods
Ethical approval
This study was approved by the Hamilton Integrated Research Ethics Board and conformed to the standards set by the Declaration of Helsinki, except for registration in a database. Each participant was informed of the purpose of the study, experimental procedures and potential risks before written consent was obtained.
Experimental design
Details regarding the participants and controlled diet and physical activity interventions have been reported previously (Murphy et al. 2015). Briefly, after providing informed, written consent, 20 overweight and obese but generally healthy older men [age 66 ± 4 years, body mass index (BMI) 31 ± 5 kg/m2) underwent a controlled 4‐week hypocaloric diet (1.25 MJ/d less than estimated energy requirements, 1.3 g protein/kg/d from a mixture of plant and animal sources; Fig. 1). Participants were randomly allocated to one of two groups (n = 10 per group) matched for age and BMI: balanced (BAL) or skewed (SKEW). Total protein intake was distributed across four daily meals (breakfast, lunch, dinner, pre‐bed snack) in the proportions 25:25:25:25% in participants in the BAL group and 7:17:72:4% in the SKEW group. In BAL, a ready‐to‐drink whey protein micelle (WPM) beverage (25 g protein; Nestle, Lausanne, Switzerland) was consumed as part of breakfast and as a pre‐bed snack to achieve target protein intakes at these meals. SKEW received their total daily protein intake from food sources only and consumed a protein‐free, low‐energy placebo drink (0.2 g protein; Nestle) matched for appearance, smell and taste to the WPM beverage with breakfast and pre‐bed. The 4‐week intervention consisted of two, 2‐week phases. In weeks 1 and 2 all participants were in energy restriction (Phase 1: ER) and continued their habitual physical activity. In weeks 3 and 4, while still energy restricted, all participants commenced a supervised, whole body, resistance training programme 3 days per week (Phase 2: ER + RT).
Figure 1. Schematic overview of the study design (adapted from Murphy et al. 2015).
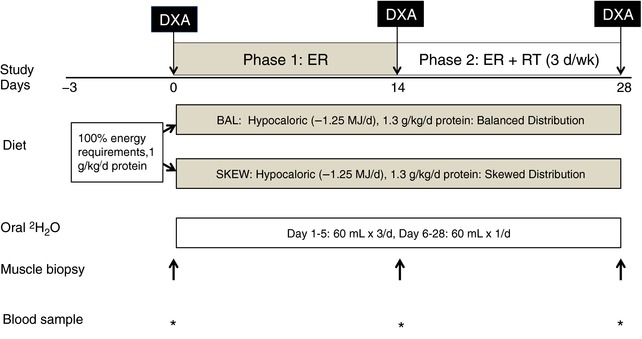
DXA, dual X‐ray absorptiometry; EB, energy balance; ER, energy restriction; ER + RT, energy restriction and resistance training. [Color figure can be viewed at http://wileyonlinelibrary.com]
Stable isotope labelling protocol
Deuterated water (D2O, 2H2O) labelling of newly synthesized skeletal muscle proteins was achieved using daily oral consumption of aliquots of 70% D2O. This commenced on the first day of the ER diet and was continued throughout the 4‐week intervention. A target deuterium (2H) enrichment in total body water of 1–2% was achieved during the first 5 days by intake of 60 mL 70% D2O three times/day ( = 180 mL/day) and was maintained for the remaining 23 days of the intervention by 60 mL/day. All 60 mL doses were separated by at least 3 h. All participants tolerated the D2O dosing protocol well and no one reported side effects (i.e. nausea, vertigo). Total body water 2H enrichment can be used as a surrogate for tissue amino acid labelling (Robinson et al. 2011; Scalzo et al. 2014; Wilkinson et al. 2014) and was determined from saliva swabs collected on alternate days throughout the 4‐week labelling period, as described previously (Neese et al. 2001; Turner et al. 2003). Participants were instructed not to eat or drink for 30 min before saliva sampling and samples were stored at −80°C until analysis. Blood samples and muscle biopsies from the vastus lateralis were obtained on days 0 (baseline), 14 (end of Phase 1: ER; baseline of Phase 2: ER + RT) and 28 (end of Phase 2: ER + RT) (Fig. 1).
Body water enrichment
Enrichment of 2H in saliva was determined using a previously described method (Price et al. 2012). Saliva samples were diluted 1:100 and placed into the caps of inverted sealed screw‐capped vials for overnight distillation at 80°C. Body water 2H enrichments were determined by direct measurement of deuterium molar percentage excess (MPE) in water distilled from the saliva against a D2O standard curve using a laser water isotope analyser (Los Gatos Research, Los Gatos, CA, USA).
Bulk myofibrillar protein synthesis
Myofibrillar‐enriched proteins were isolated as previously described (Moore et al. 2009). Amino acids were liberated by adding 1 m HCl and DOWEX (50WX8‐200 resin, Sigma‐Aldrich, Poole, UK) and heating at 110°C for 72 h, with vortex mixing every 24 h. Free amino acids were purified using DOWEX ion exchange chromatography and converted to their pentafluorobenzyl‐N,N‐di(pentafluorobenzyl)‐NEAA derivatives (PFB derivatives) as described previously (Busch et al. 2006). Gas chromatography mass spectrometry (GCMS) was performed in negative chemical ionization mode with helium as the carrier gas, and mass‐to‐charge (m/z) ratios 424–426 corresponding to the M0, M1 and M2 mass isotopomers of derivatized alanine were analysed by selected ion monitoring.
Excess fractional M + 1 enrichment (EM1) was the normalized change in isotopomer intensity calculated as:
where sample and standard refer to the sample and an unenriched pentafluorobenzyl triacetyl alanine derivative, respectively. The fraction of bulk myofibrillar protein that was newly synthesized during the labelling period (f) was calculated as the ratio of the measured EM1 to the asymptotic value of EM1 (EM1max), the latter representing EM1 in alanine in fully turned‐over proteins at the time‐averaged 2H2O enrichment for each sample and calculated as f = EM1sample/EM1max, as described previously (Busch et al. 2006).
To calculate absolute rates of whole body bulk MyoPS, skeletal muscle mass was estimated according to the model of Kim et al. (2002) using dual energy X‐ray absorptiometry (QDR‐4500A, software version 12.31, Hologic, Bedford, MA, USA) scans obtained at baseline, at the end of Phase 1: ER and at the end of Phase 2: ER + RT. Assuming that muscles are 18% protein and myofibrillar protein accounts for 66% of the total, we calculated whole body bulk MyoPS in g/day as shown by the following equation (Cuthbertson et al. 2005): absolute rate of bulk MyoPS (g/day) = [(muscle mass (kg) × proportion of myofibrillar protein per kg muscle) × myofibrillar fractional synthetic rate (FSR) (%/day)] × 1000.
SDS‐PAGE fractionation, Coomassie blue staining and in‐gel trypsin digestion of muscle proteins for analysis of skeletal muscle proteome dynamics
Muscle samples were processed as described previously (Shankaran et al. 2016a). Briefly, samples were thawed and homogenized for 75 s in PBS containing 1 mm phenylmethylsulfonyl fluoride (PMSF) and 5 mm EDTA using a Mini‐BeadBeater 8 (BioSpec, Bartlesville, OK, USA) placed on ice for 1 min. This procedure was repeated twice and the resulting homogenate was diluted to 10% (w/v) in PBS containing 1 mm PMSF. Protein from prepared homogenates was uniformly reduced by incubation in 10 mm DTT and SDS‐PAGE sample loading buffer for 5 min at 95°C. The reduced samples were then alkylated by incubating in 15 mm iodoacetamide for 1 h at room temperature. Proteins were then fractionated by SDS‐PAGE (BioRad, Hercules, CA, USA). The gel bands corresponding to 10 discrete molecular weight regions were excised from Coomassie blue–stained gels and digested overnight with trypsin (Proteomics Grade, Sigma‐Aldrich) at 37°C. The peptides were extracted from the gel, dried and reconstituted in 3% acetonitrile/0.1% formic acid for LC/MS analysis.
Immunoprecipitation of CK‐M and CA‐3 from serum, and in‐solution trypsin digestion
Plasma samples were processed as described previously (Shankaran et al. 2016a). Briefly, CK‐M and CA‐3 were immunoprecipitated from 2 mL human serum using 20 μg of goat anti‐CK‐M polyclonal antibody (CalBioreagents, P195; Foster City, CA, USA) and 20 μg of goat anti‐CA‐3 polyclonal antibody (R&D Systems, AF2185; Minneapolis, MN, USA) conjugated to 1 mg epoxy Dynabeads (Invitrogen, Carlsbad, CA, USA). Samples were incubated for 60 min at room temperature, and the bound CK‐M and CA‐3 were eluted in 30% acetonitrile, 0.5% formic acid (pH ∼2.5), followed by in‐solution trypsin digestion for LC/MS analysis.
LCMS/MS analysis for proteome dynamics
The LC/MS analysis was performed as previously described in detail (Shankaran et al. 2016a). The mass isotopomer distributions of peptides were measured using an Agilent 6520QToF with Chip Nano source (Agilent, Santa Clara, CA, USA). Each sample was injected twice per analysis. Mobile phase for the LC was 3% (v/v) acetonitrile, 0.1% formic acid, in 18 MΩ water (Buffer A) and 95% acetonitrile, 0.1% formic acid in 18 MΩ water (Buffer B). During the first injection, data‐dependent MS–MS fragmentation spectra were collected with the instrument set to collect four MS scans per second with up to six MS–MS spectra from each scan. MS–MS fragmentation data were analysed using the Agilent software package Spectrum Mill (B0.3) and protein identifications was based on the Uniprot/Swissprot database (August 2010). The kinetic information in the mass isotopomer patterns was extracted from the MS scan data using the Mass Hunter software package (B0.4) from Agilent. The peptide list with calculated neutral mass, elemental formula and retention time was used to filter the observed isotope clusters. A visual basic application was used to calculate peptide elemental composition from lists of peptide sequences and to predict mass isotopomer patterns over a range of precursor body 2H2O enrichments (p) for each peptide, based on the number (n) of C–H positions in the summed amino acids in each peptide that actively incorporate 2H from body water. Fractional synthesis rates of proteins were calculated by deconvoluting the mass isotopomer pattern of newly synthesized peptide species as compared to unlabelled species and, from this, calculating the fraction of newly synthesized peptide present, then ‘rolling up’ the peptides from each protein to calculate the fraction of newly synthesized protein present, as described previously (Price et al. 2012). The time‐averaged D2O exposure measured in each participant was used to calculate fractional synthesis for each protein at each time‐point. For the second 2‐week labelling period (Phase 2: ER + RT), a correction algorithm was applied by subtracting out isotopic label present in each peptide at the end of the first 2‐week labelling period (Phase 1) from both the measured and the maximal labelling possible (i.e. so that the end of the initial labelling period served as a new baseline for rise‐to‐plateau label incorporation), in order for the additional fractional synthesis that occurred during Phase 2 to be determined.
Statistical analyses
All analyses were performed using SPSS (version 22.0, Chicago, IL, USA). Skeletal muscle mass data were analysed using a 2 × 3 (group × time) mixed‐model ANOVA. Bulk MyoPS was analysed using a 2 × 2 (group × phase) mixed‐model ANOVA. Muscle proteome kinetic data were analysed using a 2 × 2 (group × phase) mixed‐model ANOVA; differences were considered significant with a false discovery rate of 0.2 after a Benjamini–Hochberg procedure was performed to adjust for the multiple comparisons. An in‐house data analysis tool that has been developed (Shankaran et al. 2016b) was used to query and statistically analyse ontology terms of human muscle proteins, accessed programmatically from the Database for Annotation, Visualization and Integrated Discovery (DAVID) v6.8. Gene Ontology terms at high stringency of functional annotation clustering were retrieved based on an initial search of the proteins identified in the experimental datasets. The resulting terms were organized by categories (Biological Process, Cellular Component and Molecular Function) and by levels (1 to 5). Duplicate terms within categories occurring at multiple levels were filtered to include only unique ontology terms at the highest level. The mean, median, standard deviation and number of matching proteins were calculated for each ontology term, based on the corresponding proteins from experimental data. Paired two‐tailed t tests with Benjamini–Hochberg multiple test corrections were then used to determine which terms were significantly enriched between experimental groups (corrected P < 0.05). Significant terms were then further filtered by calculating the intersection of matching proteins within each ontology term in the same category and level, removing those terms with a minimum 80% intersection with other term(s), and retaining terms with the highest number of proteins. Pearson correlation analysis was performed to correlate the FSR of CK‐M and CA‐3 in the muscle to that measured in the serum. Statistical significance was accepted at P ≤ 0.05. Results are presented as means ± SD.
Results
Body composition
The change in body composition was reported previously (Murphy et al. 2015). Briefly, a between‐group comparison was not possible due to inadequate power and groups were thus pooled for analysis. Body fat decreased over the intervention (P < 0.001) with no difference between phases (ER: 1.3 ± 0.2 kg, ER + RT 1.1 ± 0.2 kg; P = 0.75). Appendicular skeletal muscle mass (legs and arms) was unchanged in both phases (ER: −0.2 ± 0.8 kg, ER + RT: 0.0 ± 0.7 kg).
Bulk MyoPS rate
Bulk MyoPS (%/day) was similar between the BAL and SKEW groups in both the ER and the ER + RT phases. However, there was a main effect for phase (P = 0.023) such that bulk MyoFSR was higher during ER + RT (BAL 1.64 ± 0.48; SKEW 1.52 ± 0.66%/day) than ER (BAL 1.24 ± 0.31; SKEW 1.26 ± 0.37%/day; Fig. 2 A). Absolute bulk MyoPS (g/day) was also greater during ER + RT (BAL 62 ± 20; SKEW 56 ± 23 g/day) than ER (BAL 47 ± 13; SKEW 47 ± 16 g/day; P = 0.031) with no difference between groups (P = 0.68; Fig. 2 B).
Figure 2. Relative (%/day; A) and absolute (g/day; B) myofibrillar fractional synthetic rate measured using D2O labelling in overweight and obese older men who underwent 2 weeks of energy restriction (Phase 1: ER) and 2 weeks of energy restriction + resistance training (Phase 2: ER + RT) with balanced (BAL) or skewed (SKEW) protein distribution (n = 10 per group).
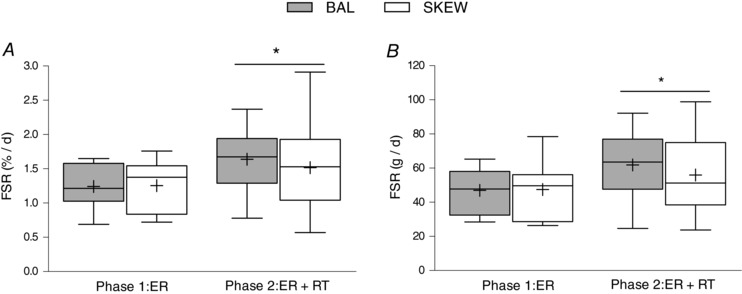
Data were analysed using a two‐factor (group × phase) mixed‐model ANOVA. *Different from Phase 1: ER; P < 0.05. Values are mean ± SD.
Synthesis rates of individual skeletal muscle proteins
FSR data were obtained for 190 individual skeletal muscle proteins that met the criteria of being measured in both ER and ER + RT in at least two participants per group (Table 1). Mean FSRs ranged between 0.2 and 10.8%/day in ER and 0.6 and 5.5%/day in ER + RT (Table 1). FSR increased with RT in 175 of the 190 proteins with no difference between dietary groups (significant with Benjamini–Hochberg correction for multiple comparisons; Table 1). Mixed model ANOVA of FSRs of 68 proteins measured in every subject also revealed that RT increased FSR in 66 of the 68 proteins (significant with Benjamini–Hochberg correction for multiple comparisons) with no difference between dietary groups. Figure 3 shows the FSRs of several of the individual myofibrillar (A), sarcoplasmic (B) and mitochondrial (C) proteins that were responsive to RT.
Table 1.
Fractional synthetic rate (FSR) for 190 individual skeletal muscle proteins during 2 weeks of energy restriction (ER) and 2 weeks of energy plus resistance training (ER + RT)
| BAL Phase 1: ER | SKEW Phase 1: ER | BAL Phase 2: ER + RT | SKEW Phase 2: ER + RT | Benjamini–Hochberg significance | |
|---|---|---|---|---|---|
| Sarcoplasmic endoplasmic reticulum calcium ATPase 1 | 0.98 ± 0.19 (10) | 0.85 ± 0.23 (9) | 2.34 ± 0.71 (10) | 1.87 ± 0.66 (9) | Sig |
| Actin alpha skeletal muscle | 0.17 ± 0.08 (10) | 0.15 ± 0.09 (8) | 0.70 ± 0.18 (10) | 0.63 ± 0.27 (9) | Sig |
| Glycogen phosphorylase muscle form | 0.96 ± 0.18 (10) | 0.71 ± 0.20 (9) | 2.11 ± 0.72 (10) | 1.94 ± 0.73 (9) | Sig |
| Myosin‐2 | 0.65 ± 0.25 (10) | 0.70 ± 0.29 (9) | 1.75 ± 0.44 (10) | 1.60 ± 0.62 (9) | Sig |
| Sarcoplasmic endoplasmic reticulum calcium ATPase 2 | 0.96 ± 0.24 (10) | 0.78 ± 0.15 (9) | 2.45 ± 0.72 (10) | 1.99 ± 0.66 (9) | Sig |
| Myosin‐7 | 0.63 ± 0.31 (10) | 0.80 ± 0.44 (9) | 1.71 ± 0.41 (10) | 1.69 ± 0.72 (9) | Sig |
| Creatine kinase M type | 0.52 ± 0.12 (10) | 0.42 ± 0.12 (9) | 1.23 ± 0.39 (10) | 1.13 ± 0.37 (9) | Sig |
| Serum albumin | 2.55 ± 0.57 (10) | 2.40 ± 0.49 (9) | 4.20 ± 1.26 (10) | 4.28 ± 1.41 (9) | Sig |
| Fructose bisphosphate aldolase A | 0.84 ± 0.14 (10) | 0.71 ± 0.17 (9) | 1.89 ± 0.48 (10) | 1.77 ± 0.48 (9) | Sig |
| Filamin C | 1.71 ± 0.32 (10) | 1.40 ± 0.26 (9) | 3.89 ± 1.37 (10) | 3.68 ±1.40 (9) | Sig |
| Myosin‐1 | 0.58 ± 0.18 (10) | 0.69 ± 0.39 (8) | 1.60 ± 0.43 (10) | 1.46 ± 0.51 (9) | Sig |
| Alpha actinin‐2 | 0.74 ± 0.13 (10) | 0.69 ± 0.14 (9) | 1.37 ± 0.36 (10) | 1.22 ± 0.45 (9) | Sig |
| Myoglobin | 0.58 ± 0.10 (10) | 0.56 ± 0.11 (9) | 0.76 ± 0.30 (10) | 0.69 ± 0.18 (9) | Sig |
| Tropomyosin beta chain | 0.52 ± 0.16 (10) | 0.40 ± 0.10 (9) | 1.37 ± 0.37 (10) | 1.27 ± 0.41 (9) | Sig |
| Myosin‐6 | 0.56 ± 0.32 (10) | 0.64 ± 0.40 (9) | 1.69 ± 0.41 (10) | 1.65 ± 0.72 (9) | Sig |
| Tropomyosin alpha‐1 chain | 0.37 ± 0.16 (10) | 0.31 ± 0.12 (9) | 1.37 ± 0.42 (10) | 1.22 ± 0.39 (9) | Sig |
| Myomesin‐2 | 0.42 ± 0.13 (10) | 0.44 ± 0.14 (8) | 1.40 ± 0.26 (10) | 1.43 ± 0.75 (9) | Sig |
| 6‐Phosphofructokinase, muscle type | 1.39 ± 0.32 (10) | 1.13 ± 0.26 (9) | 3.78 ± 1.54 (10) | 3.32 ± 1.15 (9) | Sig |
| Glycogen debranching enzyme | 0.99 ± 0.11 (10) | 0.74 ± 0.26 (9) | 2.39 ± 0.67 (10) | 2.08 ± 0.70 (9) | Sig |
| ATP synthase subunit beta mitochondrial | 0.72 ± 0.23 (10) | 0.60 ± 0.18 (9) | 2.17 ± 0.80 (10) | 1.84 ± 0.66 (9) | Sig |
| Glyceraldehyde 3 phosphate dehydrogenase | 0.34 ± 0.10 (10) | 0.27 ± 0.14 (9) | 1.62 ± 0.40 (10) | 1.33 ± 0.49 (9) | Sig |
| Beta‐enolase | 0.41 ± 0.11 (10) | 0.36 ± 0.15 (8) | 1.31 ± 0.37 (10) | 1.23 ± 0.43 (9) | Sig |
| Myosin‐4 | 0.63 ± 0.27 (10) | 0.63 ± 0.35 (8) | 1.53 ± 0.44 (10) | 1.43 ± 0.53 (9) | Sig |
| Carbonic anhydrase 3 | 0.28 ± 0.10 (10) | 0.24 ± 0.10 (9) | 1.00 ± 0.39 (10) | 0.86 ± 0.27 (9) | Sig |
| Myosin‐binding protein C slow‐type | 2.49 ± 0.41 (10) | 2.47 ± 0.71 (9) | 5.09 ± 1.23 (10) | 5.15 ± 1.90 (9) | Sig |
| Tropomyosin alpha‐3 chain | 0.69 ± 0.14 (10) | 0.60 ± 0.25 (9) | 1.52 ± 0.38 (10) | 1.48 ± 0.51 (9) | Sig |
| Pyruvate kinase isozymes M1/M2 | 0.69 ± 0.20 (10) | 0.60 ± 0.20 (9) | 2.35 ± 0.93 (10) | 2.00 ± 0.75 (9) | Sig |
| Myosin light chain 1/3 skeletal muscle isoform | 0.27 ± 0.12 (10) | 0.24 ± 0.18 (7) | 0.95 ± 0.34 (10) | 0.85 ± 0.35 (9) | Sig |
| Triosephosphate isomerase | 0.33 ± 0.14 (10) | 0.22 ± 0.11 (9) | 1.24 ± 0.36 (10) | 1.17 ± 0.43 (9) | Sig |
| Haemoglobin subunit beta | 0.79 ± 0.20 (10) | 0.55 ± 0.15 (9) | 1.33 ± 0.28 (10) | 1.26 ± 0.26 (9) | Sig |
| Myosin regulatory light chain 2 skeletal muscle isoform | 0.33 ± 0.14 (10) | 0.31 ± 0.18 (8) | 0.98 ± 0.36 (10) | 0.86 ± 0.31 (9) | Sig |
| Actin alpha cardiac muscle 1 | 0.36 ± 0.08 (10) | 0.25 ± 0.14 (9) | 0.65 ± 0.20 (10) | 0.65 ± 0.26 (9) | Sig |
| Aconitate hydratase, mitochondrial | 0.86 ± 0.26 (10) | 0.72 ± 0.33 (9) | 2.85 ± 0.95 (10) | 2.67 ± 1.07 (9) | Sig |
| Phosphoglucomutase1 | 0.55 ± 0.12 (10) | 0.44 ± 0.18 (9) | 1.52 ± 0.57 (10) | 1.38 ± 0.46 (9) | Sig |
| ATP synthase subunit alpha, mitochondrial | 1.01 ± 0.27 (10) | 0.79 ± 0.29 (9) | 2.56 ± 1.02 (10) | 2.14 ± 0.74 (9) | Sig |
| Troponin C skeletal muscle | 1.76 ± 0.21 (10) | 1.59 ± 0.41 (9) | 3.15 ± 0.87 (10) | 2.84 ± 0.68 (9) | Sig |
| Adenylate kinase isoenzyme 1 | 0.30 ± 0.09 (10) | 0.30 ± 0.1 (9) | 1.44 ± 0.99 (10) | 0.83 ± 0.37 (9) | Sig |
| Creatine kinase S‐type, mitochondrial | 0.62 ± 0.24 (10) | 0.44 ± 0.23 (9) | 2.05 ± 0.71 (10) | 1.72 ± 0.70 (9) | Sig |
| Calsequestrin‐1 | 0.69 ± 0.24 (10) | 0.59 ± 0.26 (9) | 0.85 ± 0.27 (10) | 0.74 ± 0.37 (9) | Sig |
| Glycogen phosphorylase brainform | 0.98 ± 0.22 (10) | 0.71 ± 0.18 (9) | 2.14 ± 0.73 (10) | 1.90 ± 0.68 (9) | Sig |
| Troponin I fast skeletal muscle | 0.95 ± 0.21 (10) | 0.81 ± 0.29 (9) | 1.97 ± 0.51 (10) | 1.76 ± 0.46 (9) | Sig |
| Titin | 2.29 ± 1.12 (7) | 1.57 ± 0.42 (8) | 2.69 ± 0.77 (10) | 2.63 ± 0.83 (9) | Sig |
| Myosin‐8 | 0.65 ± 0.39 (9) | 0.65 ± 0.35 (8) | 1.58 ± 0.46 (10) | 1.47 ± 0.47 (9) | Sig |
| Myosin‐3 | 0.62 ± 0.24 (9) | 0.78 ± 0.64 (9) | 2.02 ± 0.96 (10) | 1.52 ± 0.61 (9) | Sig |
| Phosphoglycerate kinase 1 | 0.26 ± 0.12 (10) | 0.26 ± 0.14 (8) | 1.21 ± 0.58 (10) | 1.05 ± 0.46 (9) | Sig |
| Sarcoplasmic/endoplasmic reticulum calcium ATPase3 | 0.49 ± 0.20 (10) | 0.35 ± 0.15 (9) | 2.23 ± 0.64 (10) | 1.77 ± 0.58 (9) | Sig |
| Myosin regulatory light chain 2, ventricular/cardiac muscle isoform | 1.28 ± 0.52 (10) | 1.08 ± 0.41 (9) | 1.65 ± 0.66 (10) | 1.67 ± 0.79 (9) | Sig |
| Alpha‐crystallin B chain | 1.40 ± 0.32 (10) | 1.08 ± 0.26 (9) | 3.54 ± 1.36 (10) | 3.23 ± 1.05 (9) | Sig |
| Phosphoglycerate mutase 2 | 0.46 ± 0.17 (10) | 0.47 ± 0.17 (9) | 1.28 ± 0.37 (10) | 1.16 ± 0.41 (9) | Sig |
| Four and a half LIM domains protein 1 | 1.23 ± 0.34 (10) | 1.10 ± 0.53 (9) | 2.07 ± 0.67 (10) | 1.55 ± 0.36 (8) | Sig |
| ADP/ATP translocase 1 | 1.06 ± 0.65 (9) | 0.90 ± 0.31 (8) | 2.02 ± 0.53 (10) | 1.76 ± 0.62 (9) | Sig |
| Myosin‐13 | 0.70 ± 0.19 (10) | 0.89 ± 0.84 (9) | 1.50 ± 0.44 (10) | 1.33 ± 0.50 (9) | Sig |
| Troponin T, fast skeletal muscle | 0.75 ± 0.25 (10) | 0.73 ± 0.24 (8) | 2.28 ± 0.76 (10) | 1.86 ± 0.57 (9) | Sig |
| Ryanodine receptor 1 | 2.68 ± 0.9 (9) | 2.10 ± 0.47 (9) | 5.34 ± 1.82 (10) | 3.80 ± 1.19 (9) | Sig |
| Myomesin‐1 | 1.20 ± 0.29 (9) | 1.16 ± 0.39 (9) | 2.38 ± 0.89 (10) | 2.10 ± 0.86 (9) | Sig |
| Phosphatidylethanolamine‐binding protein 1 | 0.34 ± 0.08 (8) | 0.24 ± 0.17 (9) | 1.21 ± 0.48 (10) | 1.07 ± 0.47 (9) | Sig |
| Protein DJ‐1 | 0.41 ± 0.18 (10) | 0.51 ± 0.10 (9) | 1.36 ± 0.91 (10) | 1.11 ± 0.54 (9) | Sig |
| Troponin I, slow skeletal muscle | 2.17 ± 0.63 (10) | 1.92 ± 0.53 (9) | 3.60 ± 1.11 (10) | 3.37 ± 1.09 (9) | Sig |
| Heat shock cognate 71 kDa protein | 1.30 ± 0.23 (10) | 1.10 ± 0.24 (9) | 3.23 ± 1.29 (10) | 2.88 ± 1.17 (9) | Sig |
| Isocitrate dehydrogenase (NADP), mitochondrial | 0.67 ± 0.29 (10) | 0.44 ± 0.33 (9) | 1.87 ± 0.63 (10) | 1.70 ± 0.81 (9) | Sig |
| Heat shock protein beta‐6 | 2.17 ± 0.46 (10) | 1.84 ± 0.39 (9) | 4.95 ± 1.73 (10) | 4.52 ± 1.83 (9) | Sig |
| PDZ and LIM domain protein 3 | 2.49 ± 0.36 (9) | 2.14 ± 0.58 (9) | 4.66 ± 2.51 (10) | 3.44 ± 0.99 (9) | Sig |
| Glucose‐6 phosphate isomerase | 0.31 ± 0.15 (9) | 0.31 ± 0.14 (8) | 1.71 ± 0.70 (10) | 1.33 ± 0.70 (9) | Sig |
| Aspartate aminotransferase, cytoplasmic | 0.50 ± 0.25 (10) | 0.39 ± 0.18 (7) | 1.57 ± 0.34 (10) | 1.51 ± 0.44 (9) | Sig |
| Troponin C slow skeletal and cardiac muscles | 1.92 ± 0.41 (10) | 1.81 ± 0.52 (9) | 3.58 ± 0.95 (10) | 3.37 ± 1.35 (9) | Sig |
| 2‐Oxoglutarate dehydrogenase, mitochondrial | 1.89 ± 0.45 (10) | 1.60 ± 0.71 (9) | 4.98 ± 2.34 (10) | 4.28 ± 1.69 (9) | Sig |
| ATP synthase subunit b, mitochondrial | 0.50 ± 0.35 (9) | 0.45 ± 0.26 (9) | 1.68 ± 0.74 (10) | 1.22 ± 0.63 (9) | Sig |
| Alpha‐actinin‐3 | 0.65 ± 0.17 (10) | 0.55 ± 0.11 (9) | 1.44 ± 0.35 (10) | 1.20 ± 0.55 (9) | Sig |
| Peroxiredoxin‐2 | 0.65 ± 0.20 (10) | 0.53 ± 0.21 (9) | 2.03 ± 0.63 (10) | 1.57 ± 0.49 (9) | Sig |
| Acetyl‐CoA acetyltransferase, mitochondrial | 0.84 ± 0.23 (10) | 0.63 ± 0.29 (9) | 1.88 ± 0.57 (10) | 1.85 ± 0.64 (9) | Sig |
| Cofilin‐2 | 0.79 ± 0.22 (10) | 0.59 ± 0.19 (8) | 2.26 ± 1.40 (10) | 1.83 ± 0.62 (9) | Sig |
| ATP synthase subunit O, mitochondrial | 0.50 ± 0.22 (10) | 0.46 ± 0.16 (9) | 1.36 ± 0.61 (10) | 1.14 ± 0.49 (9) | Sig |
| l‐Lactate dehydrogenase A chain | 0.31 ± 0.19 (10) | 0.24 ± 0.13 (8) | 2.03 ± 0.82 (10) | 1.59 ± 0.85 (9) | Sig |
| Cytochrome b‐c1 complex subunit 2, mitochondrial | 0.87 ± 0.33 (10) | 0.84 ± 0.49 (9) | 1.85 ± 0.53 (10) | 1.80 ± 0.60 (9) | Sig |
| Heat shock protein beta‐1 | 1.00 ± 0.11 (10) | 0.79 ± 0.20 (9) | 3.58 ± 1.72 (10) | 3.11 ± 1.37 (9) | Sig |
| NADH‐ubiquinone oxidoreductase 75 kDa subunit, mitochondrial | 1.64 ± 0.57 (9) | 1.62 ± 0.91 (8) | 5.65 ± 2.22 (10) | 5.40 ± 1.73 (9) | Sig |
| ATP synthase subunit d, mitochondrial | 0.57 ± 0.18 (10) | 0.53 ± 0.24 (9) | 1.72 ± 0.80 (10) | 1.36 ± 0.67 (9) | Sig |
| Transitional endoplasmic reticulum ATPase | 3.35 ± 0.66 (9) | 2.66 ± 0.49 (9) | 8.79 ± 4.05 (10) | 6.65 ± 2.70 (9) | Sig |
| Glutathione S‐transferase Mu 2 | 0.81 ± 0.36 (10) | 0.57 ± 0.25 (9) | 1.12 ± 0.89 (10) | 1.06 ± 0.52 (9) | Sig |
| Heat shock 70 kDa protein 1A/1B | 1.34 ± 0.35 (9) | 1.18 ± 0.25 (9) | 3.08 ± 0.86 (10) | 2.87 ± 1.21 (9) | Sig |
| Fructose‐bisphosphate aldolase C | 0.58 ± 0.20 (10) | 0.52 ± 0.14 (9) | 1.91 ± 0.50 (10) | 1.82 ± 0.68 (9) | Sig |
| Puromycin‐sensitive aminopeptidase | 0.78 ± 0.15 (10) | 0.71 ± 0.39 (9) | 2.36 ± 1.19 (10) | 1.87 ± 0.81 (9) | Sig |
| Aspartate aminotransferase, mitochondrial | 0.52 ± 0.27 (10) | 0.58 ± 0.31 (9) | 1.25 ± 0.40 (10) | 1.25 ± 0.45 (9) | Sig |
| Haemoglobin subunit delta | 0.49 ± 0.25 (10) | 0.50 ± 0.22 (7) | 1.35 ± 0.33 (10) | 1.27 ± 0.48 (9) | Sig |
| Cytochrome c oxidase subunit 4 isoform 1, mitochondrial | 0.69 ± 0.49 (8) | 0.74 ± 0.61 (9) | 2.04 ± 0.94 (10) | 1.84 ± 0.65 (9) | Sig |
| Alpha‐actinin‐1 | 0.90 ± 0.44 (10) | 0.95 ± 0.25 (9) | 1.39 ± 0.42 (10) | 1.25 ± 0.62 (9) | Sig |
| Cytochrome b‐c1 complex subunit 1, mitochondrial | 0.42 ± 0.22 (9) | 0.41 ± 0.27 (7) | 1.98 ± 0.75 (10) | 1.74 ± 0.72 (9) | Sig |
| Malate dehydrogenase, mitochondrial | 0.76 ± 0.2 (9) | 0.54 ± 0.19 (9) | 1.77 ± 1.04 (10) | 1.60 ± 0.82 (9) | Sig |
| Superoxide dismutase (Mn), mitochondrial | 0.75 ± 0.26 (10) | 0.60 ± 0.19 (9) | 2.28 ± 0.78 (10) | 1.65 ± 0.56 (9) | Sig |
| Sarcalumenin | 0.25 ± 0.1 (7) | 0.29 ± 0.17 (6) | 1.92 ± 0.67 (10) | 1.56 ± 0.61 (9) | Sig |
| Desmin | 1.96 ± 0.17 (5) | 1.76 ± 0.69 (2) | 8.68 ± 3.76 (10) | 7.70 ± 2.84 (8) | Sig |
| Vinculin | 1.34 ± 0.32 (10) | 1.28 ± 0.24 (9) | 4.05 ± 1.70 (10) | 3.51 ± 1.58 (9) | Sig |
| Ubiquitin‐like modifier‐activating‐enzyme 1 | 1.44 ± 0.32 (10) | 1.18 ± 0.30 (9) | 3.77 ± 1.58 (10) | 3.02 ± 1.22 (9) | Sig |
| Heat shock protein HSP 90‐beta | 2.14 ± 0.67 (9) | 2.40 ± 1.68 (8) | 15.30 ± 15.88 (10) | 13.36 ± 7.80 (9) | Sig |
| Tripartite motif‐containing protein 72 | 0.83 ± 0.28 (8) | 0.66 ± 0.30 (6) | 3.05 ± 1.35 (10) | 2.77 ± 1.23 (9) | Sig |
| Gamma‐enolase | 0.19 ± 0.08 (8) | 0.25 ± 0.23 (6) | 1.43 ± 0.53 (10) | 1.32 ± 0.58 (9) | Sig |
| Glutathione transferase P | 0.62 ± 0.23 (10) | 0.49 ± 0.12 (9) | 2.22 ± 1.44 (10) | 1.76 ± 0.98 (9) | Sig |
| Very long‐chain specific acyl‐CoA dehydrogenase, mitochondrial | 0.76 ± 0.37 (9) | 0.74 ± 0.29 (8) | 3.81 ± 1.34 (10) | 2.98 ± 1.2 (8) | Sig |
| Heat shock‐related 70 kDa protein 2 | 1.33 ± 0.23 (10) | 1.15 ± 0.23 (9) | 2.99 ± 1.06 (10) | 2.81 ± 1.22 (9) | Sig |
| Alpha‐actinin‐4 | 0.73 ± 0.16 (10) | 0.72 ± 0.20 (9) | 1.32 ± 0.37 (10) | 1.30 ± 0.64 (9) | Sig |
| Mitochondrial inner membrane protein | 0.65 ± 0.2 (7) | 0.58 ± 0.2 (7) | 2.02 ± 0.8 (10) | 1.76 ± 0.76 (9) | Sig |
| Cytochrome b‐c1 complex subunit Rieske, mitochondrial | 0.87 ± 0.25 (9) | 0.95 ± 0.67 (9) | 3.07 ± 1.08 (10) | 3.04 ± 1.44 (9) | Sig |
| Myosin‐binding protein C, fast‐type | 2.12 ± 1.08 (9) | 1.42 ± 0.46 (8) | 4.93 ± 2.92 (10) | 4.24 ± 2.10 (9) | Sig |
| Calcium‐binding mitochondrial carrier protein Aralar1 | 0.66 ± 0.45 (9) | 0.51 ± 0.38 (8) | 2.58 ± 0.94 (10) | 2.08 ± 0.95 (8) | Sig |
| Peroxiredoxin‐1 | 0.96 ± 0.90 (7) | 0.50 ± 0.22 (8) | 2.41 ± 1.55 (10) | 1.99 ± 1.30 (9) | Sig |
| Annexin A6 | 1.12 ± 0.7 (7) | 0.66 ± 0.25 (4) | 4.12 ± 3.44 (10) | 2.68 ± 1.35 (9) | Sig |
| Peroxiredoxin‐6 | 1.25 ± 0.44 (9) | 1.09 ± 0.48 (8) | 2.36 ± 1.34 (10) | 1.59 ± 0.79 (9) | Sig |
| Flavin reductase (NADPH) | 1.12 ± 0.40 (10) | 0.89 ± 0.29 (9) | 1.76 ± 0.65 (10) | 1.69 ± 0.54 (9) | Sig |
| Ig kappa chain C region | 0.84 ± 0.55 (8) | 0.96 ± 0.29 (7) | 3.32 ± 1.15 (10) | 3.75 ± 1.08 (9) | Sig |
| Cytochrome c oxidase subunit 2 | 1.08 ± 0.31 (10) | 0.84 ± 0.38 (9) | 2.13 ± 0.80 (10) | 1.91 ± 0.64 (9) | Sig |
| Thioredoxin‐dependent peroxide reductase mitochondrial | 0.49 ± 0.26 (9) | 0.35 ± 0.19 (9) | 2.60 ± 1.20 (10) | 1.86 ± 0.69 (9) | Sig |
| Protein‐arginine deiminase type‐2 | 0.38 ± 0.32 (4) | 0.56 ± 0.39 (2) | 3.33 ± 2.66 (10) | 2.76 ± 1.34 (9) | Sig |
| Fatty acid‐binding protein, heart | 1.03 ± 0.59 (8) | 0.88 ± 0.60 (8) | 1.60 ± 0.73 (10) | 1.12 ± 0.72 (8) | Sig |
| 14‐3‐3 Protein gamma | 1.60 ± 0.27 (10) | 1.48 ± 0.41 (9) | 3.89 ± 1.32 (10) | 3.54 ± 1.32 (9) | Sig |
| Dihydrolipoyl dehydrogenase, mitochondrial | 1.30 ± 0.29 (9) | 1.11 ± 0.41 (8) | 2.60 ± 1.02 (10) | 2.37 ± 0.87 (9) | Sig |
| Elongation factor 1‐alpha 2 | 2.57 ± 1.90 (6) | 1.82 ± 0.51 (6) | 4.93 ± 2.12 (10) | 3.86 ± 1.42 (8) | Sig |
| Heat shock protein HSP 90‐alpha | 4.41 ± 2.10 (3) | 4.45 ± 0.87 (3) | 10.02 ± 5.20 (10) | 13.56 ± 9.20 (9) | Sig |
| Filamin‐A | 1.24 ± 0.3 (10) | 0.81 ± 0.27 (8) | 4.31 ± 1.86 (10) | 4.22 ± 1.75 (9) | Sig |
| NADH dehydrogenase (ubiquinone) flavoprotein 2, mitochondrial | 1.23 ± 0.43 (9) | 1.27 ± 0.59 (9) | 3.38 ± 1.39 (10) | 3.92 ± 1.64 (9) | Sig |
| Malate dehydrogenase, cytoplasmic | 0.39 ± 0.39 (10) | 0.58 ± 0.7 (8) | 1.47 ± 0.60 (9) | 1.58 ± 0.92 (9) | Sig |
| Kelch‐like protein 41 | 2.20 ± 0.56 (9) | 1.64 ± 0.62 (7) | 5.71 ± 3.22 (10) | 5.28 ± 1.79 (8) | Sig |
| Glycogen starch synthase, muscle | 0.94 ± 0.5 (8) | 1.01 ± 0.43 (9) | 4.14 ± 1.02 (10) | 3.78 ± 1.26 (9) | Sig |
| Dihydrolipoyllysine‐residue acetyltransferase component of pyruvatede dehydrogenase | 0.73 (2) | 0.61 ± 0.38 (4) | 1.28 ± 0.53 (9) | 1.17 ± 0.89 (7) | Sig |
| Elongation factor 2 | 2.16 ± 0.53 (8) | 1.56 ± 0.2 (6) | 5.30 ± 2.17 (8) | 4.39 ± 2.09 (7) | Sig |
| Succinate dehydrogenase (ubiquinone) flavoprotein subunit, mitochondrial | 0.90 ± 0.54 (5) | 1.55 ± 0.84 (3) | 3.06 ± 0.84 (10) | 3.07 ± 1.07 (8) | Sig |
| Fructose‐1,6‐bisphosphatase isozyme 2 | 0.66 ± 0.33 (10) | 0.74 ± 0.3 (8) | 2.78 ± 0.94 (10) | 2.97 ± 1.25 (9) | Sig |
| Cofilin‐1 | 1.01 ± 0.21 (9) | 0.83 ± 0.19 (8) | 3.00 ± 2.54 (10) | 2.32 ± 1.78 (9) | Sig |
| Peptidyl‐prolyl cis‐trans isomerase A | 1.22 ± 0.43 (9) | 1.01 ± 0.50 (8) | 3.09 ± 2.18 (10) | 2.48 ± 1.61 (9) | Sig |
| Leucine rich repeat‐containing protein 20 | 1.98 ± 0.44 (9) | 1.68 ± 0.36 (9) | 2.89 ± 1.02 (10) | 2.65 ± 0.72 (9) | Sig |
| LIM domain‐binding protein 3 | 1.09 ± 0.54 (9) | 1.07 ± 0.51 (9) | 2.58 ± 0.79 (10) | 2.05 ± 0.72 (9) | Sig |
| Glycerol‐3 phosphate dehydrogenase (NAD(+)), cytoplasmic | 0.55 ± 0.11 (5) | 0.41 ± 0.24 (7) | 1.97 ± 0.86 (10) | 1.70 ± 0.90 (9) | Sig |
| Isochorismatase domain‐containing protein 2, mitochondrial | 1.37 ± 0.59 (9) | 1.30 ± 0.63 (8) | 3.38 ± 1.80 (9) | 2.09 ± 0.60 (6) | Sig |
| Myomesin‐3 | 0.53 ± 0.13 (6) | 0.45 ± 0.16 (6) | 1.65 ± 0.73 (10) | 1.13 ± 0.67 (8) | Sig |
| Tubulin alpha‐4A chain | 2.05 ± 0.47 (5) | 1.74 ± 0.68 (3) | 4.54 ± 1.80 (10) | 4.27 ± 2.17 (8) | Sig |
| 1‐4‐3‐3 Protein epsilon | 1.40 ± 0.4 (10) | 1.09 ± 0.49 (9) | 3.89 ± 2.30 (10) | 2.81 ± 1.01 (9) | Sig |
| Troponin T, slow skeletal muscle | 0.81 ± 0.35 (10) | 0.63 ± 0.42 (9) | 2.73 ± 0.96 (10) | 2.44 ± 1.12 (9) | Sig |
| Collagen alpha‐3 (VI) chain | 0.32 ± 0.37 (7) | 0.24 ± 0.17 (3) | 4.86 ± 3.80 (7) | 3.92 ± 4.68 (8) | Sig |
| Carboxymethylenebutenolidase homologue | 0.38 ± 0.21 (9) | 0.34 ± 0.29 (4) | 1.29 ± 0.70 (10) | 1.18 ± 0.84 (8) | Sig |
| Glutathione S‐transferase Mu 1 | 0.90 ± 0.43 (10) | 0.60 ± 0.22 (7) | 1.95 ± 0.78 (10) | 3.22 ± 4.95 (9) | Sig |
| Protein‐l‐isoaspartate (Daspartate) O‐methyltransferase | 0.45 ± 0.15 (8) | 0.21 ± 0.15 (6) | 2.49 ± 0.96 (10) | 1.48 ± 0.44 (7) | Sig |
| Citrate synthase, mitochondrial | 0.76 ± 0.35 (7) | 0.57 ± 0.38 (6) | 1.58 ± 0.88 (10) | 1.23 ± 0.72 (9) | Sig |
| Glutathione S‐transferase Mu 4 | 0.95 ± 0.44 (8) | 0.65 ± 0.30 (7) | 1.95 ± 0.78 (10) | 3.22 ± 4.95 (9) | Sig |
| Cytochrome c oxidase subunit 5A, mitochondrial | 1.14 ± 0.28 (6) | 0.46 ± 0.23 (8) | 2.71 ± 1.14 (7) | 1.80 ± 1.03 (7) | Sig |
| Heat shock protein beta‐7 | 2.72 ± 0.66 (8) | 2.96 ± 1.17 (7) | 8.32 ± 4.21 (10) | 8.44 ± 4.74 (9) | Sig |
| Filamin‐B | 2.10 ± 0.77 (6) | 1.76 ± 0.29 (4) | 4.21 ± 2.06 (10) | 4.23 ± 1.80 (9) | Sig |
| Myc box‐dependent‐interacting protein 1 | 1.33 ± 0.41 (6) | 1.14 ± 0.51 (5) | 4.45 ± 1.51 (8) | 3.67 ± 1.66 (5) | Sig |
| Alpha‐1antitrypsin | 4.72 ± 1.31 (7) | 5.17 ± 0.85 (6) | 12.95 ± 9.90 (9) | 14.30 ± 4.71 (7) | Sig |
| AMP deaminase 1 | 0.77 ± 0.43 (4) | 0.22 ± 0.17 (3) | 1.48 ± 0.87 (9) | 1.58 ± 0.94 (5) | Sig |
| GTP‐binding protein SAR 1b | 3.76 ± 1.21 (9) | 3.19 ± 0.75 (8) | 13.10 ± 12.51 (10) | 8.08 ± 4.60 (8) | Sig |
| Glutathione S‐transferase Mu 3 | 0.57 ± 0.26 (7) | 0.76 ± 0.95 (6) | 1.82 ± 0.66 (8) | 1.15 ± 0.47 (8) | Sig |
| Ferritin heavy chain | 2.04 ± 0.86 (8) | 1.70 ± 0.92 (7) | 5.74 ± 3.09 (10) | 4.74 ± 2.79 (9) | Sig |
| Heat shock protein beta‐2 | 0.80 ± 0.14 (9) | 0.72 ± 0.31 (8) | 1.93 ± 0.85 (10) | 1.33 ± 0.56 (8) | Sig |
| Protein‐cysteine N‐palmitoyltransferase HHAT‐like protein | 0.43 ± 0.18 (7) | 0.50 ± 0.35 (9) | 0.90 ± 0.47 (10) | 1.18 ± 1.10 (7) | Sig |
| Lumican | 2.48 ± 0.62 (5) | 2.22 ± 0.54 (5) | 15.52 ± 11.05 (9) | 7.82 ± 4.32 (6) | Sig |
| Proteasome subunit beta type‐1 | 2.09 ± 0.50 (6) | 1.77 ± 0.35 (6) | 3.99 ± 1.93 (10) | 3.26 ± 1.71 (7) | Sig |
| Cytochrome c1, heme protein, mitochondrial | 0.29 ± 0.15 (5) | 0.41 ± 0.11 (5) | 1.36 ± 0.34 (9) | 1.41 ± 0.65 (7) | Sig |
| Peroxiredoxin‐5, mitochondrial | 1.10 ± 0.45 (3) | 0.66 ± 0.23 (6) | 2.87 ± 1.1 (10) | 2.67 ± 1.12 (9) | Sig |
| 6‐Phosphofructokinase, liver type | 0.94 ± 0.45 (10) | 0.87 ± 0.39 (8) | 2.29 ± 0.88 (9) | 2.09 ± 0.85 (8) | Sig |
| Hexokinase‐1 | 1.15 ± 0.26 (9) | 0.98 ± 0.36 (8) | 3.33 ± 1.32 (9) | 2.83 ± 1.20 (6) | Sig |
| Iggamma‐1 chain C region | 1.51 ± 0.07 (3) | 2.34 ± 0.29 (2) | 3.22 ± 1.29 (9) | 3.54 ± 0.66 (8) | Sig |
| Translationally‐controlled tumour protein | 5.49 ± 2.54 (7) | 3.98 ± 1.25 (8) | 12.74 ± 9.23 (10) | 7.24 ± 3.38 (8) | Sig |
| Dual specificity protein phosphatase 3 | 1.26 ± 0.52 (6) | 0.81 ± 0.48 (8) | 4.62 ± 2.1 (10) | 3.61 ± 1.60 (7) | Sig |
| NADH dehydrogenase (ubiquinone) iron sulfur protein 7 mitochondrial | 2.94 ± 0.64 (8) | 2.77 ± 0.84 (8) | 8.47 ± 8.36 (10) | 5.76 ± 2.10 (8) | Sig |
| Puromycin‐sensitive aminopeptidase‐like protein | 0.46 ± 0.21 (9) | 0.31 ± 0.20 (8) | 2.74 ± 0.85 (7) | 2.13 ± 1.40 (6) | Sig |
| Short‐chain specific acyl‐CoA dehydrogenase, mitochondrial | 1.47 ± 0.36 (5) | 1.46 ± 0.79 (5) | 2.01 ± 0.38 (6) | 2.79 ± 1.44 (8) | Sig |
| Hydroxyacyl‐coenzyme A dehydrogenase, mitochondrial | 0.97 ± 0.11 (6) | 0.58 ± 0.22 (5) | 1.16 ± 0.58 (7) | 0.75 ± 0.33 (6) | Sig |
| Collagen alpha‐1 (VI) chain | 0.70 ± 0.36 (6) | 0.84 ± 0.45 (7) | 4.62 ± 2.93 (9) | 4.13 ± 5.18 (9) | Sig |
| Phosphorylase b kinase regulatory subunit alpha skeletal muscle isoform | 1.20 ± 0.29 (6) | 1.00 ± 0.33 (4) | 3.08 ± 1.1 (7) | 2.66 ± 1.41 (5) | Sig |
| SH3 domain‐binding glutamic acid rich protein | 1.76 ± 0.26 (8) | 1.33 ± 0.33 (8) | 3.32 ± 1.78 (7) | 3.90 ± 2.50 (6) | Sig |
| Pseudouridine‐5′‐monophosphatase | 0.52 ± 0.29 (5) | 0.31 ± 0.04 (3) | 1.70 ± 0.99 (9) | 1.54 ± 0.43 (5) | Sig |
| NADH dehydrogenase (ubiquinone) 1 alpha subcomplex subunit 7 | 2.27 ± 1.15 (6) | 1.23 ± 0.39 (5) | 3.46 ± 1.97 (6) | 3.42 ± 1.67 (4) | Sig |
| Cytochrome b5 type B | 1.15 ± 0.46 (5) | 1.02 ± 0.43 (5) | 2.44 ± 1.10 (6) | 2.94 ± 1.51 (6) | Sig |
| 26S proteasome non‐ ATPase regulatory subunit 1 | 0.83 ± 0.17 (4) | 0.63 ± 0.15 (4) | 2.95 ± 1.15 (6) | 2.79 ± 1.70 (5) | Sig |
| Adenylate kinase 2, mitochondrial | 0.50 ± 0.19 (4) | 0.55 ± 0.16 (2) | 1.63 ± 0.90 (5) | 1.09 ± 0.31 (3) | Sig |
| Maleylacetoacetate isomerase | 0.42 ± 0.30 (4) | 0.40 ± 0.29 (5) | 1.27 ± 0.17 (3) | 1.36 ± 0.52 (6) | Sig |
| Haemoglobin subunit alpha | 1.16 ± 0.25 (10) | 1.13 ± 0.26 (9) | 1.27 ± 0.26 (10) | 1.22 ± 0.32 (9) | Not sig |
| Apolipoprotein A‐I | 10.43 ± 2.66 (9) | 10.21 ± 4.12 (9) | 9.81 ± 5.07 (10) | 14.34 ± 9.93 (9) | Not sig |
| Long‐chain‐fatty‐acid‐CoA ligase 1 | 1.19 ± 0.55 (4) | 1.29 ± 1.5 (5) | 1.83 ± 0.50 (10) | 1.23 ± 0.72 (8) | Not sig |
| Superoxide dismutase (CuZn) | 1.97 (2) | 1.26 ± 0.67 (3) | 1.69 ± 0.97 (10) | 1.22 ± 0.68 (9) | Not sig |
| Pyruvate dehydrogenase E1 component subunit alpha, somatic form mitochondrial | 2.04 ± 1.36 (8) | 1.58 ± 0.65 (8) | 2.18 ± 0.75 (10) | 1.81 ± 0.82 (9) | Not sig |
| Polyubiquitin‐C | 10.78 ± 3.09 (7) | 8.01 ± 2.10 (7) | 9.77 ± 6.02 (8) | 12.66 ± 10.68 (7) | Not sig |
| Reticulon‐2 | 1.03 ± 0.14 (6) | 1.18 ± 0.41 (9) | 2.13 ± 0.90 (10) | 1.34 ± 0.90 (9) | Not sig |
| Nucleoside diphosphate kinase B | 1.84 ± 0.76 (6) | 0.76 ± 0.12 (4) | 2.19 ± 1.18 (9) | 2.22 ± 1.99 (8) | Not sig |
| NADH dehydrogenase (ubiquinone) 1 beta subcomplex subunit 9 | 1.16 ± 0.76 (8) | 0.58 ± 0.37 (5) | 1.25 ± 0.47 (8) | 1.26 ± 0.48 (6) | Not sig |
| Nucleoside diphosphate kinase A | 1.84 ± 0.76 (6) | 0.76 ± 0.12 (4) | 1.60 ± 0.64 (7) | 2.21 ± 2.00 (8) | Not sig |
| Ras‐related protein Rab‐7a | 1.24 ± 0.36 (5) | 1.15 ± 0.36 (8) | 11.39 ± 8.63 (8) | 6.32 ± 4.30 (6) | Not sig |
| NADH dehydrogenase (ubiquinone) 1 alpha subcomplex subunit 13 | 0.38 ± 0.28 (2) | 0.52 ± 0.42 (4) | 1.68 ± 0.87 (8) | 0.62 ± 0.47 (3) | Not sig |
| ATP synthase subunit g, mitochondrial | 0.98 ± 0.24 (5) | 0.88 ± 0.57 (6) | 1.50 ± 0.59 (3) | 0.59 ± 0.25 (4) | Not sig |
| Cytochrome c oxidase subunit 6B1 | 0.83 ± 0.79 (2) | 0.26 ± 0.18 (2) | 2.08 ± 1.49 (3) | 1.80 ± 0.76 (5) | Not sig |
| NADH‐dehydrogenase (ubiquinone) 1 alpha subcomplex subunit 5 | 3.00 ± 0.47 (2) | 2.03 ± 0.66 (4) | 3.06 ± 1.75 (3) | 2.70 ± 2.06 (2) | Not sig |
Values are means ± SD (n). FSR, fractional synthetic rate (%/day); ER, energy restriction; ER + RT, energy restriction plus resistance training. Sig, significance according to Benjamini–Hochberg procedure to adjust for the multiple comparisons with a false discovery rate of 0.2.
Figure 3. Fractional synthetic rate (FSR) of selected individual myofibrillar (A), sarcoplasmic (B) and mitochondrial (C) proteins in overweight and obese older men who underwent 2 weeks of energy restriction (Phase 1: ER) and 2 weeks of energy restriction + resistance training (Phase 2: ER + RT) with balanced (BAL) or skewed (SKEW) protein distribution.
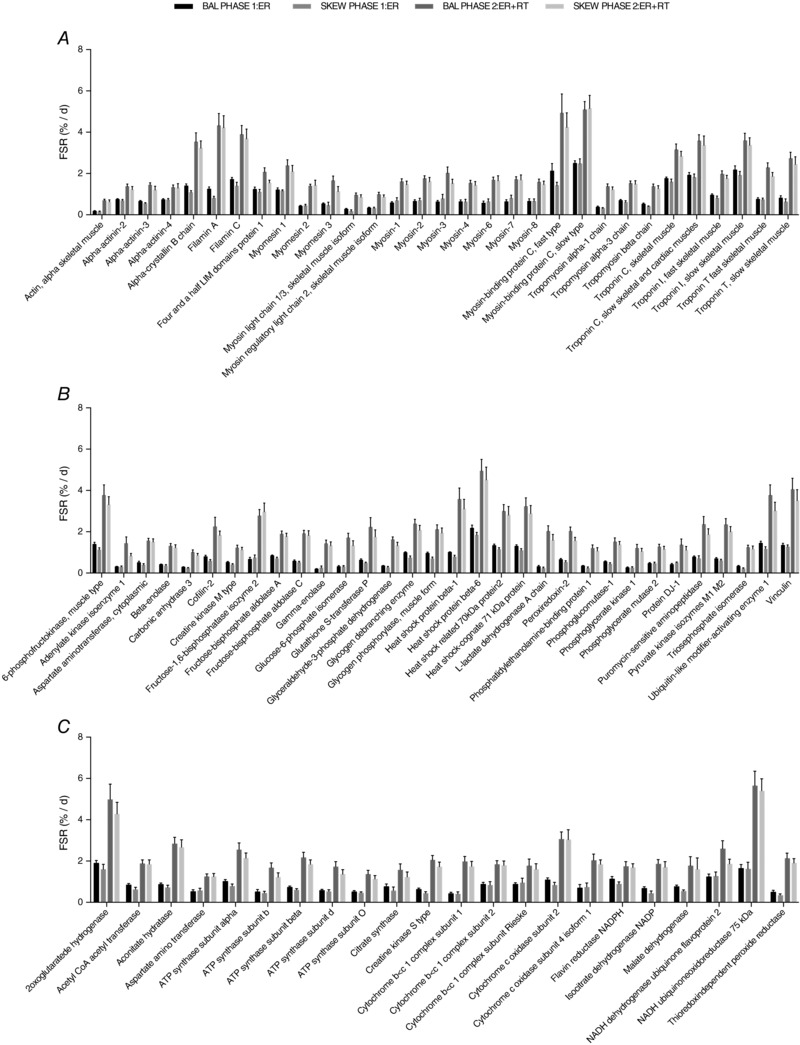
FSRs for all proteins shown were higher during Phase 2: ER + RT than during Phase 1: ER with no differences between groups. Proteome kinetic data were analysed using a 2 × 2 (group × phase) mixed‐model ANOVA, and differences were considered significant with a false discovery rate of 0.2 after a Benjamini–Hochberg procedure was performed to adjust for the multiple comparisons. Values are mean ± SEM.
Gene ontological analysis of muscle proteome
The mean fractional synthesis of proteins in SKEW and BAL groups in ER and ER + RT was further compared at the gene ontological level. Four non‐redundant biological processes were enriched with significant differences (P < 0.05 in paired t tests for proteins, with Benjamini–Hochberg multiple test corrections) in mean protein FSR when comparing kinetics of the muscle proteome from participants in the SKEW vs. BAL groups during ER (Fig. 4). Proteins assigned to the following gene ontologies at the high stringency functional annotation clustering and the highest hierarchy level were collectively increased in the BAL group during ER, including 19 proteins involved in ‘glycolytic process’ (Fig. 4 A), 5 proteins involved in ‘glycogen catabolic process’ (Fig. 4 B), 32 proteins involved in ‘cation transport’ (Fig. 4 C) and 64 proteins classified as being involved in ‘nucleotide metabolic processes’ (Fig. 4 D); individual protein data are shown in Table 2. Gene ontological analysis comparison of protein fractional synthesis during ER + RT revealed significant differences between SKEW and BAL groups for six non‐redundant biological processes at the high stringency functional annotation clustering and the highest hierarchy level (Fig. 5). The proteins that were collectively higher in the BAL group during ER + RT included 16 proteins involved in ‘myofibril assembly’ (Fig. 5 A), 19 proteins involved in ‘glycolytic process’ (Fig. 5 B), 34 proteins involved in ‘respiratory electron transport chain’ (Fig. 5 C), 17 proteins involved in ‘aerobic respiration’ (Fig. 5 D), 40 proteins involved in ‘cation transport’ (Fig. 5 E) and 81 proteins involved in ‘nucleotide metabolic process’ (Fig. 5 F); individual protein data are shown in Table 3.
Figure 4. Mean fractional synthesis of proteins in DAVID gene ontology terms, biological processes level 5, that were significantly different as a group (P < 0.05 in paired t tests for proteins with Benjamini–Hochberg multiple test corrections) in participants who consumed a balanced (BAL) or skewed (SKEW) protein distribution during 2 weeks of energy restriction (Phase 1).
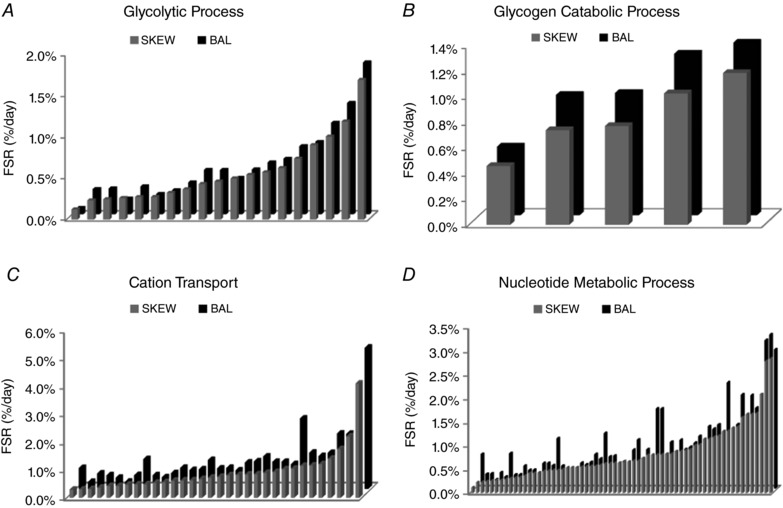
Each bar represents the mean fractional synthetic rate (FSR) of a protein within the DAVID gene ontology term. Names and data for the proteins are provided in Table 2.
Table 2.
Mean FSR (% per day) of proteins in DAVID gene ontology terms that were significantly different as a group (P < 0.05 after Benjamini–Hochberg correction for multiple comparisons) in SKEW vs. BAL during 2 weeks of energy restriction (ER)
| Gene Ontology term: Biological Process Level 5 | Accession number | Protein name | SKEW mean FSR (%/day) | BAL mean FSR (%/day) |
|---|---|---|---|---|
| Glycolytic process GO:0006096, 19 proteins | ||||
| P06733 | Alpha‐enolase | 0.12% | 0.08% | |
| P60174 | Triosephosphate isomerase | 0.23% | 0.30% | |
| P00338 | l‐Lactate dehydrogenase A chain | 0.24% | 0.31% | |
| P09104 | Gamma‐enolase | 0.26% | 0.19% | |
| P04406 | Glyceraldehyde‐3‐phosphate dehydrogenase | 0.27% | 0.34% | |
| P00558 | Phosphoglycerate kinase 1 | 0.27% | 0.25% | |
| P06744 | Glucose‐6‐phosphate isomerase | 0.32% | 0.29% | |
| P13929 | Beta‐enolase | 0.36% | 0.39% | |
| P21695 | Glycerol‐3‐phosphate dehydrogenase [NAD(+)], cytoplasmic | 0.43% | 0.54% | |
| P36871 | Phosphoglucomutase‐1 | 0.46% | 0.54% | |
| P15259 | Phosphoglycerate mutase 2 | 0.50% | 0.44% | |
| P09972 | Fructose‐bisphosphate aldolase C | 0.54% | 0.54% | |
| Q08043 | Alpha‐actinin‐3 | 0.57% | 0.63% | |
| P14618 | Pyruvate kinase isozymes M1/M2 | 0.62% | 0.67% | |
| P04075 | Fructose‐bisphosphate aldolase A | 0.74% | 0.83% | |
| P17858 | 6‐phosphofructokinase, liver type | 0.90% | 0.88% | |
| P19367 | Hexokinase‐1 | 1.00% | 1.11% | |
| P08237 | 6‐Phosphofructokinase, muscle type | 1.19% | 1.35% | |
| Q02218 | 2‐Oxoglutarate dehydrogenase, mitochondrial | 1.69% | 1.84% | |
| Glycogen catabolic process GO:0005980, 5 proteins | ||||
| P36871 | Phosphoglucomutase‐1 | 0.46% | 0.54% | |
| P11217 | Glycogen phosphorylase, muscle form | 0.74% | 0.94% | |
| P35573 | Glycogen debranching enzyme | 0.77% | 0.96% | |
| P46020 | Phosphorylase b kinase regulatory subunit alpha, skeletal muscle isoform | 1.03% | 1.26% | |
| P08237 | 6‐Phosphofructokinase, muscle type | 1.19% | 1.35% | |
| Cation transport GO:006812, 32 proteins | ||||
| P14854 | Cytochrome c oxidase subunit 6B1 | 0.29% | 0.74% | |
| Q86TD4 | Sarcalumenin | 0.30% | 0.24% | |
| P21796 | Voltage‐dependent anion‐selective channel protein 1 | 0.31% | 0.54% | |
| Q93084 | Sarcoplasmic/endoplasmic reticulum calcium ATPase 3 | 0.36% | 0.48% | |
| P31930 | Cytochrome b‐c1 complex subunit 1, mitochondrial | 0.42% | 0.39% | |
| P08574 | Cytochrome c1, heme protein, mitochondrial | 0.42% | 0.25% | |
| P24539 | ATP synthase subunit b, mitochondrial | 0.47% | 0.49% | |
| P20674 | Cytochrome c oxidase subunit 5A, mitochondrial | 0.48% | 1.06% | |
| P48047 | ATP synthase subunit O, mitochondrial | 0.48% | 0.48% | |
| Q99497 | Protein DJ‐1 | 0.54% | 0.41% | |
| O75947 | ATP synthase subunit d, mitochondrial | 0.56% | 0.56% | |
| P28161 | Glutathione S‐transferase Mu 2 | 0.61% | 0.75% | |
| P31415 | Calsequestrin‐1 | 0.62% | 0.67% | |
| P06576 | ATP synthase subunit beta, mitochondrial | 0.63% | 0.69% | |
| P08133 | Annexin A6 | 0.67% | 1.03% | |
| P35609 | Alpha‐actinin‐2 | 0.72% | 0.72% | |
| O43707 | Alpha‐actinin‐4 | 0.75% | 0.75% | |
| P13073 | Cytochrome c oxidase subunit 4 isoform 1, mitochondrial | 0.80% | 0.66% | |
| P16615 | Sarcoplasmic/endoplasmic reticulum calcium ATPase 2 | 0.82% | 0.94% | |
| P25705 | ATP synthase subunit alpha, mitochondrial | 0.83% | 0.98% | |
| P21333 | Filamin‐A | 0.84% | 1.16% | |
| O14983 | Sarcoplasmic/endoplasmic reticulum calcium ATPase 1 | 0.89% | 0.96% | |
| O75964 | ATP synthase subunit g, mitochondrial | 0.92% | 0.96% | |
| P47985 | Cytochrome b‐c1 complex subunit Rieske, mitochondrial | 1.02% | 0.88% | |
| P23297 | Protein S100‐A1 | 1.04% | 2.52% | |
| P62258 | 14‐3‐3 Protein epsilon | 1.15% | 1.30% | |
| Q13642 | Four and a half LIM domains protein 1 | 1.15% | 1.17% | |
| P54652 | Heat shock‐related 70 kDa protein 2 | 1.20% | 1.29% | |
| P14927 | Cytochrome b‐c1 complex subunit 7 | 1.40% | 1.98% | |
| P02794 | Ferritin heavy chain | 1.75% | 1.98% | |
| P21817 | Ryanodine receptor 1 | 2.21% | 2.61% | |
| P13693 | Translationally controlled tumour protein | 4.10% | 5.07% | |
| Nucleotide metabolic process GO:0009117, 64 proteins | ||||
| P06733 | Alpha‐enolase | 0.12% | 0.08% | |
| P23109 | AMP deaminase 1 | 0.22% | 0.73% | |
| P60174 | Triosephosphate isomerase | 0.23% | 0.30% | |
| P00338 | l‐Lactate dehydrogenase A chain | 0.24% | 0.31% | |
| P09104 | Gamma‐enolase | 0.26% | 0.19% | |
| P04406 | Glyceraldehyde‐3‐phosphate dehydrogenase | 0.27% | 0.34% | |
| P00558 | Phosphoglycerate kinase 1 | 0.27% | 0.25% | |
| P14854 | Cytochrome c oxidase subunit 6B1 | 0.29% | 0.74% | |
| P00568 | Adenylate kinase isoenzyme 1 | 0.31% | 0.29% | |
| P06744 | Glucose‐6‐phosphate isomerase | 0.32% | 0.29% | |
| Q08623 | Pseudouridine‐5′‐monophosphatase | 0.33% | 0.48% | |
| P13929 | Beta‐enolase | 0.36% | 0.39% | |
| P31930 | Cytochrome b‐c1 complex subunit 1, mitochondrial | 0.42% | 0.39% | |
| P08574 | Cytochrome c1, heme protein, mitochondrial | 0.42% | 0.25% | |
| P21695 | Glycerol‐3‐phosphate dehydrogenase [NAD(+)], cytoplasmic | 0.43% | 0.54% | |
| P36871 | Phosphoglucomutase‐1 | 0.46% | 0.54% | |
| P24539 | ATP synthase subunit b, mitochondrial | 0.47% | 0.49% | |
| P20674 | Cytochrome c oxidase subunit 5A, mitochondrial | 0.48% | 1.06% | |
| P48047 | ATP synthase subunit O, mitochondrial | 0.48% | 0.48% | |
| P15259 | Phosphoglycerate mutase 2 | 0.50% | 0.44% | |
| Q99497 | Protein DJ‐1 | 0.54% | 0.41% | |
| Q9P0J0 | NADH dehydrogenase [ubiquinone] 1 alpha subcomplex subunit 13 | 0.54% | 0.40% | |
| P09972 | Fructose‐bisphosphate aldolase C | 0.54% | 0.54% | |
| P54819 | Adenylate kinase 2, mitochondrial | 0.55% | 0.51% | |
| O75947 | ATP synthase subunit d, mitochondrial | 0.56% | 0.56% | |
| P40926 | Malate dehydrogenase, mitochondrial | 0.56% | 0.72% | |
| Q08043 | Alpha‐actinin‐3 | 0.57% | 0.63% | |
| Q9Y6M9 | NADH dehydrogenase [ubiquinone] | 0.59% | 1.17% | |
| 1 Beta subcomplex subunit 9 | ||||
| P14618 | Pyruvate kinase isozymes M1/M2 | 0.62% | 0.67% | |
| P06576 | ATP synthase subunit beta, mitochondrial | 0.63% | 0.69% | |
| P40925 | Malate dehydrogenase, cytoplasmic | 0.64% | 0.36% | |
| Q9Y623 | Myosin‐4 | 0.64% | 0.57% | |
| P13533 | Myosin‐6 | 0.66% | 0.53% | |
| P24752 | Acetyl‐CoA acetyltransferase, mitochondrial | 0.66% | 0.81% | |
| P30044 | Peroxiredoxin‐5, mitochondrial | 0.68% | 1.03% | |
| P13535 | Myosin‐8 | 0.68% | 0.63% | |
| P04075 | Fructose‐bisphosphate aldolase A | 0.74% | 0.83% | |
| P13073 | Cytochrome c oxidase subunit 4 isoform 1, mitochondrial | 0.80% | 0.66% | |
| P15531 | Nucleoside diphosphate kinase A | 0.81% | 1.69% | |
| P22392 | Nucleoside diphosphate kinase B | 0.81% | 1.69% | |
| P11055 | Myosin‐3 | 0.82% | 0.56% | |
| P25705 | ATP synthase subunit alpha, mitochondrial | 0.83% | 0.98% | |
| P12883 | Myosin‐7 | 0.83% | 0.60% | |
| P00403 | Cytochrome c oxidase subunit 2 | 0.88% | 1.03% | |
| P22695 | Cytochrome b‐c1 complex subunit 2, mitochondrial | 0.88% | 0.83% | |
| P17858 | 6‐Phosphofructokinase, liver type | 0.90% | 0.88% | |
| O75964 | ATP synthase subunit g, mitochondrial | 0.92% | 0.96% | |
| P19367 | Hexokinase‐1 | 1.00% | 1.11% | |
| P47985 | Cytochrome b‐c1 complex subunit Rieske, mitochondrial | 1.02% | 0.88% | |
| P09622 | Dihydrolipoyl dehydrogenase, mitochondrial | 1.14% | 1.31% | |
| P11142 | Heat shock cognate 71 kDa protein | 1.15% | 1.26% | |
| P08237 | 6‐Phosphofructokinase, muscle type | 1.19% | 1.35% | |
| P30085 | UMP‐CMP kinase | 1.21% | 0.78% | |
| O95182 | NADH dehydrogenase [ubiquinone] 1 alpha subcomplex subunit 7 | 1.31% | 2.24% | |
| P19404 | NADH dehydrogenase [ubiquinone] flavoprotein 2, mitochondrial | 1.32% | 1.19% | |
| P49773 | Histidine triad nucleotide‐binding protein 1 | 1.38% | 1.35% | |
| P14927 | Cytochrome b‐c1 complex subunit 7 | 1.40% | 1.98% | |
| P31040 | Succinate dehydrogenase [ubiquinone] flavoprotein subunit, mitochondrial | 1.60% | 1.05% | |
| P08559 | Pyruvate dehydrogenase E1 component subunit alpha, somatic form, mitochondrial | 1.67% | 1.97% | |
| P28331 | NADH‐ubiquinone oxidoreductase 75 kDa subunit, mitochondrial | 1.67% | 1.71% | |
| Q02218 | 2‐Oxoglutarate dehydrogenase, mitochondrial | 1.69% | 1.84% | |
| Q16718 | NADH dehydrogenase [ubiquinone] 1 alpha subcomplex subunit 5 | 2.08% | 3.14% | |
| P55072 | Transitional endoplasmic reticulum ATPase | 2.79% | 3.26% | |
| O75251 | NADH dehydrogenase [ubiquinone] iron‐sulfur protein 7, mitochondrial | 2.84% | 2.94% | |
Figure 5. Mean FSR of proteins in DAVID gene ontology terms, biological processes level 5, that were significantly different as a group (P < 0.05 in paired t tests for proteins with Benjamini–Hochberg multiple test corrections) in participants who consumed a balanced (BAL) or skewed (SKEW) protein distribution during 2 weeks of energy restriction + resistance training (Phase 2).
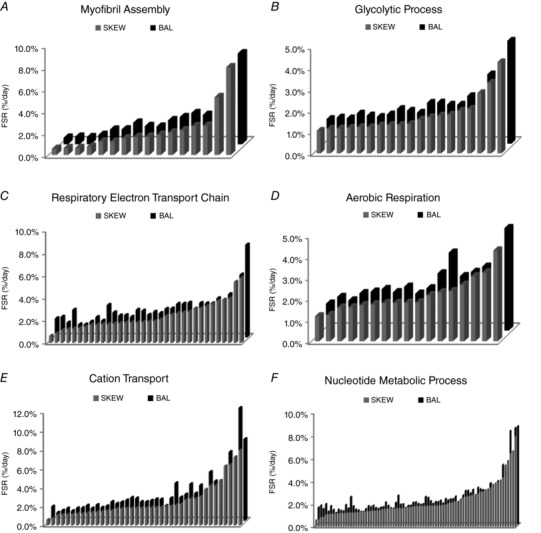
Each bar represents the mean fractional synthetic rate (FSR) of a protein within the DAVID gene ontology term. Names and data for the proteins are provided in Table 3.
Table 3.
Mean FSR (%/day) of proteins in DAVID gene ontology terms that were significantly different as a group (P < 0.05 after Benjamini–Hochberg correction for multiple comparisons) in SKEW vs. BAL during 2 weeks of energy restriction plus resistance training (ER + RT)
| Gene ontology term: Biological Process Level 5 | Accession number | Protein name | SKEW mean FSR (%/day) | BAL mean FSR (%/day) |
|---|---|---|---|---|
| Myofibril Assembly GO:0030239, 16 proteins | ||||
| P63261 | Actin, cytoplasmic 2 | 0.56% | 0.59% | |
| P68133 | Actin, alpha skeletal muscle | 0.63% | 0.68% | |
| P68032 | Actin, alpha cardiac muscle 1 | 0.65% | 0.64% | |
| P31415 | Calsequestrin‐1 | 0.74% | 0.84% | |
| P09493 | Tropomyosin alpha‐1 chain | 1.22% | 1.32% | |
| P35609 | Alpha‐actinin‐2 | 1.22% | 1.34% | |
| P11055 | Myosin‐3 | 1.52% | 1.95% | |
| P13533 | Myosin‐6 | 1.65% | 1.64% | |
| P10916 | Myosin regulatory light chain 2, ventricular/cardiac muscle isoform | 1.67% | 1.59% | |
| Q9Y281 | Cofilin‐2 | 1.83% | 2.18% | |
| O75112 | LIM domain‐binding protein 3 | 2.05% | 2.45% | |
| O75083 | WD repeat‐containing protein 1 | 2.26% | 2.83% | |
| Q8WZ42 | Titin | 2.63% | 2.66% | |
| P10644 | cAMP‐dependent protein kinase type I‐alpha regulatory subunit | 2.67% | 3.84% | |
| O60662 | Kelch‐like protein 41 | 5.28% | 5.44% | |
| Q5VST9 | Obscurin | 8.00% | 8.27% | |
| Glycolytic process GO:0006096, 19 proteins | ||||
| P00558 | Phosphoglycerate kinase 1 | 1.05% | 1.16% | |
| P15259 | Phosphoglycerate mutase 2 | 1.16% | 1.23% | |
| P60174 | Triosephosphate isomerase | 1.17% | 1.19% | |
| Q08043 | Alpha‐actinin‐3 | 1.20% | 1.41% | |
| P06733 | Alpha‐enolase | 1.23% | 1.32% | |
| P13929 | Beta‐enolase | 1.23% | 1.26% | |
| P09104 | Gamma‐enolase | 1.32% | 1.37% | |
| P06744 | Glucose‐6‐phosphate isomerase | 1.33% | 1.63% | |
| P04406 | Glyceraldehyde‐3‐phosphate dehydrogenase | 1.33% | 1.55% | |
| P36871 | Phosphoglucomutase‐1 | 1.38% | 1.45% | |
| P21695 | Glycerol‐3‐phosphate dehydrogenase [NAD(+)], cytoplasmic | 1.70% | 1.93% | |
| P04075 | Fructose‐bisphosphate aldolase A | 1.77% | 1.83% | |
| P09972 | Fructose‐bisphosphate aldolase C | 1.82% | 1.83% | |
| P14618 | Pyruvate kinase isozymes M1/M2 | 2.00% | 2.23% | |
| P17858 | 6‐Phosphofructokinase, liver type | 2.09% | 2.23% | |
| P19367 | Hexokinase‐1 | 2.83% | 3.25% | |
| P08237 | 6‐Phosphofructokinase, muscle type | 3.32% | 3.63% | |
| Q02218 | 2‐Oxoglutarate dehydrogenase, mitochondrial | 4.28% | 4.83% | |
| Respiratory Electron Transport Chain GO:0022904, 34 proteins | ||||
| Q9P0J0 | NADH dehydrogenase [ubiquinone] 1 alpha subcomplex subunit 13 | 0.62% | 1.68% | |
| O95169 | NADH dehydrogenase [ubiquinone] 1 beta subcomplex subunit 8, mitochondrial | 0.84% | 1.81% | |
| Q99497 | Protein DJ‐1 | 1.11% | 1.30% | |
| P99999 | Cytochrome c | 1.21% | 2.43% | |
| Q9Y6M9 | NADH dehydrogenase [ubiquinone] 1 beta subcomplex subunit 9 | 1.26% | 1.14% | |
| O96000 | NADH dehydrogenase [ubiquinone] 1 beta subcomplex subunit 10 | 1.31% | 1.13% | |
| P08574 | Cytochrome c1, heme protein, mitochondrial | 1.41% | 1.38% | |
| P03905 | NADH‐ubiquinone oxidoreductase chain 4 | 1.60% | 1.78% | |
| O43674 | NADH dehydrogenase [ubiquinone] 1 beta subcomplex subunit 5, mitochondrial | 1.60% | 1.47% | |
| P51649 | Succinate‐semialdehyde dehydrogenase, mitochondrial | 1.65% | 2.87% | |
| P04179 | Superoxide dismutase [Mn], mitochondrial | 1.65% | 2.20% | |
| P21695 | Glycerol‐3‐phosphate dehydrogenase [NAD(+)], cytoplasmic | 1.70% | 1.93% | |
| P31930 | Cytochrome b‐c1 complex subunit 1, mitochondrial | 1.74% | 1.95% | |
| P22695 | Cytochrome b‐c1 complex subunit 2, mitochondrial | 1.80% | 1.81% | |
| P20674 | Cytochrome c oxidase subunit 5A, mitochondrial | 1.80% | 2.43% | |
| P14854 | Cytochrome c oxidase subunit 6B1 | 1.80% | 2.36% | |
| P13073 | Cytochrome c oxidase subunit 4 isoform 1, mitochondrial | 1.84% | 1.99% | |
| P10606 | Cytochrome c oxidase subunit 5B, mitochondrial | 1.90% | 2.26% | |
| P00403 | Cytochrome c oxidase subunit 2 | 1.91% | 2.14% | |
| O75746 | Calcium‐binding mitochondrial carrier protein Aralar1 | 2.08% | 2.52% | |
| P09622 | Dihydrolipoyl dehydrogenase, mitochondrial | 2.37% | 2.56% | |
| O75489 | NADH dehydrogenase [ubiquinone] iron‐sulfur protein 3, mitochondrial | 2.50% | 2.96% | |
| Q9UI09 | NADH dehydrogenase [ubiquinone] 1 alpha subcomplex subunit 12 | 2.63% | 2.98% | |
| Q16718 | NADH dehydrogenase [ubiquinone] 1 alpha subcomplex subunit 5 | 2.70% | 3.06% | |
| O95168 | NADH dehydrogenase [ubiquinone] 1 beta subcomplex subunit 4 | 2.77% | 2.10% | |
| P47985 | Cytochrome b‐c1 complex subunit Rieske, mitochondrial | 3.04% | 3.04% | |
| P31040 | Succinate dehydrogenase [ubiquinone] flavoprotein subunit, mitochondrial | 3.07% | 3.01% | |
| P49821 | NADH dehydrogenase [ubiquinone] flavoprotein 1, mitochondrial | 3.24% | 3.01% | |
| O95182 | NADH dehydrogenase [ubiquinone] 1 alpha subcomplex subunit 7 | 3.42% | 3.46% | |
| O00217 | NADH dehydrogenase [ubiquinone] iron‐sulfur protein 8, mitochondrial | 3.72% | 3.18% | |
| O75306 | NADH dehydrogenase [ubiquinone] iron‐sulfur protein 2, mitochondrial | 3.82% | 3.82% | |
| P19404 | NADH dehydrogenase [ubiquinone] flavoprotein 2, mitochondrial | 3.92% | 3.36% | |
| P28331 | NADH‐ubiquinone oxidoreductase 75 kDa subunit, mitochondrial | 5.40% | 5.56% | |
| O75251 | NADH dehydrogenase [ubiquinone] iron‐sulfur protein 7, mitochondrial | 5.76% | 8.23% | |
| Aerobic Respiration GO:0009060, 17 proteins | ||||
| P10515 | Dihydrolipoyllysine‐residue acetyltransferase component of pyruvate dehydrogenase complex, mitochondrial | 1.17% | 1.26% | |
| O75390 | Citrate synthase, mitochondrial | 1.23% | 1.58% | |
| P40925 | Malate dehydrogenase, cytoplasmic | 1.58% | 1.41% | |
| P40926 | Malate dehydrogenase, mitochondrial | 1.60% | 1.76% | |
| P48735 | Isocitrate dehydrogenase [NADP], mitochondrial | 1.70% | 1.83% | |
| P31930 | Cytochrome b‐c1 complex subunit 1, mitochondrial | 1.74% | 1.95% | |
| P22695 | Cytochrome b‐c1 complex subunit 2, mitochondrial | 1.80% | 1.81% | |
| P08559 | Pyruvate dehydrogenase E1 component subunit alpha, somatic form, mitochondrial | 1.81% | 2.06% | |
| P36957 | Dihydrolipoyllysine‐residue succinyltransferase component of 2‐oxoglutarate dehydrogenase complex, mitochondrial | 1.81% | 1.74% | |
| Q13423 | NAD(P) transhydrogenase, mitochondrial | 1.83% | 1.99% | |
| P07954 | Fumarate hydratase, mitochondrial | 2.16% | 2.70% | |
| Q9P2R7 | Succinyl‐CoA ligase [ADP‐ forming] subunit beta, mitochondrial | 2.31% | 3.67% | |
| P09622 | Dihydrolipoyl dehydrogenase, mitochondrial | 2.37% | 2.56% | |
| Q99798 | Aconitate hydratase, mitochondrial | 2.67% | 2.76% | |
| P31040 | Succinate dehydrogenase [ubiquinone] flavoprotein subunit, mitochondrial | 3.07% | 3.01% | |
| P49821 | NADH dehydrogenase [ubiquinone] flavoprotein 1, mitochondrial | 3.24% | 3.01% | |
| Q02218 | 2‐Oxoglutarate dehydrogenase, mitochondrial | 4.28% | 4.83% | |
| Cation Transport GO:0066812, 42 proteins | ||||
| O75964 | ATP synthase subunit g, mitochondrial | 0.59% | 1.50% | |
| P31415 | Calsequestrin‐1 | 0.74% | 0.84% | |
| P28161 | Glutathione S‐transferase Mu 2 | 1.06% | 1.07% | |
| Q99497 | Protein DJ‐1 | 1.11% | 1.30% | |
| P30049 | ATP synthase subunit delta, mitochondrial | 1.14% | 1.03% | |
| P48047 | ATP synthase subunit O, mitochondrial | 1.14% | 1.32% | |
| P35609 | Alpha‐actinin‐2 | 1.22% | 1.34% | |
| P24539 | ATP synthase subunit b, mitochondrial | 1.22% | 1.60% | |
| O43707 | Alpha‐actinin‐4 | 1.30% | 1.30% | |
| O75947 | ATP synthase subunit d, mitochondrial | 1.36% | 1.66% | |
| P08574 | Cytochrome c1, heme protein, mitochondrial | 1.41% | 1.38% | |
| P21796 | Voltage‐dependent anion‐selective channel protein 1 | 1.46% | 1.55% | |
| Q13642 | Four and a half LIM domains protein 1 | 1.55% | 2.00% | |
| Q86TD4 | Sarcalumenin | 1.56% | 1.81% | |
| P31930 | Cytochrome b‐c1 complex subunit 1, mitochondrial | 1.74% | 1.95% | |
| Q93084 | Sarcoplasmic/endoplasmic reticulum calcium ATPase 3 | 1.77% | 2.17% | |
| P20674 | Cytochrome c oxidase subunit 5A, mitochondrial | 1.80% | 2.43% | |
| P14854 | Cytochrome c oxidase subunit 6B1 | 1.80% | 2.36% | |
| Q13423 | NAD(P) transhydrogenase, mitochondrial | 1.83% | 1.99% | |
| P13073 | Cytochrome c oxidase subunit 4 isoform 1, mitochondrial | 1.84% | 1.99% | |
| P06576 | ATP synthase subunit beta, mitochondrial | 1.84% | 2.11% | |
| O14983 | Sarcoplasmic/endoplasmic reticulum calcium ATPase 1 | 1.87% | 2.27% | |
| P10606 | Cytochrome c oxidase subunit 5B, mitochondrial | 1.90% | 2.26% | |
| P17612 | cAMP‐dependent protein kinase catalytic subunit alpha | 1.94% | 1.57% | |
| P16615 | Sarcoplasmic/endoplasmicreticulum calcium ATPase 2 | 1.99% | 2.37% | |
| O60936 | Nucleolar protein 3 | 2.06% | 3.97% | |
| P25705 | ATP synthase subunit alpha, mitochondrial | 2.14% | 2.47% | |
| P54289 | Voltage‐dependent calcium channel subunit alpha‐2/delta‐1 | 2.26% | 2.78% | |
| P08133 | Annexin A6 | 2.68% | 3.88% | |
| P54652 | Heat shock‐related 70 kDa protein 2 | 2.81% | 2.88% | |
| P62258 | 14‐3‐3 protein epsilon | 2.81% | 3.74% | |
| P47985 | Cytochrome b‐c1 complex subunit Rieske, mitochondrial | 3.04% | 3.04% | |
| P21817 | Ryanodine receptor 1 | 3.80% | 5.18% | |
| P21333 | Filamin‐A | 4.22% | 4.17% | |
| Q93034 | Cullin‐5 | 4.23% | 4.23% | |
| P02794 | Ferritin heavy chain | 4.74% | 5.61% | |
| P13637 | Sodium/potassium‐transporting ATPase subunit alpha‐3 | 6.26% | 7.28% | |
| P50993 | Sodium/potassium‐transporting ATPase subunit alpha‐2 | 6.43% | 5.93% | |
| P13693 | Translationally‐controlled tumor protein | 7.24% | 11.95% | |
| P62158 | Calmodulin | 7.94% | 8.64% | |
| Nucleotide metabolic process GO:0009117, 81 proteins | ||||
| O75964 | ATP synthase subunit g, mitochondrial | 0.59% | 1.50% | |
| Q9P0J0 | NADH dehydrogenase [ubiquinone] 1 alpha subcomplex subunit 13 | 0.62% | 1.68% | |
| P00568 | Adenylate kinase isoenzyme 1 | 0.83% | 1.37% | |
| O95169 | NADH dehydrogenase [ubiquinone] 1 beta subcomplex subunit 8, mitochondrial | 0.84% | 1.81% | |
| P00558 | Phosphoglycerate kinase 1 | 1.05% | 1.16% | |
| P54819 | Adenylate kinase 2, mitochondrial | 1.09% | 1.63% | |
| Q99497 | Protein DJ‐1 | 1.11% | 1.30% | |
| P30049 | ATP synthase subunit delta, mitochondrial | 1.14% | 1.03% | |
| P48047 | ATP synthase subunit O, mitochondrial | 1.14% | 1.32% | |
| P15259 | Phosphoglycerate mutase 2 | 1.16% | 1.23% | |
| P60174 | Triosephosphate isomerase | 1.17% | 1.19% | |
| Q9NTK5 | Obg‐like ATPase 1 | 1.17% | 1.72% | |
| Q08043 | Alpha‐actinin‐3 | 1.20% | 1.41% | |
| P99999 | Cytochrome c | 1.21% | 2.43% | |
| P24539 | ATP synthase subunit b, mitochondrial | 1.22% | 1.60% | |
| P06733 | Alpha‐enolase | 1.23% | 1.32% | |
| P13929 | Beta‐enolase | 1.23% | 1.26% | |
| Q9Y6M9 | NADH dehydrogenase [ubiquinone] 1 beta subcomplex subunit 9 | 1.26% | 1.14% | |
| O96000 | NADH dehydrogenase [ubiquinone] 1 beta subcomplex subunit 10 | 1.31% | 1.13% | |
| P09104 | Gamma‐enolase | 1.32% | 1.37% | |
| P06744 | Glucose‐6‐phosphate isomerase | 1.33% | 1.63% | |
| P04406 | Glyceraldehyde‐3‐phosphate dehydrogenase | 1.33% | 1.55% | |
| O75947 | ATP synthase subunit d, mitochondrial | 1.36% | 1.66% | |
| P36871 | Phosphoglucomutase‐1 | 1.38% | 1.45% | |
| P08574 | Cytochrome c1, heme protein, mitochondrial | 1.41% | 1.38% | |
| Q9Y623 | Myosin‐4 | 1.43% | 1.50% | |
| P13535 | Myosin‐8 | 1.47% | 1.53% | |
| P11055 | Myosin‐3 | 1.52% | 1.95% | |
| Q08623 | Pseudouridine‐5′‐monophosphatase | 1.54% | 1.65% | |
| P23109 | AMP deaminase 1 | 1.58% | 1.45% | |
| P40925 | Malate dehydrogenase, cytoplasmic | 1.58% | 1.41% | |
| P00338 | l‐Lactate dehydrogenase A chain | 1.59% | 1.92% | |
| P30085 | UMP‐CMP kinase | 1.59% | 2.53% | |
| P40926 | Malate dehydrogenase, mitochondrial | 1.60% | 1.76% | |
| P03905 | NADH‐ubiquinone oxidoreductase chain 4 | 1.60% | 1.78% | |
| O43674 | NADH dehydrogenase [ubiquinone] 1 beta subcomplex subunit 5, mitochondrial | 1.60% | 1.47% | |
| P13533 | Myosin‐6 | 1.65% | 1.64% | |
| P12883 | Myosin‐7 | 1.69% | 1.67% | |
| P21695 | Glycerol‐3‐phosphate dehydrogenase [NAD(+)], cytoplasmic | 1.70% | 1.93% | |
| P31930 | Cytochrome b‐c1 complex subunit 1, mitochondrial | 1.74% | 1.95% | |
| P04075 | Fructose‐bisphosphate aldolase A | 1.77% | 1.83% | |
| Q8TCD5 | 5′(3′)‐Deoxyribonucleotidase, cytosolic type | 1.78% | 1.74% | |
| P22695 | Cytochrome b‐c1 complex subunit 2, mitochondrial | 1.80% | 1.81% | |
| P20674 | Cytochrome c oxidase subunit 5A, mitochondrial | 1.80% | 2.43% | |
| P14854 | Cytochrome c oxidase subunit 6B1 | 1.80% | 2.36% | |
| P08559 | Pyruvate dehydrogenase E1 component subunit alpha, somatic form, mitochondrial | 1.81% | 2.06% | |
| P09972 | Fructose‐bisphosphate aldolase C | 1.82% | 1.83% | |
| Q13423 | NAD(P) transhydrogenase, mitochondrial | 1.83% | 1.99% | |
| P13073 | Cytochrome c oxidase subunit 4 isoform 1, mitochondrial | 1.84% | 1.99% | |
| P06576 | ATP synthase subunit beta, mitochondrial | 1.84% | 2.11% | |
| P24752 | Acetyl‐CoA acetyltransferase, mitochondrial | 1.85% | 1.86% | |
| P10606 | Cytochrome c oxidase subunit 5B, mitochondrial | 1.90% | 2.26% | |
| P00403 | Cytochrome c oxidase subunit 2 | 1.91% | 2.14% | |
| P14618 | Pyruvate kinase isozymes M1/M2 | 2.00% | 2.23% | |
| P17858 | 6‐Phosphofructokinase, liver type | 2.09% | 2.23% | |
| P25705 | ATP synthase subunit alpha, mitochondrial | 2.14% | 2.47% | |
| P15531 | Nucleoside diphosphate kinase A | 2.21% | 1.60% | |
| P22392 | Nucleoside diphosphate kinase B | 2.22% | 2.19% | |
| P09622 | Dihydrolipoyl dehydrogenase, mitochondrial | 2.37% | 2.56% | |
| O75489 | NADH dehydrogenase [ubiquinone] iron‐sulfur protein 3, mitochondrial | 2.50% | 2.96% | |
| Q9UI09 | NADH dehydrogenase [ubiquinone] 1 alpha subcomplex subunit 12 | 2.63% | 2.98% | |
| P30044 | Peroxiredoxin‐5, mitochondrial | 2.67% | 2.76% | |
| Q16718 | NADH dehydrogenase [ubiquinone] 1 alpha subcomplex subunit 5 | 2.70% | 3.06% | |
| O95168 | NADH dehydrogenase [ubiquinone] 1 beta subcomplex subunit 4 | 2.77% | 2.10% | |
| P19367 | Hexokinase‐1 | 2.83% | 3.25% | |
| P11142 | Heat shock cognate 71 kDa protein | 2.88% | 3.11% | |
| P47985 | Cytochrome b‐c1 complex subunit Rieske, mitochondrial | 3.04% | 3.04% | |
| P31040 | Succinate dehydrogenase [ubiquinone] flavoprotein subunit, mitochondrial | 3.07% | 3.01% | |
| P49821 | NADH dehydrogenase [ubiquinone] flavoprotein 1, mitochondrial | 3.24% | 3.01% | |
| P08237 | 6‐Phosphofructokinase, muscle type | 3.32% | 3.63% | |
| O95182 | NADH dehydrogenase [ubiquinone] 1 alpha subcomplex subunit 7 | 3.42% | 3.46% | |
| O00217 | NADH dehydrogenase [ubiquinone] iron‐sulfur protein 8, mitochondrial | 3.72% | 3.18% | |
| O75306 | NADH dehydrogenase [ubiquinone] iron‐sulfur protein 2, mitochondrial | 3.82% | 3.82% | |
| P19404 | NADH dehydrogenase [ubiquinone] flavoprotein 2, mitochondrial | 3.92% | 3.36% | |
| Q9UII2 | ATPase inhibitor, mitochondrial | 4.09% | 5.25% | |
| Q02218 | 2‐Oxoglutarate dehydrogenase, mitochondrial | 4.28% | 4.83% | |
| P28331 | NADH‐ubiquinone oxidoreductase 75 kDa subunit, mitochondrial | 5.40% | 5.56% | |
| O75251 | NADH dehydrogenase [ubiquinone] iron‐sulfur protein 7, mitochondrial | 5.76% | 8.23% | |
| P50993 | Sodium/potassium‐transporting ATPase subunit alpha‐2 | 6.43% | 5.93% | |
| P55072 | Transitional endoplasmic reticulum ATPase | 6.65% | 8.49% | |
| P62158 | Calmodulin | 7.94% | 8.64% | |
Synthesis rates of skeletal muscle‐derived proteins measured in serum
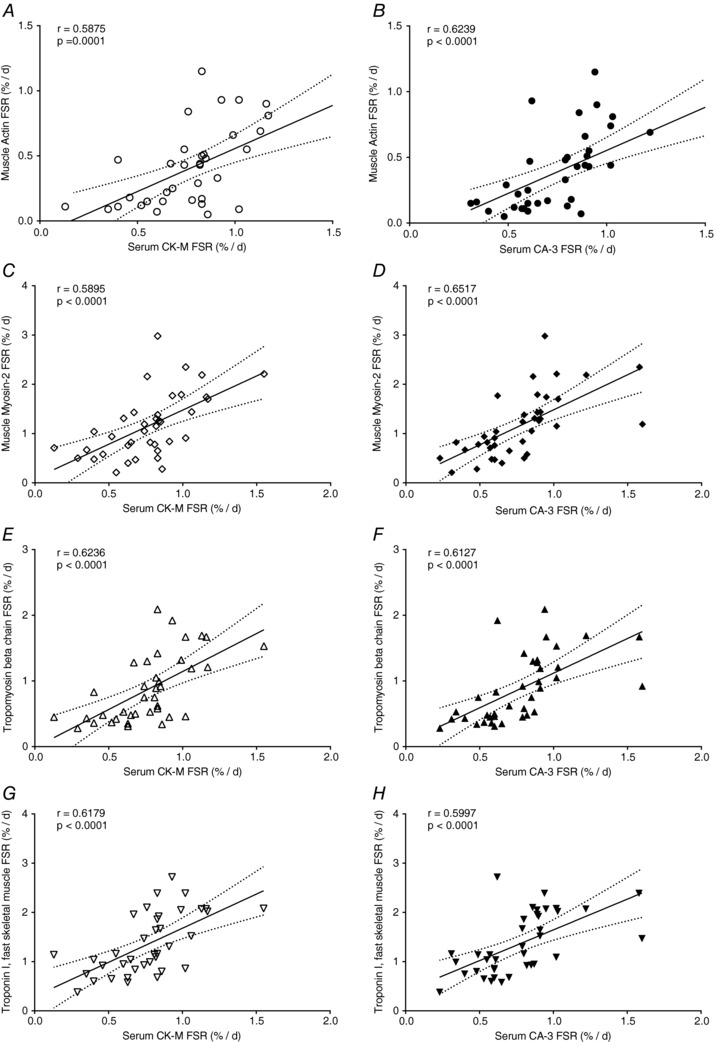
The FSR of muscle‐derived proteins, CA‐3 and CK‐M, were measured in serum samples obtained before and after RT in the SKEW and BAL groups. In both SKEW and BAL groups, there was an increase in FSR of serum CA‐3 (P < 0.001 main effect for phase, P < 0.05 in SKEW, P < 0.001 in BAL, Fig. 6 A) and CK‐M (P < 0.001 main effect for phase, P < 0.05 in SKEW, P < 0.005 in BAL, Fig. 6 B) during ER + RT compared to ER alone. The serum CA‐3 and CK‐M FSRs were similar in BAL and SKEW. Significant correlations between serum CA‐3 and muscle CA‐3 FSR (r = 0.6527, P < 0.0001, Fig. 6 C) as well as between serum CK‐M FSR and muscle CK‐M FSR (r = 0.5733, P < 0.0005, Fig. 6 D) were observed. In addition, both serum CK‐M FSR and serum CA‐3 FSR correlated significantly with FSR of myofibrillar proteins such as actin (r = 0.5875, P = 0.0001, Fig. 7 A; r = 0.6239, P < 0.0001, Fig. 7 B), myosin (r = 0.5895, P < 0.0001, Fig. 7 C; r = 0.6517, P < 0.0001, Fig. 7 D), tropomyosin (r = 0.6236, P < 0.0001, Fig. 7 E; r = 0.6127, P < 0.0001, Fig. 7 F) and troponin (r = 0.6179, P < 0.0001, Fig. 7 G; r = 0.5997, P < 0.0001, Fig. 7 H).
Figure 6. Carbonic anhydrase 3 (A) and creatine kinase M‐type (B) fractional synthesis in serum of SKEW and BAL participants (n = 10 per group) during 2 weeks of energy restriction (Phase1: ER) and 2 weeks of energy restriction + resistance training (Phase2: ER + RT).
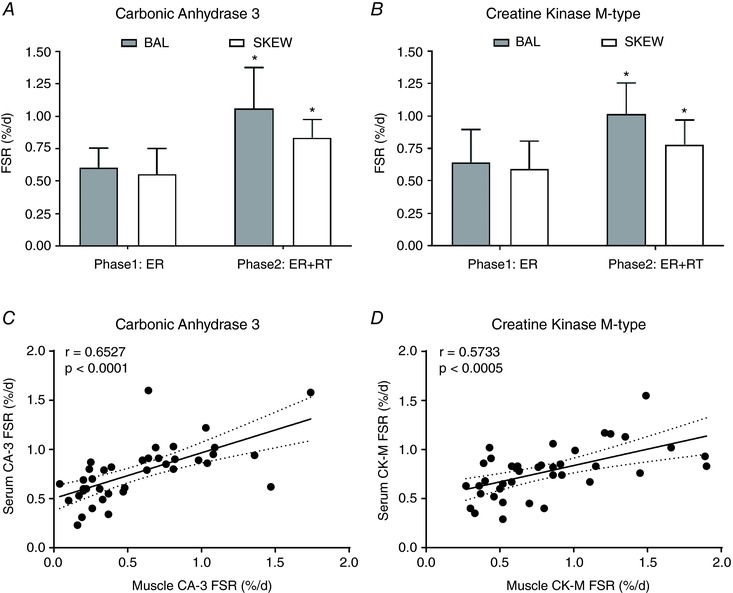
*Different from Phase 1: ER; P < 0.05; two‐way ANOVA with post‐hoc Holm–Sidak comparison. Values are mean ± SD. Relationship between carbonic anhydrase 3 (C) and creatine kinase M‐type (D) fractional synthetic rates (FSR; %/day) measured in the serum and in the muscle using D2O labelling in overweight and obese older men who underwent 2 weeks of energy restriction (Phase 1) and 2 weeks of energy restriction + resistance training (Phase 2) with balanced (BAL) or skewed (SKEW) protein distribution.
Figure 7. Relationship between carbonic anhydrase 3 and creatine kinase M‐type fractional synthetic rates (FSR; %/day) measured in the serum and the myofibrillar proteins (actin, myosin, tropomyosin, troponin) fractional synthetic rates (FSR; %/day), measured in the muscle using D2O labelling in overweight and obese older men who underwent 2 weeks of energy restriction (Phase 1) and 2 weeks of energy restriction + resistance training (Phase 2) with balanced (BAL) or skewed (SKEW) protein distribution.
MyoPS: comparison of D2O and l‐[ring‐13C6]‐phenylalanine tracers
Table 4 provides a comparison between bulk MyoPS rates measured via D2O in the current study and the rates measured acutely via l‐[ring‐13C6]‐phenylalanine (13C6 Phe) infusion in the same participants in our previous study (Murphy et al. 2015). A Bland–Altman plot of the agreement between the two approaches is shown in Fig. 8. The calculated bias between the free‐living (D2O) and laboratory‐based (13C6 Phe) rates is −0.5048%/day (limits of agreement: −1.430, 0.4201). Proportional bias can be observed such that as the average of the MyoPS rates increase the difference between the free‐living (D2O) and laboratory‐based (13C6 Phe) rates becomes larger.
Table 4.
Comparison between myofibrillar protein fractional synthetic rate (FSR, %/day) measured via l‐[ring‐13C6]‐phenylalanine infusion and D2O
| ER | ER + RT | |||
|---|---|---|---|---|
| 13C6 Phe | D2O | 13C6 Phe | D2O | |
| BAL (%/day) | 0.89 ± 0.11* | 1.24 ± 0.31† | 1.01 ± 0.06* | 1.64 ± 0.48† |
| SKEW (%/day) | 0.82 ± 0.11* | 1.26 ± 0.37† | 0.90 ± 0.11* | 1.52 ± 0.66† |
Values are means ± SD (n = 10 per group). BAL, balanced protein intake group; ER, energy restriction; ER + RT, energy restriction plus resistance training; FSR, fractional synthetic rate; Phe, phenylalanine; SKEW, skewed protein intake group.
*Based on previously reported rates measured acutely over an 11 h labelling period in response to BAL or SKEW pattern of protein intake at the end of 2 weeks of ER and 2 weeks of ER + RT (Murphy et al. 2015). Acute FSRs were converted from %/h to %/day by assuming that approximately 16 h per day are spent in the postprandial state and 8 h in the postabsorptive state in Western countries.
†Data represent integrated FSR measured over the 2 weeks of ER and 2 weeks of ER + RT in the BAL and SKEW protein intake groups. The same participants were included in the l‐[ring‐13C6]‐phenylalanine infusion and D2O measurements.
Figure 8. Bland–Altman plot of comparison between myofibrillar protein fractional synthetic rate (FSR) measured acutely via l‐[ring‐13C6]‐phenylalanine infusion (Murphy et al. 2015) and over 2 weeks via D2O.
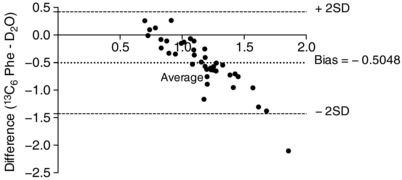
Acute FSR was converted from %/h to %/day assuming that approximately 16 h per day are spent in the postprandial state and 8 h in the postabsorptive state in Western countries.
Discussion
We used the D2O labelling approach combined with tandem mass spectrometric analysis of proteins across the proteome (Shankaran et al. 2016a) to estimate the bulk MyoPS and the synthesis rates of individual skeletal muscle proteins over 2 week of ER and 2 week of ER + RT in overweight/obese older men who consumed their dietary protein in either a balanced or a skewed pattern. This extends our previous work (Murphy et al. 2015) which showed that a balanced distribution of dietary protein ingestion more effectively stimulated MyoPS over an 11 h period versus a skewed distribution in overweight and obese older men during ER, both with and without RT. In contrast to an acute (i.e. 11 h) labelling period and contrary to our original hypothesis, we found little influence of the distribution of daily protein on integrative (i.e. 2‐week) bulk MyoPS during our intervention. However, a subtle effect of the dietary protein distribution was revealed by gene ontological analysis of proteome dynamics, wherein participants in the BAL group had a higher rate of synthesis of proteins involved in several metabolic processes during ER, and increased synthesis of several metabolic and structural proteins during ER + RT compared to the SKEW group. Moreover, in agreement with our previous data, integrative bulk MyoPS and the synthetic rates of most individual myofibrillar, sarcoplasmic and mitochondrial proteins measured across many gene ontologies were higher in ER + RT compared to ER alone. In addition, rates of skeletal muscle‐derived (synthesized) proteins measured in serum samples (CK‐M and CA‐3) mirrored the synthetic rates of numerous skeletal muscle proteins obtained via muscle biopsies.
The observation of little influence of the distribution of daily protein on the longer‐term integrative MyoPS (%/day) response contrasts with our earlier work showing that a balanced distribution (3 × 25 g evenly spaced doses of protein) versus a skewed distribution of the same amount of protein (10 g at breakfast, 15 g at lunch, 50 g at dinner) stimulated bulk MyoPS more effectively over 11 h during ER (Murphy et al. 2015) measured using the primed, continuous intravenous infusion of an isotopically labelled amino acid (i.e.13C6 Phe). In the present study (which was conducted in the same participants as our previous study) we used the oral administration of D2O. When used simultaneously, these methods have been reported to yield comparable mean MyoPS rates measured over several hours (Wilkinson et al. 2015). As such, it appears unlikely that differences in the validity of the two methods per se account for the inconsistency between our acute and longer‐term findings. A more likely explanation for the discrepancy is the conditions under which MPS measurements were conducted. The continuous labelled amino acid infusion technique provides sensitive measurements of MPS under controlled laboratory conditions and is most suitable for assessing the acute response (2–24 h) to specific stimuli such as feeding or exercise (Rennie et al. 1994). As such, this approach may be more sensitive to detecting subtle effects of dietary protein intake pattern on MPS. Nevertheless, this technique restricts the acquisition of long‐term, potentially more relevant, measures of muscle in free‐living settings. Here we report on longer‐term bulk MyoPS (%/day) measured over a 2‐week free‐living period in which several variables could potentially have modified MyoPS (i.e. timing and consumption of prescribed meals, variability in activities of daily living, daily stresses and/or sleep duration). Moreover, an important finding from our acute study was that the influence of protein distribution on bulk MyoPS was specific to the fed and not the fasted rates of MyoPS (Murphy et al. 2015); thus, fasted periods, particularly the extended overnight fast, may have ‘diluted’ feeding‐specific effects on MyoPS. Additionally, in our previous work (Murphy et al. 2015), protein was consumed as isolated whey protein in liquid form whereas dietary protein was mainly provided in mixed macronutrient meals in the current study protocol. The achievement of a rapid and pronounced increase in plasma indispensible amino acid/leucine concentrations, which is characteristic of whey protein ingestion, is associated with increased rates of MyoPS compared to a slow rate of appearance of these amino acids (West et al. 2011). Consumption of solid food and co‐ingestion of other nutrients (carbohydrate, fat and dietary fibre) modifies amino acid digestion and absorption kinetics and blunts postprandial aminoacidaemia/leucinaemia (Conley et al. 2011; Burke et al. 2012). As such, it remains possible that the consumption of a given protein dose within a solid, mixed macronutrient meal may attenuate the MPS response.
When extrapolated to %/day, the acute rates of MyoPS measured in the laboratory setting (Murphy et al. 2015) were lower than those obtained using D2O (Table 4, Fig. 8). Of relevance here is that for the duration of the acute 13C6 Phe infusion trials (Murphy et al. 2015) participants rested in the supine position. It is well established that inactivity suppresses MyoPS and this probably contributed to the lower rates of MyoPS measured acutely compared to the free‐living D2O measurements wherein participants performed their usual daily activity (Breen et al. 2013). Moreover, in the acute study (Murphy et al. 2015) MyoPS in the ER + RT condition was measured 48 h after the last resistance exercise session. As MyoPS content is greatest immediately after exercise and wanes over time it is unsurprising that acute rates were lower than the free‐living D2O rates which captured the integrated response to six RT sessions performed over the 2 weeks of ER + RT.
Our most novel finding is that performance of RT during ER increases the synthesis of most (175 of 190 measured) individual skeletal muscle proteins in the myofibrillar, sarcoplasmic and mitochondrial protein categories, compared to ER alone. To the best of our knowledge, we are the first to report the synthetic rates of a large number of individual skeletal muscle proteins in humans in response to RT during ER. Our data indicate that, even in the presence of ER, performance of RT elevated the synthesis rates of a broad array of individual skeletal muscle proteins across the proteome, including not only contractile proteins but also sarcoplasmic and mitochondrial proteins (Table 1; Fig. 3) and proteins across many gene ontologies (Fig. 5). This ‘mass response’ appears inconsistent with the phenotype induced by prolonged RT (i.e. myofibrillar protein accretion). Nevertheless, previous work suggests that the specificity of the muscle protein synthetic response following an acute bout of resistance exercise is dependent on training status (Kim et al. 2005; Wilkinson et al. 2008). For example, an acute bout of resistance exercise stimulated mitochondrial, as well as myofibrillar, protein synthesis in untrained men, whereas the increase in mitochondrial protein synthesis was absent after 10 weeks of RT (Wilkinson et al. 2008). As our individual FSR measurements reflect the integrated response to six resistance exercise sessions in previously untrained participants it may be that this ‘mass response’ reflects an early, less specific muscle protein synthetic response to RT. As such, it remains possible that the response may become more specific to myofibrillar proteins after a prolonged period of training. Camera et al. (2017) recently used deuterated water to measure the turnover of individual skeletal muscle proteins in response to RT over an integrated 9 day period in overweight young men consuming a high‐fat low‐carbohydrate diet. While the authors reported a less ‘global’ response across the proteome (i.e. 28 of the 90 measured proteins were RT‐responsive compared to 175 of 190 proteins in the present study) increases in the synthesis of both sarcoplasmic and myofibrilliar proteins were observed (Camera et al. 2017). This is consistent with the notion that, at least early in RT, muscle protein synthetic responses are not confined to contractile and structural components.
The ability to discern the FSR for individual skeletal muscle proteins, rather than global tissue or even sub‐fractional synthetic rates, provides unique insight into the response to an intervention that would otherwise not be possible. Indeed, our data and others (Camera et al. 2017) demonstrate dramatic variability in protein turnover rates, highlighting that sub‐fractional analysis may mask dynamic changes in individual proteins within a tissue fraction. The potential applications of proteome dynamic techniques are far reaching and future work could, potentially, lead to the identification of a ‘biological blueprint’ of the skeletal muscle response to RT or other interventions (Hawley & Krook, 2016). This could have important implications for optimizing exercise and other treatment interventions for the prevention and management of sarcopenia as well as other musculoskeletal conditions.
Consistent with our findings of increased synthesis rates of the majority of individual skeletal muscle proteins measured in response to ER + RT compared to ER alone, we report a clear effect of RT on integrative bulk MyoPS during ER in older men. Illustrating the potency of this stimulus, we observed that just six sessions of low‐load RT performed over 2 weeks was sufficient to increase longer‐term bulk MyoPS by ∼26% compared to ER alone. This finding is in line with our acute data showing higher rates of bulk MyoPS at the end of ER + RT versus ER (Murphy et al. 2015) and supports previous work showing that the incorporation of RT can attenuate muscle mass loss during ER in older adults (Campbell et al. 2009; Villareal et al. 2017).
Further illustrating the potential application of proteome kinetics and the ‘virtual biopsy’ approach (using kinetic measurements on proteins released into body fluids to reveal kinetics of synthesis or turnover of these proteins back in the tissue of origin), we observed a correlation between the synthetic rates of skeletal muscle‐derived (synthesized) proteins obtained via serum sampling (CK‐M, CA‐3) and the synthetic rates of proteins obtained via skeletal muscle sampling (CK‐M, CA‐3, actin, myosin, tropomyosin, troponin). This suggests that measuring synthetic rates of blood‐borne skeletal muscle proteins could act as a surrogate for the direct (but invasive) measurement of skeletal muscle protein synthesis. While changes in MPS occur rapidly (hours) in response to anabolic interventions, changes in muscle mass, strength and function occur far more slowly (months to years). The measurement of MPS requires muscle biopsies, making it generally impractical for routine use in therapeutic trials or clinical practice. Our data corroborate recent reports that the FSR of CK‐M and CA‐3 isolated from serum correlated with the FSR of CK‐M and CA‐3, and numerous other proteins of various ontologies, in skeletal muscle in clinical and preclinical studies (Shankaran et al. 2016a, b). Taken together, these data suggest that measuring the FSR of blood‐borne skeletal muscle proteins (such as serum CK‐M and CA‐3) may have the potential to act as a minimally invasive biomarker of MPS. It should be noted that FSR of serum CA‐3 and CK‐M were higher during ER + RT compared to ER (P < 0.001 main effect for phase), and thus were sensitive enough to reveal effects on RT on skeletal muscle FSR. Given the wide variability in individual responses to anabolic interventions such as standardized exercise training programmes and pharmaceutical interventions, such an approach could allow for the early identification of responders and non‐responders so that training/treatment can be personalized to confer maximum musculoskeletal benefits. Nevertheless, further work will be needed to validate this approach and to investigate if it is sensitive enough to identify small, but clinically relevant, changes in MPS.
A potential limitation of our study is that we did not measure longer‐term MyoPS at baseline while the participants were in EB. It is therefore unclear whether there were ER‐induced changes in longer‐term integrated bulk MyoPS compared to the absence of ER. In our previous study we measured acute bulk MyoPS at baseline in EB and showed that RT combined with a balanced, but not a skewed, distribution of protein ingestion restored the lower fed‐state rates of acute bulk MyoPS during ER to the higher EB levels (Murphy et al. 2015).
Another limitation is that we did not measure the change in abundance of individual skeletal muscle proteins. As such, we are unable to determine whether the increases in individual protein FSR translated to protein accretion or simply reflected enhanced turnover. A few points are worth noting in this regard. First, the abundance of a protein is typically measured per gram of tissue (measured weight) or by comparison to abundances of other proteins (e.g. by label‐free methods). Anabolic interventions may not change the relative abundances of the major proteins in skeletal muscle, however. In settings of global muscle mass increase, where all proteins may increase in proportion and the concentration of most proteins per gram of tissue does not change, abundance measurements are therefore in principle different from, and less sensitive, than fractional synthesis rates, which are independent of tissue mass or relative amount of other proteins present. Muscle may accrue as a unit without changes in composition, in which case the true metric of abundance change for a protein in this setting is total amount of muscle tissue, which is a macroscopic measurement and not a biochemical measurement. In addition, the relatively short duration of the intervention (2 weeks) may not have been long enough to result in changes in pool sizes or mass of muscle proteins. Changes in mass may lag behind changes in synthesis rates, so a relationship is not always immediately apparent.
Moreover, at the global tissue level, it is generally accepted that the response of MPS to RT and feeding is the principal driver of the ‘anabolic’ shift towards a positive net protein balance with a comparatively small contribution from the reduction in muscle protein breakdown. Nevertheless, using label‐free methods, Camera et al. (2017) recently reported no increase in abundance despite an increase in turnover for several individual skeletal muscle proteins in response to short‐term RT in young men. An important point, however, is that even if the increase in individual protein synthetic rates we observed in the present study were due to increased turnover without enhanced abundance, this may still reflect a positive outcome by supporting protein renewal and preventing the accumulation of old/damaged components (Lopez‐Otin et al. 2013).
Some potential technical limitations are worth noting. We subtracted out isotopic label present in each peptide at the end of the first 2‐week labelling period (Phase 1), so that the end of the initial labelling period served as a new baseline for rise‐to‐plateau label incorporation. This correction is necessary for a continuous labelling approach with two time‐points, but subtraction of a second baseline may have added to experimental variability. In addition, we used time‐averaged D2O exposure for the precursor pool rather than using a kinetic model (Price et al. 2012) in which linked pools of body water and peptides each acquire time‐varying deuterium label with fitted turnover rates. To compare kinetic results using time‐averaged D2O exposure to the previous kinetic modelling approach, we analysed isotopic data from two proteins (CA‐3 and CK‐M in serum) by the two methods. A good correlation (slope of 1.02) was observed between the FSRs derived by kinetic modelling and the simplified calculation, for the 20 study participants. This indicates that under these conditions of short labelling times and stable body D2O enrichments, in the setting of relatively slow protein synthesis rates, the approximation of time‐averaged D2O exposure does not result in a calculated FSR that is systematically different from a kinetic model in which the body water enrichment calculation is more complex.
In conclusion, we report little influence of the pattern of protein ingestion over the day on the integrated rate of bulk MyoPS measured over 2 weeks of ER alone or 2 weeks of ER + RT in overweight/obese older men, although subtle differences in the pattern of individual protein synthesis rates in skeletal muscle were apparent between the dietary interventions. We provide novel data showing that short‐term RT increases both the synthesis rates of the majority of individual skeletal muscle proteins measured, comprising many gene ontologies, and longer‐term integrated bulk MyoPS under conditions of ER in older adults.
Additional information
Competing interests
Both AK and LGK are employees of Nestec SA, a subsidiary of Nestle, which was a linkage partner in the grant for this study.
Author contributions
CHM, AK, LGK, LMB, JAH and SMP conceived and designed the research; CHM, TAC‐V, CJM, NMK, MS, CK, KL, MH and SMP generated and collected data; CHM, SMP, MS, KL and MH analysed data, CHM, MS, MH and SMP interpreted the results; CHM and MS prepared the figures; CHM, MS, MH and SMP wrote the manuscript; CHM, TAC‐V, CJM, AK, LGK, LMB, JAH, MS, K, MH and SMP revised the manuscript and approved the final version.
Funding
This study was funded by an Australian Research Council Linkage Project grant (LP100100010) to JAH, Nestle and the Australian Institute of Sport, a National Science and Engineering Research Council of Canada grant to SMP and KineMed, Inc.
Acknowledgements
We thank Tracy Rerecich and Todd Prior for their technical and laboratory assistance and the study participants for their time and dedication. We also would like to acknowledge the contribution from Thomas Angel PhD and Marc Colangelo PhD to the data analyses; Scott Turner PhD for initial discussions as well as Joan Protasio and Chancy Fessler for technical assistance.
Biography
Caoileann Murphy trained as a Dietitian in Trinity College Dublin. After qualifying in 2009 she worked clinically at St. James's Hospital in Dublin before deciding to complete a Masters in Sport and Exercise Nutrition at Loughborough University in the UK. Following this Caoileann completing her PhD in nutrition and exercise strategies to maximize rates of muscle protein synthesis and counter sarcopenia in McMaster University, Canada, under the supervision of Professor Stuart Phillips. Caoileann now works as a Postdoctoral Research Fellow in the Nutrigenomics Research Group led by Professor Helen Roche in University College Dublin. Her postdoctoral research is in the area of nutrition and sarcopenia with an emphasis on personalized approaches to effective treatment and prevention. Caoileann is a recipient of the TOPMed10 Marie Curie Fellowship and the ESPEN Fellowship 2017.

Edited by: Scott Powers & Troy Hornberger
This is an Editor's Choice article from the 1 June 2018 issue.
References
- Baumgartner RN, Wayne SJ, Waters DL, Janssen I, Gallagher D & Morley JE (2004). Sarcopenic obesity predicts instrumental activities of daily living disability in the elderly. Obes Res 12, 1995–2004. [DOI] [PubMed] [Google Scholar]
- Bouchonville MF & Villareal DT (2013). Sarcopenic obesity: how do we treat it? Curr Opin Endocrinol Diabetes Obes 20, 412–419. [DOI] [PMC free article] [PubMed] [Google Scholar]
- Breen L, Stokes KA, Churchward‐Venne TA, Moore DR, Baker SK, Smith K, Atherton PJ & Phillips SM (2013). Two weeks of reduced activity decreases leg lean mass and induces “anabolic resistance” of myofibrillar protein synthesis in healthy elderly. J Clin Endocrinol Metab 98, 2604–2612. [DOI] [PubMed] [Google Scholar]
- Burke LM, Winter JA, Cameron‐Smith D, Enslen M, Farnfield M & Decombaz J (2012). Effect of intake of different dietary protein sources on plasma amino acid profiles at rest and after exercise. Int J Sport Nutr Exerc Metab 22, 452–462. [DOI] [PubMed] [Google Scholar]
- Busch R, Kim YK, Neese RA, Schade‐Serin V, Collins M, Awada M, Gardner JL, Beysen C, Marino ME, Misell LM & Hellerstein MK (2006). Measurement of protein turnover rates by heavy water labeling of nonessential amino acids. Biochim Biophys Acta 1760, 730–744. [DOI] [PubMed] [Google Scholar]
- Camera DM, Burniston JG, Pogson MA, Smiles WJ & Hawley JA (2017). Dynamic proteome profiling of individual proteins in human skeletal muscle after a high‐fat diet and resistance exercise. FASEB J 31, 5478–5494. [DOI] [PubMed] [Google Scholar]
- Campbell WW, Haub MD, Wolfe RR, Ferrando AA, Sullivan DH, Apolzan JW & Iglay HB (2009). Resistance training preserves fat‐free mass without impacting changes in protein metabolism after weight loss in older women. Obesity (Silver Spring) 17, 1332–1339. [DOI] [PMC free article] [PubMed] [Google Scholar]
- Chung JY, Kang HT, Lee DC, Lee HR & Lee YJ (2013). Body composition and its association with cardiometabolic risk factors in the elderly: a focus on sarcopenic obesity. Arch Gerontol Geriatr 56, 270–278. [DOI] [PubMed] [Google Scholar]
- Conley TB, Apolzan JW, Leidy HJ, Greaves KA, Lim E & Campbell WW (2011). Effect of food form on postprandial plasma amino acid concentrations in older adults. Br J Nutr 106, 203–207. [DOI] [PMC free article] [PubMed] [Google Scholar]
- Cuthbertson D, Smith K, Babraj J, Leese G, Waddell T, Atherton P, Wackerhage H, Taylor PM & Rennie MJ (2005). Anabolic signaling deficits underlie amino acid resistance of wasting, aging muscle. FASEB J 19, 422–424. [DOI] [PubMed] [Google Scholar]
- Diouf I, Charles MA, Ducimetiere P, Basdevant A, Eschwege E & Heude B (2010). Evolution of obesity prevalence in France: an age‐period‐cohort analysis. Epidemiology 21, 360–365. [DOI] [PMC free article] [PubMed] [Google Scholar]
- Flegal KM, Carroll MD, Kit BK & Ogden CL (2012). Prevalence of obesity and trends in the distribution of body mass index among US adults, 1999–2010. JAMA 307, 491–497. [DOI] [PubMed] [Google Scholar]
- Gutierrez‐Fisac JL, Guallar‐Castillon P, Leon‐Munoz LM, Graciani A, Banegas JR & Rodriguez‐Artalejo F (2012). Prevalence of general and abdominal obesity in the adult population of Spain, 2008–2010: the ENRICA study. Obes Rev 13, 388–392. [DOI] [PubMed] [Google Scholar]
- Hawley JA & Krook A (2016). Metabolism: one step forward for exercise. Nat Rev Endocrinol 12, 7–8. [DOI] [PubMed] [Google Scholar]
- Hector AJ, Marcotte GR, Churchward‐Venne TA, Murphy CH, Breen L, von Allmen M, Baker SK & Phillips SM (2015). Whey protein supplementation preserves postprandial myofibrillar protein synthesis during short‐term energy restriction in overweight and obese adults. J Nutr 145, 246–252. [DOI] [PubMed] [Google Scholar]
- Janssen I, Baumgartner RN, Ross R, Rosenberg IH & Roubenoff R (2004). Skeletal muscle cutpoints associated with elevated physical disability risk in older men and women. Am J Epidemiol 159, 413–421. [DOI] [PubMed] [Google Scholar]
- Kim J, Wang Z, Heymsfield SB, Baumgartner RN & Gallagher D (2002). Total‐body skeletal muscle mass: estimation by a new dual‐energy X‐ray absorptiometry method. Am J Clin Nutr 76, 378–383. [DOI] [PubMed] [Google Scholar]
- Kim PL, Staron RS & Phillips SM (2005). Fasted‐state skeletal muscle protein synthesis after resistance exercise is altered with training. J Physiol 568, 283–290. [DOI] [PMC free article] [PubMed] [Google Scholar]
- Landi F, Liperoti R, Russo A, Giovannini S, Tosato M, Barillaro C, Capoluongo E, Bernabei R & Onder G (2013). Association of anorexia with sarcopenia in a community‐dwelling elderly population: results from the ilSIRENTE study. Eur J Nutr 52, 1261–1268. [DOI] [PubMed] [Google Scholar]
- Lopez‐Otin C, Blasco MA, Partridge L, Serrano M & Kroemer G (2013). The hallmarks of aging. Cell 153, 1194–1217. [DOI] [PMC free article] [PubMed] [Google Scholar]
- Mathus‐Vliegen EM (2012). Prevalence, pathophysiology, health consequences and treatment options of obesity in the elderly: a guideline. Obesity Facts 5, 460–483. [DOI] [PubMed] [Google Scholar]
- Moore DR, Churchward‐Venne TA, Witard O, Breen L, Burd NA, Tipton KD & Phillips SM (2015). Protein ingestion to stimulate myofibrillar protein synthesis requires greater relative protein intakes in healthy older versus younger men. J Gerontol A Biol Sci Med Sci 70, 57–62. [DOI] [PubMed] [Google Scholar]
- Moore DR, Tang JE, Burd NA, Rerecich T, Tarnopolsky MA & Phillips SM (2009). Differential stimulation of myofibrillar and sarcoplasmic protein synthesis with protein ingestion at rest and after resistance exercise. J Physiol 587, 897–904. [DOI] [PMC free article] [PubMed] [Google Scholar]
- Murphy CH, Churchward‐Venne TA, Mitchell CJ, Kolar NM, Kassis A, Karagounis LG, Burke LM, Hawley JA & Phillips SM (2015). Hypoenergetic diet‐induced reductions in myofibrillar protein synthesis are restored with resistance training and balanced daily protein ingestion in older men. Am J Physiol Endocrinol Metab 308, E734–743. [DOI] [PMC free article] [PubMed] [Google Scholar]
- Neese RA, Siler SQ, Cesar D, Antelo F, Lee D, Misell L, Patel K, Tehrani S, Shah P & Hellerstein MK (2001). Advances in the stable isotope‐mass spectrometric measurement of DNA synthesis and cell proliferation. Anal Biochem 298, 189–195. [DOI] [PubMed] [Google Scholar]
- Nicklas BJ, Cesari M, Penninx BW, Kritchevsky SB, Ding J, Newman A, Kitzman DW, Kanaya AM, Pahor M & Harris TB (2006). Abdominal obesity is an independent risk factor for chronic heart failure in older people. J Am Geriatr Soc 54, 413–420. [DOI] [PubMed] [Google Scholar]
- Parr EB, Coffey VG & Hawley JA (2013). ‘Sarcobesity’: a metabolic conundrum. Maturitas 74, 109–113. [DOI] [PubMed] [Google Scholar]
- Price JC, Holmes WE, Li KW, Floreani NA, Neese RA, Turner SM & Hellerstein MK (2012). Measurement of human plasma proteome dynamics with 2H2O and liquid chromatography tandem mass spectrometry. Anal Biochem 420, 73–83. [DOI] [PubMed] [Google Scholar]
- Rennie MJ, Smith K & Watt PW (1994). Measurement of human tissue protein synthesis: an optimal approach. Am J Physiol Endocrinol Metab 266, E298–307. [DOI] [PubMed] [Google Scholar]
- Robinson MM, Turner SM, Hellerstein MK, Hamilton KL & Miller BF (2011). Long‐term synthesis rates of skeletal muscle DNA and protein are higher during aerobic training in older humans than in sedentary young subjects but are not altered by protein supplementation. FASEB J 25, 3240–3249. [DOI] [PMC free article] [PubMed] [Google Scholar]
- Rossi A, Fantin F, Di Francesco V, Guariento S, Giuliano K, Fontana G, Micciolo R, Solerte SB, Bosello O & Zamboni M (2008). Body composition and pulmonary function in the elderly: a 7‐year longitudinal study. Int J Obes (Lond) 32, 1423–1430. [DOI] [PubMed] [Google Scholar]
- Scalzo RL, Peltonen GL, Binns SE, Shankaran M, Giordano GR, Hartley DA, Klochak AL, Lonac MC, Paris HL, Szallar SE, Wood LM, Peelor FF, 3rd, Holmes WE , Hellerstein MK, Bell C, Hamilton KL & Miller BF (2014). Greater muscle protein synthesis and mitochondrial biogenesis in males compared with females during sprint interval training. FASEB J 28, 2705–2714. [DOI] [PubMed] [Google Scholar]
- Shankaran M, King CL, Angel TE, Holmes WE, Li KW, Colangelo M, Price JC, Turner SM, Bell C, Hamilton KL, Miller BF & Hellerstein MK (2016a). Circulating protein synthesis rates reveal skeletal muscle proteome dynamics. J Clin Invest 126, 288–302. [DOI] [PMC free article] [PubMed] [Google Scholar]
- Shankaran M, Shearer TW, Stimpson SA, Turner SM, King C, Wong PA, Shen Y, Turnbull PS, Kramer F, Clifton L, Russell AJ, Hellerstein MK & Evans WJ (2016b). Proteome‐wide muscle protein fractional synthesis rates predict muscle mass gain in response to a selective androgen receptor modulator in rats. Am J Physiol Endocrinol Metab 310, E405–417. [DOI] [PubMed] [Google Scholar]
- Turner SM, Murphy EJ, Neese RA, Antelo F, Thomas T, Agarwal A, Go C & Hellerstein MK (2003). Measurement of TG synthesis and turnover in vivo by 2H2O incorporation into the glycerol moiety and application of MIDA. Am J Physiol Endocrinol Metab 285, E790–803. [DOI] [PubMed] [Google Scholar]
- Vasquez E, Batsis JA, Germain CM & Shaw BA (2014). Impact of obesity and physical activity on functional outcomes in the elderly: data from NHANES 2005–2010. J Aging Health 26, 1032–1046. [DOI] [PMC free article] [PubMed] [Google Scholar]
- Villareal DT, Aguirre L, Gurney AB, Waters DL, Sinacore DR, Colombo E, Armamento‐Villareal R & Qualls C (2017). Aerobic or resistance exercise, or both, in dieting obese older adults. N Engl J Med 376, 1943–1955. [DOI] [PMC free article] [PubMed] [Google Scholar]
- Waters DL, Ward AL & Villareal DT (2013). Weight loss in obese adults 65years and older: a review of the controversy. Exp Gerontol 48, 1054–1061. [DOI] [PMC free article] [PubMed] [Google Scholar]
- West DW, Burd NA, Coffey VG, Baker SK, Burke LM, Hawley JA, Moore DR, Stellingwerff T & Phillips SM (2011). Rapid aminoacidemia enhances myofibrillar protein synthesis and anabolic intramuscular signaling responses after resistance exercise. Am J Clin Nutr 94, 795–803. [DOI] [PubMed] [Google Scholar]
- Wilkinson DJ, Cegielski J, Phillips BE, Boereboom C, Lund JN, Atherton PJ & Smith K (2015). Internal comparison between deuterium oxide (D2O) and l‐[ring‐13C6] phenylalanine for acute measurement of muscle protein synthesis in humans. Physiol Rep 3, e12433. [DOI] [PMC free article] [PubMed] [Google Scholar]
- Wilkinson DJ, Franchi MV, Brook MS, Narici MV, Williams JP, Mitchell WK, Szewczyk NJ, Greenhaff PL, Atherton PJ & Smith K (2014). A validation of the application of D2O stable isotope tracer techniques for monitoring day‐to‐day changes in muscle protein subfraction synthesis in humans. Am J Physiol Endocrinol Metab 306, 571–579. [DOI] [PMC free article] [PubMed] [Google Scholar]
- Wilkinson SB, Phillips SM, Atherton PJ, Patel R, Yarasheski KE, Tarnopolsky MA & Rennie MJ (2008). Differential effects of resistance and endurance exercise in the fed state on signalling molecule phosphorylation and protein synthesis in human muscle. J Physiol 586, 3701–3717. [DOI] [PMC free article] [PubMed] [Google Scholar]