

Abstract
Key points
Cholecystokinin (CCK) via CCK‐B receptors significantly enhances the GABAA receptor‐mediated synaptic inhibition of principal olfactory bulb (OB) output neurons.
This CCK action requires action potentials in presynaptic neurons.
The enhanced inhibition of OB output neurons is a result of CCK‐elevated inhibitory input from the glomerular circuit.
CCK modulation of the glomerular circuit also leads to potentiated presynaptic inhibition of olfactory nerve terminals and postsynaptic inhibition of glomerular neurons.
Selective excitation of short axon cells underlies the CCK‐potentiated glomerular inhibition.
Abstract
Neuropeptides such as cholecystokinin (CCK) are important for many brain functions, including sensory processing. CCK is predominantly present in a subpopulation of excitatory neurons and activation of CCK receptors is implicated in olfactory signal processing in the olfactory bulb (OB). However, the cellular and circuit mechanisms underlying the actions of CCK in the OB remain elusive. In the present study, we characterized the effects of CCK on synaptic inhibition of the principal OB output neurons mitral/tufted cells (MTCs) followed by mechanistic analyses at both circuit and cellular levels. First, we found that CCK via CCK‐B receptors enhances the GABAA receptor‐mediated spontaneous IPSCs in MTCs. Second, CCK does not affect the action potential independent miniature IPSCs in MTCs. Third, CCK potentiates glomerular inhibition resulting in increased GABAB receptor‐mediated presynaptic inhibition of olfactory nerve terminals and enhanced spontaneous IPSCs in MTCs and glomerular neurons. Fourth, CCK enhances miniature IPSCs in the excitatory external tufted cells, although neither in the inhibitory short axon cells (SACs) nor in periglomerular cells (PGCs). Finally, CCK excites all tested SACs and a very small minority of GABAergic neurons in the granule cell layer or in periglomerular cells, but not in deep SACs. These results demonstrate that CCK selectively activates SACs to engage the SAC‐formed interglomerular circuit and thus elevates inhibition broadly in the OB glomerular layer. This modulation may prevent the system from saturating in response to a high concentration of odourants or facilitate the detection of weak stimuli by increasing signal‐to‐noise ratio.
Keywords: cholecystokinin, neuromodulation, inhibitory synaptic transmission, olfactory bulb
Key points
Cholecystokinin (CCK) via CCK‐B receptors significantly enhances the GABAA receptor‐mediated synaptic inhibition of principal olfactory bulb (OB) output neurons.
This CCK action requires action potentials in presynaptic neurons.
The enhanced inhibition of OB output neurons is a result of CCK‐elevated inhibitory input from the glomerular circuit.
CCK modulation of the glomerular circuit also leads to potentiated presynaptic inhibition of olfactory nerve terminals and postsynaptic inhibition of glomerular neurons.
Selective excitation of short axon cells underlies the CCK‐potentiated glomerular inhibition.
Introduction
Neuropeptides are small protein‐like molecules that ubiquitously exist in the nervous system and play important roles in many brain functions (van den Pol, 2012; Nusbaum et al. 2017). Cholecystokinin (CCK) was initially identified as a gastrointestinal peptide and subsequently found to be widely present in the CNS. This neuropeptide is heavily involved in a variety of normal behaviours and neurological or neuropsychiatric disorders, including learning and memory, feeding, nociception, satiety, anxiety, panic attacks, deficits in fear extinction and schizophrenia (Ghijsen et al. 2001; Lee & Soltesz, 2011).
Multiple lines of evidence suggest that CCK plays important roles in olfactory signal processing. First, CCK mRNA and immunoreactivity are present in the olfactory bulb (OB) across animal species (Rehfeld, 1978; Larsson & Rehfeld, 1979; Vanderhaeghen et al. 1980; Seroogy et al. 1985; Ingram et al. 1989; Schiffmann & Vanderhaeghen, 1991; Ghijsen et al. 2001; Gutierrez‐Mecinas et al. 2005; Baltanas et al. 2011; Cheetham et al. 2015). At the cellular level, intense and conservative CCK immunoreactivity is predominantly confined to a subpopulation of OB neurons termed superficial tufted cells (STCs) (Schoenfeld et al. 1985; Liu & Shipley, 1994), which express the classic neurotransmitter glutamate (Yoo et al. 2006; Gabellec et al. 2007; Ohmomo et al. 2009). Interestingly, mirror glomeruli (which receive axonal projection from olfactory sensory neurons expressing the same type of odourant receptors and are located on the medial and lateral sides of each bulb) are interconnected mainly by the CCK‐expressing STCs (Schoenfeld et al. 1985; Liu & Shipley, 1994; Lodovichi et al. 2003; Zhou & Belluscio, 2008). These CCKergic STCs are topographically organized such that the single apical dendrite of each STC ramifies in a single glomerulus, whereas its axon projects and terminates in the internal plexiform layer (IPL) right beneath the mirror glomerulus on the opposite side of the same bulb (Schoenfeld et al. 1985; Liu & Shipley, 1994). Collectively, all of these findings strongly suggest that CCK modulates signal processing in the mirror glomeruli.
Second, CCK receptors (especially the CCK‐B subtype) are widely distributed in the OB (Zarbin et al. 1983; Van Dijk et al. 1984; Mercer et al. 2000), indicating that CCK can act on local neurons and related neural circuits. Consistently, systemic administration of CCK‐8S, the predominant form of CCK in the CNS, significantly reduces the glutamate level in the OB (Acosta, 1998). This could be a result of direct CCK inhibition of the glutamatergic neurons in the OB to reduce glutamate release. Alternatively, CCK could directly excite local inhibitory neurons, which inhibit glutamate release from excitatory OB neurons. Third, fasting in mice upregulates CCK receptor expression selectively in the OB and hypothalamus (Saito et al. 1981). This upregulation of CCK receptors might be compensatory because fasting reduces food odour stimulation, indicating the active roles of CCK in the OB. Finally, behavioural studies show that systemic administration of a CCK‐A receptor agonist or a CCK‐B receptor antagonist enhances olfactory recognition, suggesting that CCK is involved in olfactory signal processing (Lemaire et al. 1994a, b).
However, the physiological actions of CCK at the cellular and circuit levels in the OB remain unclear. A recent study showed that CCK produced excitatory or excitatory followed by inhibitory actions on mitral cells (Ma et al. 2013), which are the principal OB output neurons. However, the CCK concentration used in that study was relatively high (1 μm) given that neuropeptides are normally released from neurons at extremely low concentrations in the nanomolar range (Ghijsen et al. 2001; van den Pol, 2012). Furthermore, CCK is reported to modulate synaptic inhibition in the OB. For example, systemic administration of CCK‐8S reduced the GABA concentration selectively in the OB (Acosta, 2001), indicating direct or indirect actions of CCK on the inhibitory neurons. Axons of the CCK‐containing STCs form synaptic connections with dendrites of the inhibitory granule cells (GCs) in the IPL of the OB (Liu & Shipley, 1994), implying that STCs release CCK to act on GCs. Thus, the main objective of the present study was to systematically examine the actions of a low concentration (nanomolar range) of CCK on synaptic inhibition of the OB output neurons followed by an analysis of the underlying cellular and circuit mechanisms.
Methods
Ethical approval
All animal experiments were approved by the Institutional Animal Care and Use Committee (IACUC) of the University of Maryland at Baltimore and were conducted in accordance with the American Veterinary Medicine Association and the National Institutes of Health guidelines. Experimental work conforms with the principles and standards of reporting animal experiments as described in Grundy (2015).
Animals
Wild‐type male and female mice (C57BL/6J) were obtained from Charles River (Frederick, MD, USA). The GAD2gfp mice were obtained courtesy of Dr Gabor Szabo (Lopez‐Bendito et al. 2004) from the line GAD65_3e/gfp5.5 #30 on a genetic background of C57BL6 with a backcross to B6CBAF1/J wild‐type mice yielding mice heterozygous for the transgene. Tyrosine hydroxylase (TH)‐green fluorescent protein (GFP) mice were obtained courtesy of Dr Kobayashi (Matsushita et al. 2002), as generated using a 9.0 kb 5′‐flanking region of the TH gene on a genetic background of C57BL/6J × DBA/2J backcrossed to C57BL/6J yielding mice heterozygous for the transgene. Chrna2‐Cre mice (line OE29) were obtained from GENSAT (Gong et al. 2007) and bred with C57BL/6 mice (Madisen et al. 2010) to generate heterozygous mice. All animals were maintained under a standard 12:12 h light/dark cycle and given food and water ad libitum.
Slice preparation
Acute OB slices were prepared from 6–8‐week‐old male or female mice as described previously (Liu & Shipley, 2008). Briefly, animals were deeply anaesthetized with isoflurane using the IACUC‐approved drop method before decapitation. Then OBs were rapidly dissected and mounted onto the specimen disc of a VT1200S vibratome (Nussloch, Germany) using superglue. Horizontal OB slices (350 μm) were cut in an ice‐cold and oxygenated (95% O2–5% CO2) sucrose‐based artificial CSF (sucrose‐aCSF) containing (in mm) 210 sucrose, 3 KCl, 1.2 NaH2PO4, 2.6 MgSO4, 0.5 CaCl2, 26 NaHCO3 and 10 glucose. After 30 min of incubation in normal aCSF at 30°C, slices were then transferred to aCSF at room temperature until they were used for recordings. Normal aCSF was continuously bubbled with 95% O2–5% CO2 and had the composition (in mm): 124 NaCl, 3 KCl, 1.25 NaH2PO4, 2.0 MgSO4, 2.0 CaCl2, 26 NaHCO3 and 10 glucose. During the experiments, slices were perfused at 3 mL min−1 with aCSF equilibrated with 95% O2–5% CO2 and warmed to 30°C.
Electrophysiology
Whole cell patch clamp recordings were made from OB neurons visualized using BX50WI (Olympus, Tokyo, Japan) fixed‐stage upright epifluorescence microscope equipped with near‐infrared differential interference contrast (DIC) optics. Short axon (SACs) and periglomerular cells (PGCs) were identified by their expression of TH‐ or GAD65‐enhanced GFP, respectively.
External tufted cells (ETCs) were initially reported in Golgi anatomy studies (Romon y Cajal, 1909–1911; Pinching & Powell, 1971a, b; Macrides & Schneider, 1982). Recently, ETCs were more rigorously characterized by correlating their morphological and electrophysiological properties (Hayar et al. 2004b; Antal et al. 2006). Based on these studies, we identified ETCs with three criteria: (i) spontaneous intrinsic burst firing that persists even when fast synaptic transmitter receptors are blocked; (ii) ‘pear’‐shaped cell body located in the deep half of the glomerular layer when viewed in near‐IR DIC optics; and (iii) an apical dendrite with extensively ramified tuft confined to the glomerulus and absence of lateral dendrites in the external plexiform layer (EPL).
To visualize the recorded mitral/tufted cells (MTCs) and their apical dendrite tufts in the glomerular layer, lucifer yellow (0.1%, w/v) or Alexa‐594 (5 μm) was included in the internal solution. Current or voltage signals were recorded with a MultiClamp 700B amplifier (Molecular Devices, Palo Alto, CA, USA) and low‐pass filtered at 4 kHz and sampled at 10 kHz with a DIGIDATA 1322A 16‐bit analogue‐to‐digital converter (Molecular Devices) using Clampex, version 10.3 (Molecular Devices). Patch recording electrodes were pulled from standard‐wall glass capillary tubes without a filament (Sutter Instrument Co., Novato, CA, USA). Patch pipettes (4–7 MΩ) for whole cell current clamp recording contained (in mm) 115 K‐gluconate, 5.0 EGTA, 0.63 CaCl2, 5.5 MgCl2, 10 Hepes, 3 Na2‐ATP, 0.3 Na3‐GTP and 14 Tris‐phosphocreatine (pH 7.3, 285–295 mOsm). Biocytin (0.2%, w/v) was added to pipette solution before use as needed. aCSF was used as pipette solution for cell‐attached recording. To optimize the recording of IPSCs, cells were voltage clamped at 0 mV with internal solution containing (in mm): 133 CsCH3O3S, 3 EGTA, 0.4 CaCl2, 5 QX‐314, 4 MgCl2, 10 Hepes, 3 Na2‐ATP and 0.3 Na3‐GTP (pH 7.3, 285–295 mOsm). When the GABAA receptor blocker gabazine (GBZ) was bath‐applied, the fast glutamate receptor blockers 2,3‐dioxo‐6‐nitro‐1,2,3,4‐tetrahydrobenzo[f]quinoxaline‐7‐sulphonamide disodium salt (NBQX), (10 μm) and dl‐2‐amino‐5‐phosphonopentanoic acid sodium salt (APV) (50 μm) were pre‐applied to prevent epileptic activity (Isokawa, 1996).
Electrical stimulation
Electrical stimulation was delivered by bipolar glass electrodes made from theta borosilicate tubes (Sutter Instrument Co.). The isolated and constant current stimulation pulses (100 μs) were triggered by a PG4000A digital stimulator (Cygnus Technology, Delaware Water Gap, PA, USA) or a Master‐8 stimulator (AMPI, Jerusalem, Israel).
Immunochemical staining
OB slices with biocytin (0.2%, w/v)‐filled cells were immediately kept in 4% paraformaldehyde at 4°C overnight. After three (5 min each) washes with 0.05 m phosphate‐buffered saline (PBS), slices were incubated in a blocker solution on a shaker for 1 h. Blocker solution was made by 0.05 m PBS with the addition of bovine serum albumin and Triton X‐100 with final concentrations of 1% (w/v) and 0.5% (v/v), respectively. The slices were then transferred to and kept in this blocker solution containing streptavidin‐CY3 (1 μg mL−1) covered with aluminum foil to prevent light exposure at room temperature on a shaker for 7 h. Following three (5 min each) rinses with 0.05 m PBS to terminate streptavidin‐CY3 staining, slices were treated with 0.05 m PBS containing 4′,6‐diamidino‐2‐phenylindole (DAPI) (5 μg mL−1) at room temperature in the dark for 10 min. DAPI staining was terminated by three (5 min each) washes with PBS before slices was wet mounted and cover‐slipped with fluorescence mounting media. Biocytin‐filled cells with CY3 staining were scanned and reconstructed under a confocal microscope.
Statistical analysis
All numerical data are presented as the mean ± SEM. Automatic detection of spontaneous IPSCs (sIPSCs) or miniature IPSCs (mIPSCs) was performed with MiniAnalysis (Synaptosoft, Inc., Decatur, GA, USA) or Wdetecta (https://hlab.stanford.edu/wdetecta.php) followed by manual checks to ensure accuracy with the following primary parameters: a pre‐set threshold (3 SDs above baseline noise) was used with MiniAnalysis and a differentiation trigger threshold at 3 pA ms−1 as well as a 5 pA amplitude threshold for WDetecta. Instantaneous frequencies of sIPSCs or mIPSCs were calculated from the peak timestamp values of each events in Excel (Microsoft, Redmond, WA, USA). Action potentials were detected in Clampfit, version 10.3 (Molecular Devices) using a detection threshold of −40 mV (Figs 4 and 8) to exclude EPSP detection or a detection threshold of −20 pA relative to baseline for cell‐attached data (Fig. 9). Drug effects on frequency or amplitude of sIPSCs or mIPSCs were determined by comparing measurements from 1 min duration traces taken immediately before, 1 min (micropuffing) or 2 min (bath application) after drug application, or 10 min after drug washout for each cell. Other data were measured and analysed using Clampfit, version 10.7 (Molecular Devices), SigmaPlot, version 9.0 (Systat software, Inc., San Jose, CA, USA) and Origin Pro 2017 (Origin Lab, Northampton, MA, USA). Statistical significance of the population responses was determined using a paired Student's t test, one‐way ANOVA, or one‐way repeated measures ANOVA with Bonferroni post hoc comparisons in Origin Pro 2017. A paired Student's t test was chosen for comparing data examining the effects of CCK on the same group of cells, such as mitral cell intrinsic properties, cell firing rate (Figs 4 D, E, 8 F and 9 D) or paired‐pulse ratio (PPR) of olfactory nerve (ON)‐evoked EPSCs in ETCs (Fig. 10 F). One‐way ANOVA was used to compare data of the same measurement among different groups of cells, such as changes in frequency or amplitude of sIPSCs by different doses of CCK in different groups of mitral cells (Fig. 1 F and G) and the amplitude of inward currents induced by different doses of CCK in the absence or presence of CCK receptor antagonist (Fig. 8 D). One‐way repeated measures ANOVA with Bonferroni post hoc comparisons was employed to compare multiple (i.e. more than two) measurements of the same group of cells.
Figure 4. CCK has no effect on vast majority of GABAergic cells in the granule cell layer.

A, confocal photo of a typical biocytin‐filled GC stained by streptoavidin‐CY3 (red) in an OB slice counterstained with DAPI (white). ONL, olfactory nerve layer; GL, glomerular layer; EPL, external plexiform layer; MCL, mitral cell layer; IPL, internal plexiform layer; GCL, granule cell layer. B, a typical current clamp trace showing that CCK‐8S (200 nm) does not change spontaneous firing activity in a cell in the presence of NBQX, APV and GBZ to block circuit influence. C, top: current clamp trace showing that CCK (200 nm) increases spontaneous firing in a different cell under the same condition. Bottom: magnified traces at an expanded time scale from the top trace. D, a scatter plot showing the relationship of cell firing rates before and after CCK‐8S (200 nm) is added to the bath in 61 cells. Note: CCK treatment does not alter the firing rate of a vast majority (56/61, black circles) and, instead, only that of five (5/61, green circles) cells. E, quantified data showing the dose‐dependency of CCK‐8S action on GC firing activity. Note: 50 nm CCK does not affect the firing rate in any of 31 cells (0/31), whereas 200 nm CCK significantly increases the firing rate in a very small portion of cells (5/61) but not in the remaining vast majority (56/61). F, quantified data graph showing the effects of 200 nm CCK‐8S on the firing rate of the non‐responsive (NR) and responsive (R) cells shown in (E). Red and green lines in (E) and (F) represent data from the cell shown in (A) and responsive cells, respectively.
Figure 8. CCK preferentially excites SACs.

A, current clamp traces showing that bath‐applied CCK‐8S (200 nm, red bar) increases the spontaneous firing of SACs. B, quantified data showing the effects of CCK‐8S at 50 nm or 200 nm on the spontaneous firing rate of SACs. C, voltage clamp traces showing that bath‐applied CCK‐8S (200 nm) produces an inward current (dark green trace) in a SAC in the presence of NBQX, APV and GBZ but no current in another SAC pretreated with CI988 (10 μm, blue trace) for 10 min. D, pooled data showing the amplitude of the inward current induced by 50 nm, 200 nm or 200 nm CCK in the presence of the selective CCK‐B receptor antagonist CI988 (10 μm). E, current clamp traces showing that bath‐applied CCK‐8S (200 nm, red bar) has no effect on the spontaneous firing of a PGC. F, quantified data showing the effects of CCK at 50 nm or 200 nm on the spontaneous firing rate in PGCs.
Figure 9. CCK does not affect excitability of deep SACs.

A, top: confocal photo showing EYFP‐ChR2 expression in dSACs of the Chrna2‐Cre mouse olfactory bulb. Bottom: magnification of the squared area in the top photo showing dSAC somas located in the superficial granule cell layer. Note: intense EYFP expression in the glomerular layer that receives axon projections of dSACs. B, cell‐attached recording trace showing that blue laser light (473 nm) exposure elicits high‐frequency firing in the recorded dSAC, demonstrating functional ChR2 expression. C, cell‐attached recording traces showing dSAC firing activity without (pre‐CCK) or with CCK‐8S (200 nm, CCK) in the bath in the presence of NBQX, APV and GBZ. D, quantified data showing that CCK‐8S does not affect firing activity of dSACs (n = 7).
Figure 10. CCK elevates presynaptic inhibition of the first synapse in the olfactory system.

A, top: schematic drawing showing the experimental design by which synaptic responses of ETCs to electrical stimulation of the ONs are recorded in OB slices. Stim., stimulating electrode; Rec., recording electrode. Bottom: voltage clamp recording traces showing that ON stimulation produces reliably short onset latency EPSCs in a ETC in aCSF (black), in the presence (+CCK, red) or after washout (–CCK, cyan) of 200 nm CCK‐8S, or in the presence of NBQX and APV (+N&A, green). B, graph showing time‐course changes in the amplitude of the ON‐evoked EPSCs in the same ETC shown in (A) after bath application CCK‐8S or NBQX and APV (N&A). C, graph showing that bath application CCK‐8S does not alter amplitude of the ON‐evoked EPSCs in a different ETC pretreated with 10 μm CGP55845, a selective antagonist of GABAB receptors. D, quantified data showing that the ON‐ETC EPSCs are reversibly inhibited by bath‐applied CCK‐8S in aCSF or completely blocked by NBQX and APV (N&A) (n = 7 cells) but are not altered by CCK‐8S in the presence of 10 μm CI988 (n = 6 cells) or 10 μm CGP55845 (CGP, n = 7 cells). E, voltage clamp traces showing EPSCs in a typical ETC evoked by paired‐pulse ON stimuli at 50 ms interval before (aCSF), during (CCK) or after CCK washout. F, graph showing that paired‐pulse ratio (PPR) of the ON‐ETC EPSCs is reversibly increased by bath‐applied CCK‐8S in aCSF (n = 7 cells) but is not altered by CCK‐8S in the presence of 10 μm CI988 (n = 6 cells) or 10 μm CGP55845 (CGP) (n = 7 cells).
Figure 1. CCK enhances synaptic inhibition of MTCs.

A, typical MTC filled with Alexa594 via the recording pipette showing its intact apical dendrites. Scale bar = 30 μm. B, top trace shows that bath‐applied CCK‐8S (CCK) (200 nm, red bar) reversibly enhances sIPSCs in a MTC voltage clamped at 0 mV in the presence of NBQX and APV. Bottom traces are magnifications from different time points of the top trace. C, CCK‐8S (200 nm, red bar) shows no effect when sIPSCs are completely eliminated by the selective GABAA receptor blocker GBZ (10 μm, black bar). D and E, accumulative probability graph showing that CCK‐8S reversibly increases the both frequency (C) and amplitude (D) of sIPSCs in MTCs (n = 8). F and G, quantified data showing the actions of CCK‐8S in a concentration range of 50–500 nm on sIPSC frequency (E) and amplitude (F) in eight MTCs. Cyan coloured lines represent data shown in (B) and recorded from the dye‐filled cell shown in (A).
Drug delivery and chemicals
Drugs were either bath applied or micropuffed to the target glomeruli by 30 psi pneumatic pressure via a picospritzer (Parker Instruments, Cleveland, OH, USA) for 2 ms. Micropuffing pipettes (6‐μm tip opening) were made from thick wall borosilicate glass capillaries without a filament (Sutter Instrument Co.). These parameters were calibrated to deliver an injection volume of ∼20 nL and were previously shown to block inhibition restricted to a single glomerulus (Shao et al. 2012).
APV (50 μm), NBQX (10 μm), GBZ (SR95531, 10 μm), octahydro‐12‐(hydroxymethyl)‐2‐imino‐5,9:7,10a‐dimethano‐10aH‐[1,3]dioxocino[6,5‐d]pyrimidine‐4,7,10,11,12‐pentol citrate (TTX citrate) (1 μm), cholecystokinin octapeptide sulphated form (CCK‐8S) (50–500 nm), N‐[(1,1‐dimethylethoxy)carbonyl]‐L‐tryptophyl‐N6‐[[(2‐methylphenyl)amino]carbonyl]‐L‐lysyl‐L‐α‐aspartyl‐Nα‐methyl‐L‐phenylalaninamide (A‐71623) (5 μm), 4‐[[(1R)‐2‐[[(2R)‐3‐(1H‐indol‐3‐yl)‐2‐methyl‐1‐oxo‐2‐[[(tricyclo[3.3.1.13,7]dec‐2‐yloxy)carbonyl]amino]propyl]amino]‐1‐phenylethyl]amino]‐4‐oxobutanoic acid (CI988) (10 μm), 2‐[[[4‐(2‐chlorophenyl)‐2‐thiazolyl]amino]carbonyl]‐1H‐indole‐1‐acetic acid (SR27897) (5 μm) and (3‐aminopropyl)ethylphosphinic acid hydrochloride (CGP36216) (20 μm), (R)‐4‐amino‐3‐(4‐chlorophenyl)butanoic acid (baclofen, 10 μm) were purchased from Tocris Cookson (Ellisville, MO, USA). CY3‐conjugated Streptavidin was obtained from Jackson ImmunoResearch Laboratories Inc. (West Grove, PA, USA). Cholecystokinin fragment 30–33 amide (CCK‐4) (100 nm) and all other chemicals were purchased from Sigma‐Aldrich (St Louis, MO, USA). All drugs were dissolved in distilled water as stock solution and diluted 1000 times with aCSF to the final concentrations.
Results
Dose‐dependent enhancement of synaptic inhibition of MTCs
To measure synaptic inhibition of the OB output neurons, we recorded sIPSCs in MTCs. Each MTC has only one apical dendrite ramifying in a single glomerulus to receive synaptic input from local inhibitory interneurons (Pinching & Powell, 1971b; Urban & Sakmann, 2002; Aungst et al. 2003; Vucinic et al. 2006; Shao et al. 2012; Banerjee et al. 2015; Najac et al. 2015; Economo et al. 2016; Geramita & Urban, 2016; Liu et al. 2016) and multiple basal dendrites coursing laterally in the EPL to receive synaptic inhibition from GCs (Isaacson & Strowbridge, 1998; Shepherd et al. 2007). In addition, MTCs also receive synaptic input from inhibitory interneurons in the EPL (Lepousez et al. 2010; Huang et al. 2013; Kato et al. 2013; Miyamichi et al. 2013). Thus, sIPSCs in MTCs may reflect synaptic inhibition from the glomerular circuit, EPL interneurons and GCs. The single apical dendrites of MTCs course through a long distance in the EPL before reaching the glomerular layer and thus are susceptible to truncation during slice preparation. To ensure recording from MTCs with intact apical dendrites to receive input from the glomerular circuit, we included the fluorescent dye Alexa‐594 (5 μm) or lucifer yellow (0.1%, w/v) in the patch pipette to visualize the recorded cells (Fig. 1 A). To improve the quality of voltage clamp recording, Cs+‐based internal solution containing QX314 was used to block K+ and Na+ channels in the recorded cells. To maximize sIPSC detection and minimize excitatory synaptic currents or circuit influence, cells were voltage clamped at 0 mV in the presence of the selective AMPA receptor blocker NBQX and the NMDA receptor blocker APV throughout all related experiments unless stated otherwise. Under these conditions, spontaneous outward synaptic currents were observed in all recorded MTCs (Fig. 1 B). These outward synaptic currents were completely eliminated by the selective GABAA receptor blocker GBZ (10 μm) (Fig. 1 C), corroborating that they are GABAA receptor‐mediated sIPSCs. Bath application of 500 nm CCK‐8S (CCK), the predominant form of CCK in the CNS (Lee & Soltesz, 2011), significantly enhanced sIPSCs in all recorded MTCs with intact apical dendrites (n = 8) (Fig. 1 A and B). sIPSC frequency and amplitude were increased by 293.1 ± 34.4% (n = 8, P < 0.0001) (Fig. 1 D and F) from 22.2 ± 6.4 Hz to 92.7 ± 12.5 Hz (n = 8, P < 0.0001) and 188.5 ± 30.5% (n = 8, P < 0.0001) (Fig. 1 E and G) from 35.7 ± 5.2 pA to 93.6 ± 12.7 pA (n = 8, P < 0.0001), respectively. These effects were mostly reversed after CCK washout (Fig. 1 B and D–G). Changes in sIPSC frequency and amplitude at 10 min following CCK washout were 20.2 ± 4.0% (27.7 ± 5.9 Hz, n = 8, P = 1.0) (Fig. 1 F) and 10.5 ± 5.1% (40.3 ± 6.9 pA, n = 8, P = 1.0) (Fig. 1 G) of their pre‐CCK levels, respectively. By contrast, in the presence of NBQX, APV and GBZ to block circuit influence, CCK showed no effect on the holding current (Fig. 1 C), indicating that CCK has no effect on MTCs per se under our conditions. However, this prediction contradicted a recent report that CCK at 1 μm excited majority of MTCs (Ma et al. 2013). Considering that cesium and QX‐314 in the voltage clamp pipette solution non‐selectively block K+, Na+ and other ion channels (Perkins & Wong, 1995; Talbot & Sayer, 1996), we then examined the effects of CCK on the intrinsic electrophysiological properties of a separate sets of MTCs with intact apical dendrites in current clamp with K+‐based intracellular solution containing no QX‐314 in the presence of NBQX, APV and GBZ to eliminate circuit influence. However, under these conditions, CCK‐8S (500 nm) showed no significant effects on any of the MTCs tested. The spontaneous firing rate, resting membrane potential and input resistance were 19.6 ± 3.4 Hz, −57.2 ± 2.1 mV and 109.5 ± 6.6 MΩ before CCK, 19.4 ± 3.4 Hz (n = 9, P = 0.5911), −57.7 ± 2.0 mV (n = 9, P = 0.1342) and 110.5 ± 6.6 MΩ (n = 9, P = 0.2336) during CCK‐8S treatment, respectively. These results suggest that CCK does not alter MTC intrinsic electrophysiological properties under our experimental conditions.
One characteristic of neuropeptides is that they are released in extremely small quantities, generally resulting in a concentration of less than 100 nm with respect to binding and activating their corresponding receptors (Ghijsen et al. 2001; Lee & Soltesz, 2011; van den Pol, 2012). Thus, we next examined the actions of CCK at different lower concentrations (50–200 nm). As shown in Fig. 1 F and G, CCK‐8S exhibited relatively dose‐dependent actions on sIPSCs in MTCs. At 50 nm, CCK increased sIPSC frequency and amplitude by 52.7 ± 16.4% (n = 8, P = 0.0075 compared to pre‐CCK) from 19.2 ± 4.6 Hz to 28.9 ± 5.1 Hz (n = 8, P = 0.0134) and 19.9 ± 6.8% (n = 8, P = 0.0174 compared to pre‐CCK) from 40.5 ± 3.7 pA to 49.3 ± 2.9 pA (n = 8, P = 0.043), respectively. After washout of CCK, changes in sIPSC frequency and amplitude returned to 3.9 ± 3.5% (20.8 ± 5.4 Hz, n = 8, P = 0.2741 compared to pre‐CCK) (Fig. 1 F) and 3.2 ± 1.7% (42.1 ± 7.5 pA, n = 8, P = 1.0 compared to pre‐CCK) (Fig. 1 G), supporting the reversibility of the actions of CCK. Collectively, our findings demonstrate that, by activating CCK‐B receptors, CCK enhances GABAA receptor‐mediated synaptic inhibition of MTCs with intact apical dendrites.
CCK‐B receptors mediate the effects of CCK on synaptic inhibition of MTCs
The action of CCK is mediated the G protein‐coupled CCK‐A and CCK‐B receptors (Wank, 1995), of which CCK‐B receptors are the predominant type widely expressing in the CNS. To determine which type of CCK receptors mediated the actions of CCK on sIPSCs in MTCs, we first examined the actions of CCK4, a relatively selective CCK‐B receptor agonist. Bath‐applied 100 nm CCK‐4 (n = 7) produced a reversible enhancement of sIPSCs (Fig. 2 A). The frequency and amplitude of sIPSCs were increased by 250.7 ± 30.8% (P < 0.0001 compared to Pre‐CCK‐4, P = 1.0 compared to CCK) (Fig. 2 C) from 31.7 ± 4.9 Hz to 112.5 ± 10.6 Hz (n = 7, P < 0.0001) and 195.9 ± 31.0% (P < 0.0001 compared to Pre‐CCK‐4, P = 1.0 compared to CCK) (Fig. 2 D) from 38.1 ± 4.2 pA to 115.3 ± 9.4 pA (n = 7, P < 0.0001), respectively. This indicates that activation of CCK‐B receptors contributes to the CCK enhancement of sIPSCs in MTCs. Parallel with this, the selective CCK‐B receptor antagonist CI988 (formerly PD134308) (Hughes et al. 1990) completely blocked the actions of CCK on sIPSCs in MTCs (Fig. 2 B–D). In the presence of 10 μm CI988, bath‐applied 500 nm CCK‐8S increased neither frequency (by 5.9 ± 3.0% from 17.9 ± 5.8 Hz to 18.4 ± 5.1 Hz, P = 1.0 compared to Pre‐CCK, P < 0.0001 compared to CCK without CI988, n = 8), nor amplitude (by 4.2 ± 3.9% from 23.9 ± 4.5 pA to 25.1 ± 5.2 pA, P = 1.0 compared to Pre‐CCK, P < 0.0001 compared to CCK without CI988) of sIPSC in 8 MTCs. By contrast, CCK‐8S (500 nm) increased sIPSC frequency and amplitude by 270.8 ± 27.1% (n = 7, P = 1.0 compared to CCK alone, P < 0.0001 compared to Pre‐CCK) (Fig. 2 C) from 26.6 ± 4.9 Hz to 106.5 ± 10.1 Hz (P < 0.0001) and 176.2 ± 27.8% (n = 7, P = 1.0 compared to CCK‐8S alone, P < 0.0001 compared to Pre‐CCK) (Fig. 2 D) from 38.5 ± 7.4 pA to 125.6 ± 11.1 pA (P < 0.0001) in the presence of the selective CCK‐A receptor antagonist SR27897 (20 μm) (Gully et al. 1993; Poncelet et al. 1993). Consistently, the selective CCK‐A agonist A71623 (Lin et al. 1991) at 10 μm changed neither frequency (by 3.4 ± 3.8% from 18.2 ± 5.5 Hz to 18.8 ± 6.1 Hz, P = 1.0 compared to Pre‐A71623) (Fig. 2 C), nor amplitude (by 4.4 ± 4.1% from 29.6 ± 3.8 pA to 30.7 ± 4.5 pA, P = 1.0 compared to Pre‐A71623) (Fig. 2 D) of sIPSCs in seven MTCs. Taken together, these results demonstrate that CCK potentiates the GABAA receptor‐mediated sIPSCs in MTCs by activating CCK‐B receptors, indicating that CCK increases GABA release from OB inhibitory interneurons.
Figure 2. CCK effect on sIPSCs in MTCs is mediated by CCK‐B receptors.

A, typical trace showing that bath‐applied CCK‐4 (100 nm, purple bar) reversibly increases sIPSCs in a MTC. B, typical trace showing that bath‐applied CCK‐8S (500 nm, red bar) exhibits no effect on sIPSCs in a MTC in the presence of CI988 (10 μm, blue bar), a selective CCK‐B receptor antagonist. C and D, quantified data showing changes in sIPSC frequency (C) and amplitude (D) by CCK‐8S (CCK) (500 nm) (n = 8), CCK‐4 (100 nm) (n = 7), CI988 plus CCK‐8S (CI+CCK) (n = 8), SR27897 (10 μm) plus CCK‐8S (SR+CCK) (n = 7), or A‐71623 (10 μm) (n = 7), a selective CCK‐A receptor agonist.
CCK does not affect the action potential independent mIPSCs in MTCs
Increasing evidence suggests that spontaneous and action potential‐evoked neurotransmitter releases are regulated by different molecular machineries (Ramirez & Kavalali, 2011; Kaeser & Regehr, 2014; Kavalali, 2015). The sIPSCs recorded in MTCs are potentially mediated by both spontaneous and action potential‐evoked GABA release from different subtypes of OB inhibitory interneurons (Fig. 3 A), many of which fire spontaneous action potentials in vitro (Castillo et al. 1999; Hayar et al. 2004b; Eyre et al. 2008; Burton et al. 2017). To test whether the actions of CCK on synaptic inhibition of MTCs were action potential‐dependent, we examined the effects of CCK on mIPSCs in MTCs with intact apical dendrites (Fig. 3 B). mIPSCs were recorded under the same conditions as in the preceding sIPSC experiments but in the presence of the selective sodium channel blocker TTX (1 μm) to eliminate action potentials (Fig. 3 C). mIPSCs was completely blocked by 10 μm GBZ (Fig. 3 C, bottom trace), indicating that they are mediated by GABAA receptors. Thus, mIPSCs in MTCs reflect action potential independent GABA release from inhibitory OB interneurons. Under these conditions, 500 nm CCK exhibited no effect on mIPSCs in MTCs (Fig. 3 C, top and middle traces). Average mIPSC frequency and amplitude in 10 MTCs were 7.3 ± 2.7 Hz and 27.0 ± 2.4 pA before CCK (pre‐CCK), 6.4 ± 1.8 Hz (P = 0.5774 compared to pre‐CCK) (Fig. 3 D and F) and 25.4 ± 2.5 pA (P = 0.0725 compared to pre‐CCK) (Fig. 3 E and G) in the presence of CCK‐8S, respectively. Taken together, these results demonstrate that CCK does not affect mIPSCs in MTCs, indicating that CCK elevates synaptic inhibition of MTCs by increasing the spike firing of presynaptic inhibitory interneurons.
Figure 3. CCK does not affect mIPSCs in MTCs.

A, schematic drawing showing potential action sites of CCK on presynaptic glomerular interneurons to enhance GABA release and increase action potential (AP)‐dependent or independent IPSCs in postsynaptic glomerular neurons. B, typical Alexa594‐filled MTC with an intact apical dendrite. Scale bar = 40 μm. C, top: typical recording trace showing that bath‐applied CCK‐8S (200 nm) affects neither frequency, nor amplitude of mIPSCs in the MTC shown in (B) and voltage clamped at 0 mV in the presence of NBQX, APV and TTX (1 μm). Middle: magnified traces with an expanded time scale at different time points of the top trace. Bottom: recording trace showing that mIPSCs are completely blocked by bath‐applied GBZ. D and E, accumulative probability graph showing that CCK‐8S (200 nm) alters neither frequency (C), nor amplitude (D) of mIPSCs in 10 MTCs. F and G, quantified data showing that CCK‐8S alters neither frequency (D), nor amplitude (E) of mIPSCs in six MTCs with intact apical dendrites. Green lines represent data shown in (C) and recorded from the cell shown in (B).
GCs contribute little to the effects of CCK on sIPSCs in MTCs
MTC lateral dendrites establish reciprocal dendrodendritic synapses with GABAergic GCs in the EPL and thus receive inhibitory input from these inhibitory interneurons (Isaacson & Strowbridge, 1998; Shepherd et al. 2007). GCs also form synaptic connections in the IPL with axons of the CCKergic STCs projecting from the opposite side of the same bulb (Schoenfeld et al. 1985; Liu & Shipley, 1994). Hence, exogenous CCK or endogenous CCK released from the CCKergic STCs potentially acts on GCs to enhance synaptic inhibition of MTCs.
To test this idea, we next examined the direct effects of CCK on GC excitability in current clamp with synaptic transmission blockers NBQX, APV and GBZ in the bath to eliminate circuit influence. Current clamp recordings were made from cells with relatively small soma sizes in the GC layer of OB slices prepared from GAD65‐GFP mice. Considering the presence of GABAergic non‐GC interneuron types in the GC layer (Schneider & Macrides, 1978; Pressler & Strowbridge, 2006), we performed post hoc reconstruction of a subset of these GAD65‐labelled cells in the GC layer following biocytin‐filling through patch pipettes. The vast majority (15/17) of cells exhibited characteristics of GCs (Fig. 4 A) (Rall et al. 1966; Price & Powell, 1970): small soma size (∼10 μm diameter), somatic location in deep layers beneath the IPL, a single peripheral dendrite projecting and/or branching in the EPL, as well as one or more deep dendrites, spine‐like appendages (gemmules) on dendrites especially in the EPL, no axons (axonless). The remaining two (2/17) cells have stellate like morphology and are potentially Blanes cells (Schneider & Macrides, 1978; Pressler & Strowbridge, 2006) or GCs with peripheral dendrites truncated during slice preparation. Thus, these results suggest that the vast majority (∼90%) of our recorded GAD65‐GFP‐labelled cells in the GC layer are GABAergic GCs.
Nevertheless, CCK at 200 nm showed no effect on any of these cells (Fig. 4 D–E). Consistent with this, 200 nm CCK did not affect the firing rate of the vast majority of an additional 44 cells (39/44) (Fig. 4 B, D and E), although it increased the firing rate of the remainder (5/44) (Fig. 4 C–F). In a total of 56 non‐responsive GABAergic cells recorded in the GC layer, the average spontaneous firing rate was 8.7 ± 1.0 Hz before CCK (Pre‐CCK) and 8.5 ± 1.3 Hz (P = 0.1267 compared to pre‐CCK, n = 56) in the presence of CCK. In the responsive cells, the spontaneous firing rate increased from 3.5 ± 1.5 Hz before CCK application (pre‐CCK) to 19.2 ± 4.2 Hz during CCK treatment (n = 5, P = 0.0048 compared to pre‐CCK) (Fig. 4 F). However, CCK‐8S at a lower concentration (50 nm) showed no effect on the spontaneous firing rate (7.0 ± 1.0 Hz before CCK compared to 7.0 ± 1.0 Hz during CCK, n = 31, P = 0.6588) of any cells (Fig. 4 E). Taken together with the preceding finding that CCK does not alter the action potential independent mIPSCs in MTCs, these results suggest that the CCK‐enhanced synaptic inhibition of MTCs is not from GCs or other GABAerig cell types in the GC layer but potentially from the glomerular circuit, which is targeted by apical dendrites of the CCKergic STCs.
CCK‐elevated glomerular inhibition
To investigate the contribution of the glomerular circuit to actions of CCK on synaptic inhibition of MTCs, we included lucifer yellow (0.1%, w/v) in the patch pipette as described above to locate the glomeruli receiving apical dendrites of the recorded cells and took a micropuffing approach to confine CCK application to the target glomeruli. Under these conditions, neither frequency, nor amplitude of sIPSCs in MTCs was affected by CCK (1 μm, 2 ms) micropuffed to the (off‐target) glomeruli next to those receiving apical dendrites of the recorded cells (Fig. 5 A, B, E and F). However, when CCK was micropuffed to the (on‐target) glomeruli receiving apical dendrites of the recorded MTCs, sIPSCs were significantly enhanced (Fig. 5 A and C). The sIPSC frequency was strikingly increased by 157% from 5.3 ± 1.7 Hz to 13.6 ± 2.4 Hz (n = 6, P = 0.0305) (Fig. 5 C and E). After CCK washout, sIPSC frequency returned to 5.8 ± 1.7 Hz (n = 6, P = 1.0 compared to pre‐CCK) (Fig. 5 E). By contrast, CCK did not affect sIPSC amplitude, which was 97.0 ± 26.3 pA before CCK application and 116.3 ± 26.8 pA in the presence of CCK (n = 6, P = 1.0) (Fig. 5 F). These effects were totally abolished by the selective CCK‐B receptor antagonist CI988 (10 μm) (Fig. 5 D–F), indicating mediation by CCK‐B receptors. In the presence of CI988, the frequency and amplitude of sIPSCs were 6.1 ± 1.7 Hz and 101.9 ± 35.7 pA before CCK (pre‐CCK), 6.2 ± 1.7 Hz (n = 6, P = 1.0, compared to pre‐CCK) and 104.8 ± 36.3 pA (n = 6, P = 1.0 compared to pre‐CCK) during CCK, as well as 6.1 ± 1.6 Hz (n = 6, P = 1.0, compared to pre‐CCK) and 103.9 ± 35.5 pA (n = 6, P = 1.0, compared to pre‐CCK) after CCK washout, respectively. These findings substantiate that the inhibitory glomerular circuit contributes to the CCK‐B receptor‐mediated enhancement of MTC inhibition.
Figure 5. Glomerular application of CCK increases synaptic inhibition of the affiliated MTCs.

A, typical MTC filled with the fluorescent dye lucifer yellow via the patch pipette, which records sIPSCs and their response to CCK‐8S (1 μm, 2 ms) micropuffed to the glomerulus targeted by an apical dendrite of the recorded cell. Scale bar = 40 μm. B, a typical voltage clamp trace showing that sIPSCs in a MTC are not affected by CCK‐8S micropuffed (green arrow) to an off‐target glomerulus, which neighbours the glomerulus receiving an apical dendrite of the recorded cell as shown in (A). C, top trace showing that micropuffing (red arrow) CCK‐8S to the target glomerulus reversibly increases both the frequency and amplitude of sIPSCs in the recorded MTC shown in (A). Bottom traces are magnifications from (A). D, voltage clamp trace showing that micropuffed CCK‐8S exhibits no effect on sIPSCs in the same MTC in the presence of CI988 (10 μm, blue bar), a selective CCK‐B receptor antagonist. E and F, quantified data showing reversible changes in frequency (E) and amplitude (F) of sIPSCs in six MTCs when CCK‐8S is micropuffed to the off‐target (OFF) or on‐target glomerulus in the absence (ON) or presence (CI+ON) of the selective CCK‐B receptor antagonist CI988.
There are three major subpopulations of glomerular neurons: glutamatergic ETCs, GABAergic PGCs and GABA/dopaminergic SACs (Wachowiak & Shipley, 2006; Linster & Cleland, 2009). All of these three classes of glomerular neurons receive inhibitory synaptic input only from the glomerular circuit (Pinching & Powell, 1971a; Hayar et al. 2004b; Kosaka & Kosaka, 2008; Kiyokage et al. 2010). ETCs and PGCs have single dendrites ramifying in individual glomeruli, whereas SACs have long processes connecting many glomeruli. Therefore, if CCK enhances glomerular inhibition, one prediction is that CCK will increase sIPSCs in all these three subpopulations of glomerular neurons. To test this, we first recorded sIPSCs in ETCs and examined the effects of CCK. At a concentration of 200 nm, CCK reversibly increased sIPSCs in ETCs in terms of both frequency and amplitude (Fig. 6 A), which were 10.5 ± 4.4 Hz and 17.0 ± 3.6 pA before CCK application (pre‐CCK), 30.5 ± 7.3 Hz (CCK, n = 7, P = 0.0001 compared to pre‐CCK) and 62.5 ± 8.7 pA (CCK, n = 7, P < 0.0001 compared to pre‐CCK) during CCK application, and 9.9 ± 3.9 Hz (n = 7, P = 1.0 compared to pre‐CCK) and 17.8 ± 2.0 pA (n = 7, P = 1.0 compared to pre‐CCK) after CCK washout, respectively (Fig. 6 B and E). These effects of CCK were completely abolished by pretreating slices with the selective CCK‐B receptor antagonist CI988 (Fig. 6 B and E) for 10 min. In the presence of CI988 (10 μm), sIPSC frequency and amplitude were 9.7 ± 3.4 Hz and 17.6 ± 5.0 pA before CCK (pre‐CCK), 10.0 ± 3.5 Hz (n = 7, P = 1.0 compared to pre‐CCK) and 17.9 ± 5.0 pA (n = 7, P = 0.8795 compared to pre‐CCK) during CCK, and 10.2 ± 3.7 Hz and 17.9 ± 5.1 pA after CCK washout. Subsequent experiments showed similar CCK (200 nm) effects on sIPSCs in the SACs (Fig. 6 C and F) and PGCs (Fig. 6 D and G), which were identified and selectively recorded in OB slices prepared from TH‐GFP and GAD65‐GFP mice (Kosaka & Kosaka, 2008; Kiyokage et al. 2010), respectively. Taken together, these findings demonstrate that CCK enhances overall glomerular inhibition.
Figure 6. CCK enhances synaptic inhibition of glomerular neurons.
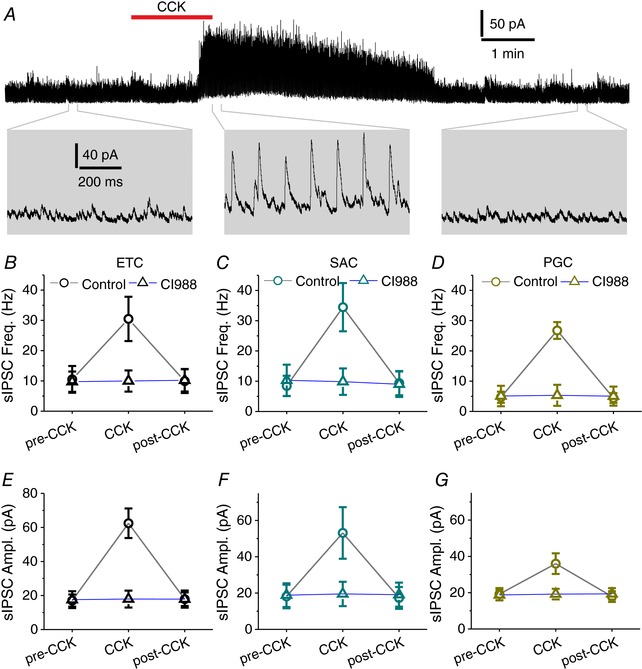
A, top trace showing that bath‐applied CCK‐8S (200 nm, red bar) reversibly enhances sIPSCs in a typical external tufted cell (ETC) voltage clamped at 0 mV in the presence of NBQX and APV. Bottom: magnified traces from the top. B and E, quantified data showing the effects of CCK‐8S on frequency and amplitude of sIPSCs in seven ETCs in the absence (circle) or presence (triangle) of CI988 (10 μm). C and F, quantified data showing the effects of CCK‐8S on frequency and amplitude of sIPSCs in six SACs in the absence (circle) or presence (triangle) of CI988 (10 μm). D and G, quantified data showing the effects of CCK‐8S on frequency and amplitude of sIPSCs in six PGCs in the absence (circle) or presence (triangle) of CI988 (10 μm).
Differential action potential‐dependence of the CCK‐enhanced glomerular inhibition in different subpopulations of glomerular neurons
Transmitter release from neuronal dendrites does not depend on action potentials in the presynaptic neurons (Ludwig et al. 2016). The OB glomerular circuit is very rich in dendrodendritic synapses. If the CCK enhancement of glomerular inhibition results from modulating presynaptic dendritic terminals of inhibitory glomerular interneurons to increase GABA release, one prediction is that this action of CCK is action potential independent. To test this, we examined effects of CCK on the action potential independent mIPSCs in all three subpopulations of glomerular neurons. mIPSCs were recorded under the same conditions as sIPSCs, except that the selective sodium channel blocker TTX was present to block action potential generation and propagation in the presynaptic neurons. Therefore, if CCK alters mIPSCs, this will indicate that CCK modulates action potential independent GABA release from presynaptic inhibitory interneurons. Otherwise, it will suggest that CCK only modulates action potential‐evoked GABA release.
As shown in Fig. 7 A–C, both frequency and amplitude of mIPSCs in ETCs were significantly enhanced by bath‐applied 200 nm CCK, suggesting that CCK enhances action potential independent GABA release from presynaptic inhibitory interneurons to ETCs. The mIPSC frequency and amplitude were 7.0 ± 1.1 Hz and 11.2 ± 1.6 pA before CCK application (pre‐CCK), 13.9 ± 1.5 Hz (n = 7, P < 0.0001 compared to pre‐CCK) and 14.9 ± 1.5 pA (n = 7, P < 0.0001 compared to pre‐CCK) in the presence of CCK, and 7.3 ± 1.2 Hz (n = 7, P = 1.0 compared to pre‐CCK) and 11.1 ± 1.6 pA (n = 7, P = 1.0 compared to pre‐CCK) after CCK washout (Fig. 7 B and C). Surprisingly, CCK (200 nm) affected neither frequency, nor amplitude of the action potential independent mIPSCs (Fig. 7 B and C) in PGCs or SACs under the same conditions, indicating that CCK increases only the action potential‐evoked GABA release from presynaptic interneurons to SACs and PGCs. The frequency and amplitude of mIPSCs in SACs were 3.3 ± 1.0 Hz and 10.1 ± 1.3 pA before CCK (pre‐CCK) and 3.2 ± 1.0 Hz (n = 8, P = 0.3428 compared to pre‐CCK) and 9.8 ± 1.5 pA (n = 8, P = 0.9900 compared to pre‐CCK) during CCK application, whereas corresponding measures in PGCs were 2.4 ± 0.7 Hz and 9.2 ± 1.0 pA before CCK, 2.5 ± 0.8 Hz (n = 8, P = 1.0 compared to pre‐CCK) and 8.9 ± 1.0 pA (n = 8, P = 1.0 compared to pre‐CCK) during CCK application, respectively. Taken together with the prior findings of the actions of CCK on mIPSCs in MTCs, these results demonstrate that the action potential‐dependence of CCK‐actions on glomerular inhibition varies with postsynaptic neuronal types (i.e. presynaptic firing is required for MTCs, SACs and PGCs but not for ETCs). In addition to the two major types of inhibitory interneurons PGCs and SACs in the glomerular circuit (Kosaka & Kosaka, 2008; Kiyokage et al. 2010), axons of the inhibitory deep short axon cells (dSACs) also project to the glomerular layer and provide inhibitory input to glomerular neurons (Eyre et al. 2008; Burton et al. 2017). Therefore, these results also suggest that CCK increases firing activity in SACs, PGCs and/or dSACs to elevate their GABA release and enhance glomerular inhibition.
Figure 7. Differential effects of CCK on mIPSCs in glomerular neurons.

A, top trace showing reversible effects of bath‐applied CCK‐8S (200 nm) on mIPSCs in a typical ETC voltage clamped at 0 mV in the presence of NBQX, APV and the selective sodium channel blocker TTX1 (μm). Bottom: magnified traces at an expanded time scale from the top trace showing that CCK increases both the frequency and amplitude of mIPSCs. B and C, quantified data showing that CCK‐8S reversibly increases the frequency (B) and amplitude (C) of mIPSCs in ETCs (n = 7) but not in SACs (n = 8) or PGCs (n = 7).
Excitation of inhibitory glomerular neurons
To investigate whether CCK alters the excitability of PGCs and SACs, we examined the effects of CCK on spontaneous firing activities of SACs or PGCs in current clamp with NBQX, APV and GBZ in the bath to eliminate circuit influence. SACs or PGCs were identified and recorded in OB slices prepared from TH‐GFP or GAD65‐GFP mice, respectively. Under these conditions, CCK (200 nm) increased spontaneous firing rate in all tested SACs (n = 11 cells) (Fig. 8 A and B). The average spontaneous firing rate of SACs was 0.7 ± 0.3 Hz before CCK application (pre‐CCK), 38.8 ± 5.4 Hz (n = 11, P < 0.0001 compared to pre‐CCK) during CCK application and 0.7 ± 0.3 Hz (n = 11, P = 1.0 compared to pre‐CCK) after CCK washout, respectively.
To determine whether SACs respond to CCK at a lower and probably more physiological concentration, we found that 50 nm CCK also reversibly increased spontaneous firing in all tested SACs (10/10 cells) (Fig. 8 B). The average spontaneous firing rate of 10 SACs was 0.9 ± 0.3 Hz before CCK application (pre‐CCK), 11.3 ± 1.5 Hz (n = 10, P < 0.0001 compared to pre‐CCK, P < 0.001 compared to during 200 nm CCK application) during CCK application and 0.8 ± 0.2 Hz (n = 10, P = 1.0 compared to pre‐CCK) after CCK washout, respectively. Taken together, these results attest that CCK at a very low concentration exclusively excites SACs.
Consistent with the results of current clamp experiments, CCK produced dose‐dependent inward currents in all tested SACs (22/22 cells) (Fig. 8 C and D), which were voltage clamped at −60 mV in the presence of the fast synaptic blockers NBQX, APV and GBZ to eliminate circuit influence. The average amplitude of this inward current induced by 50 nm or 200 nm CCK‐8S in two separate sets of SACs (n = 11 for each condition) was 7.6 ± 1.1 pA (n = 11) or 18.2 ± 2.3 pA (n = 11, P < 0.0001 compared to 50 nm CCK) (Fig. 8 D). To test whether the CCK–induced currents in SACs were mediated by CCK‐B receptors, OB slices were perfused with aCSF containing the fast synaptic blockers and the selective CCK‐B receptor antagonist CI988 for 10 min before application of CCK. Under these conditions, 200 nm CCK produced little inward currents (0.5 ± 0.2 pA, n = 11, P = 1.0 compared to Pre‐CCK, P < 0.0001 compared to 200 nm CCK in the absence of CI988) in SACs, suggesting that the CCK‐induced inward currents in SACs are mediated by CCK‐B receptors. Collectively, these results corroborate that CCK via CCK‐B receptors excites SACs in the glomerular circuit.
By contrast, 200 nm CCK showed no effect on spontaneous firing in a vast majority (40/45) of PGCs (Fig. 8 E and F). The average spontaneous firing rates of the 40 non‐responsive PGCs was 7.3 ± 0.9 Hz before CCK application (Pre‐CCK) and 7.3 ± 0.8 Hz (P = 0.7728 compared to Pre‐CCK, n = 40) during CCK treatment (Fig. 8 F). In a very small minority (5/45) of PGCs, 200 nm CCK increased spontaneous firing rate from 2.6 ± 0.9 Hz to 11.9 ± 1.2 Hz (n = 5, P = 0.0041) (Fig. 8 F). At a lower concentration (50 nm), CCK altered spontaneous firing in none of 37 PGCs, with average firing rates of 7.5 ± 0.7 Hz and 7.5 ± 0.7 Hz (n = 37, P = 0.9025) before and during CCK treatment, respectively. These results suggest that PGCs contribute little or insignificantly to the CCK‐enhanced glomerular inhibition.
In addition to the inhibitory SACs and PGCs in the glomerular circuit, axons of deep short axon cells (dSACs) project to the glomerular layer with extensive arborizations and provide inhibitory input to local interneurons but not MTCs (Eyre et al. 2008; Burton et al. 2017). Thus, bath‐applied CCK potentially excites dSACs to increase GABA release from dSACs and enhance glomerular inhibition. dSACs express the selective molecular marker chrna2 (nicotinic acetylcholine receptor subunit α2) (Burton et al. 2017). Thus, injecting the Cre‐dependent adenoassociated virus‐enhanced yellow fluorescent protein (EYFP)‐ChR2 into the OB of chrna2‐Cre mice enabled us to identify and selectively record from the EYFP‐ChR2‐expressing dSACs (Fig. 9 A and B). With this approach, we examined the effects of CCK on spontaneous firing activity of dSACs in cell‐attached recording mode (Fig. 9 B and C) in the presence of fast glutamatergic and GABAergic synaptic blockers, as noted previously. As shown in Fig. 9 A and B, dSACs were identified not only by their expression of EYFP, but also by their excitatory response to activation of ChR2 with blue laser light (473 nm). Consistent with previous studies, all dSACs (n = 7) exhibited regular spontaneous firing activities with an average frequency of 8.4 ± 1.0 Hz (Burton et al. 2017) (Fig. 9 B and C). However, bath‐applied 200 nm CCK exhibited no effect on the spontaneous firing rate in any dSACs tested (Fig. 9 C and D). The average frequency of spontaneous firing in eight dSACs after CCK treatment for 2 min was 8.3 ± 0.9 Hz (n = 7, P = 0.3251) (Fig. 9 D). These results indicate that the action potential‐dependent CCK enhancement of glomerular inhibition is not a result of the excitation of dSACs.
Taken together, our findings strongly support that the CCK‐enhanced glomerular inhibition attributes to its selective excitation of SACs, indicating selective engagement of the interglomerular circuit.
Enhanced presynaptic inhibition of ON terminals
GABA released from inhibitory glomerular neurons activates GABAB receptors on ON terminals to produce presynaptic inhibition (Nickell et al. 1994; Aroniadou‐Anderjaska et al. 2000; Wachowiak et al. 2005). CCK excites SACs to release GABA and enhance glomerular inhibition. This action can potentially increase the GABAB receptor‐mediated presynaptic inhibition of ON terminals. To test this, we examined the actions of CCK on ON‐evoked responses in ETCs, which exclusively receive monosynaptic ON input and thus provide an ideal cellular proxy for measuring presynaptic inhibition of the first synapse in the olfactory system. ETCs were voltage clamped at −60 mV to record their EPSCs to ON stimulation (Fig. 10 A top). In line with previous studies (Hayar et al. 2004a; Ma & Lowe, 2007; De Saint Jan et al. 2009), electrical ON stimulation reliably evoked EPSCs with short onset latencies in ETCs. The latency and amplitude of ON‐EPSCs were 2.2 ± 0.7 ms (n = 7) and 209.4 ± 18.7 pA (n = 7) in normal aCSF (Fig. 10 A and B). After bath application of CCK (200 nm), the amplitude of the ON‐evoked EPSCs was reduced to 130.5 ± 21.4 pA (62.0 ± 4.2% of the aCSF level, n = 7, P < 0.0001) (Fig. 10 D). At 20 min following CCK washout, EPSC amplitude was recovered to 211.6 ± 13.7 pA (100.1 ± 2.0% of the aCSF level, n = 7, P = 1.0) (Fig. 10 D), indicating the reversibility of the actions of CCK. In the presence of the fast glutamatergic receptor blockers NBQX and APV, the ON‐evoked EPECs were completely eliminated (0.5 ± 0.2 pA, n = 7, P < 0.0001 compared to aCSF) (Fig 10 B and D), confirming the glutamate‐mediated synaptic transmission from ON terminals to ETCs. In agreement with CCK‐B receptor‐mediated actions on SACs, CCK suppression of the ON‐ETC transmission was completely blocked by the selective CCK‐B receptor antagonist CI988 (10 μm) (Fig. 10 D). In the presence of CI988, the average ON‐ETC EPSC amplitude in the presence of CCK or after CCK washout was 99.4 ± 1.2% (206.7 ± 14.0 pA, n = 6, P = 1.0 compared to pre‐CCK) or 99.7 ± 0.8% (207.7 ± 15.54 pA n = 6, P = 1.0 compared to pre‐CCK) of the pre‐CCK value (208.8 ± 16.0 pA). Thus, these results demonstrate a CCK‐B receptor‐mediated enhancement of presynaptic inhibition of synaptic transmission from ON terminals to ETCs.
To determine whether this CCK‐induced suppression of ON‐ETC transmission was mediated by GABAB receptors, we performed two sets of experiments to test whether a selective GABAB receptor antagonist can block CCK effect or activation of GABAB receptors with a selective agonist can occlude the actions of CCK. In the first experiment, we bath‐applied the selective GABAB receptor antagonist CGP55845 (10 μm) for 10 min before the addition of CCK. As shown in Fig. 10 C and D, CCK (200 nm) showed little effect on ON‐ETC EPSCs under this condition, indicating that CCK enhances inhibition of presynaptic ON terminals mainly by increasing GABA release from SACs to activate GABAB receptors. The average ON‐ETC EPSC amplitude in the presence of CCK or after CCK washout was 90.2 ± 1.4% (180.2 ± 19.2 pA, n = 7, P < 0.0001 compared to Pre‐CCK and P < 0.0001 compared to CCK in aCSF) or 99.9 ± 0.6% (201.9 ± 20.0 pA, n = 7, P = 1.0 compared to pre‐CCK) of the pre‐CCK level (203.9 ± 20.6 pA) (Fig. 10 D). These findings indicate that activation of GABAB receptors is required for CCK‐induced reduction of the ON‐evoked EPSCs in ETCs. In the second experiment, we treated slices with the selective GABAB receptor agonist baclofen (10 μm) for 10 min before adding CCK. Baclofen reduced the amplitude of ON‐evoked EPSCs in ETCs from 207.7 ± 29.8 pA to 87.6 ± 11.1 pA (n = 6, P < 0.001). In the presence of baclofen, EPSC amplitude showed little change to 86.9 ± 11.9 pA (n = 6, P = 1 compared to baclofen alone) after adding CCK. Because the irreversible agonist baclofen activated GABAB receptors and occluded the actions of CCK, this finding suggests that activation of functional GABAB receptors mediates the actions of CCK on ON‐ETC transmission. Collectively, these results demonstrate a CCK‐B receptor‐ and GABAB receptor‐dependent CCK suppression of synaptic transmission from ON to ETCs, implicating that CCK enhances GABA release from SACs to produce presynaptic inhibition of ON terminals.
Postsynaptic GABAB receptors are reported on unidentified juxtaglomerular neurons and ETCs (Bonino et al. 1999; Karpuk & Hayar, 2008). Activation of GABAB receptors in ETCs modulates ETC intrinsic properties and thus potentially influences ON‐ETC transmission postsynaptically. To determine whether the CCK suppression of ON‐ETC transmission was a result of activation of presynaptic GABAB receptors on ON terminals leading to reduced glutamate release or postsynaptic GABAB receptor‐mediate modulation of ETCs, we examined the effects of CCK on PPR of the ON‐evoked EPSCs in ETCs. ON‐evoked EPSCs in ETCs exhibited a paired‐pulse depression in aCSF with an average PPR of 0.69 ± 0.05 (n = 7), which was increased to 0.97 ± 0.02 (n = 7, P < 0.0001) by bath applied CCK (200 nm) and returned to 0.69 ± 0.06 (n = 7, P = 1.0 compared to Pre‐CK) after CCK washout for 10 min (Fig. 10 E and F), suggesting a reversible CCK action on PPR of the ON‐ETC transmission. This action of CCK was completely blocked by either the selective CCK‐B receptor antagonist CI988 (10 μm) or the selective GABAB receptor antagonist CGP55845 (10 μm) (Fig. 10 F). PPR was 0.67 ± 0.06 before CCK and 0.67 ± 0.05 (n = 6, P = 0.9581) during CCK in the presence of CI988 (10 μm) or 0.73 ± 0.05 before CCK and 0.77 ± 0.03 (n = 7, P = 0.0798) during CCK treatment in the presence of CGP55845 (10 μm), respectively. A further experiment revealed that PPR of the ON‐ETC EPSCs was increased by the selective GABAB receptor agonist baclofen (10 μm) from 0.66 ± 0.05 to 0.78 ± 0.06 (n = 6, P = 0.0438). In the presence of baclofen, CCK showed no further effect (0.78 ± 0.07, n = 6, P = 1 compared to baclofen alone). PPR alteration by drug treatments reflects changes in presynaptic transmitter release because pure postsynaptic effects are assumed to affect the paired‐pulse stimulation‐evoked two EPSCs equally and thus not to influence the PPR. Therefore, our results strongly suggest that CCK inhibition of the ON‐ETC transmission is predominantly a result of GABAB receptor‐mediated presynaptic inhibition of ON terminals.
In summary, our findings suggest that CCK via CCK‐B receptors selectively activates SACs to release GABA, which acts on GABAB receptors on ON terminals to reduce glutamate release and produces presynaptic inhibition of the first synapse in the olfactory system.
Discussion
The neuropeptide CCK is predominantly expressed in the OB STCs and plays potential roles in olfactory signal processing. In the present study, we systematically characterized actions of CCK on synaptic inhibition of the principal OB output neurons followed by an analysis of the underlying cellular and circuit mechanisms, with the following major findings (Fig. 11): (i) CCK via CCK‐B receptors significantly enhance the GABAA receptor‐mediated synaptic inhibition of the OB principal output neurons MTCs; (ii) this action can be achieved by a very low concentration of CCK and requires action potentials in presynaptic neurons; (iii) the enhanced inhibition of MTCs originates from CCK‐elevated inhibitory input from the glomerular circuit; (iv) CCK modulation of the glomerular circuit also leads to potentiated presynaptic inhibition of ON terminals and postsynaptic inhibition of glomerular neurons; and (v) selective excitation of SACs underlies the CCK‐potentiated glomerular inhibition.
Figure 11. Schematic diagram summarizing actions of CCK on the glomerular circuit.

CCK selectively excites SACs to increase the action potential‐evoked GABA release in the glomerular circuit. GABA then activates GABAB receptors on ON terminals to inhibit glutamate release and activates GABAA receptors on dendritic terminals of MTCs, PGCs and SACs to produce postsynaptic inhibition. CCK also increases the action potential independent GABA release from neuronal terminals of SACs to enhance inhibition of ETCs.
Enhanced synaptic inhibition of MTCs
The major finding of the present study is that activation of CCK‐B receptors enhances synaptic inhibition of the OB output neurons MTCs and ETCs. These glutamatergic output neurons not only provide signal output to downstream olfactory centres, but also influence functional operation of local neural circuits within the OB by releasing the neurotransmitter glutamate from their dendrites. For example, ETCs receive direct ON input (Hayar et al. 2004a) and provide feedforward excitation to MTCs (Hayar et al. 2004a; De Saint Jan et al. 2009; Najac et al. 2011; Gire et al. 2012) and other glomerular neurons via their apical dendrites, whereas MTCs excites glomerular neurons and GCs via their single apical dendrites and multiple basal dendrites, respectively. Thus, these actions of CCK can lead to two functional consequences: (i) a reduction of MTC sensitivity to olfactory sensory input and (ii) a decrease in glutamate release in the OB. Consistent with these two predictions, CCK‐B receptor antagonists enhance olfactory recognition in behavioural studies (Lemaire et al. 1994a, b), whereas systemic administration of CCK reduces glutamate concentration in the OB (Acosta, 1998). Because MTCs form reciprocal dendrodendritic synapses with both local inhibitory interneurons in the glomerular circuit via their single apical dendrites and dendrites of GCs via their lateral dendrites in the EPL, direct excitation of MTCs can lead to enhanced feedback synaptic inhibition. Indeed, a recent study showed that CCK mainly excited MTCs (Ma et al. 2013). However, at least two pieces of evidence support the idea that the CCK‐enhanced synaptic inhibition of MTCs is not a result of feedback inhibitory input following direct excitation of MTCs. First, sIPSCs or mIPSCs were recorded in the presence of the fast glutamate receptor blockers that eliminate MTC output to local inhibitory interneurons. Second, CCK at 500 nm showed no effect on MTC intrinsic membrane properties despite its significant potentiation of synaptic inhibition of MTCs at concentrations ranging from 50 nm to 500 nm. This observation differs from findings of Ma et al. (2013). In addition to a higher concentration of CCK (1 μm) used in the study of Ma et al. (2013), differences in animal age and/or strain might contribute to this discrepancy. Specifically, we used 8–10‐week‐old C57BL/6 mice, whereas Ma et al. (2013) utilized 2–3‐week‐old CD1 mice. In parallel with this explanation, the pattern and level of CCK receptor expression in the OB, hippocampus and cerebral cortex are age‐ and strain‐dependent (Zarbin et al. 1983; Wang et al. 2003; Deng & Lei, 2006).
Insignificant contribution of infraglomerular circuits
CCK are predominantly expressed in STCs in the OB (Seroogy et al. 1985; Liu & Shipley, 1994). Axons of the CCKergic STCs terminate in the IPL on the opposite side of the same bulb where they form synapses with GC dendrites (Liu & Shipley, 1994), indicating that GCs are potential action targets of endogenous CCK released from STC axonal terminals. Because MTCs receive massive inhibitory synaptic input from GCs via their lateral dendrites (Shepherd et al. 2007), activation of GCs plausibly plays a role in mediating the actions of CCK on MTCs. However, the present study presents three lines of evidence showing that GCs contribute little to the CCK‐enhanced synaptic inhibition of MTCs. First, CCK at 50 nm did not affect the firing activities of any of the GCs tested. Even at 200 nm, CCK still exhibited no effects on the firing activity of a vast majority (>90%) of GCs. This is consistent with a recent study showing no detectable CCK receptor expression in GCs with immunostaining (Ma et al. 2013). A very small minority (<10%) of GCs were excited only by 200 nm CCK, indicating the weak expression of CCK receptors. This small portion of responsive GCs may represent developing or immature GCs because expression of CCK‐B receptors in hippocampal interneurons diminishes with age (Deng & Lei, 2006). They could also be other inhibitory interneuron types, such as Blanes cells or Golgi cells, which have somas residing in the GC layer but do not provide direct inhibitory input to mitral cells (Schneider & Macrides, 1978; Pressler & Strowbridge, 2006). Consistent with this interpretation, our extra data (not shown) show that CCK does not affect sIPSCs in MTCs with truncated apical dendrites and receiving inhibitory input mainly from GCs. Activation of immature GCs, which have probably not yet established synaptic connections with MTC lateral dendrites, should not influence sIPSCs in MTCs. Second, CCK did not affect the action potential independent mIPSCs in MTCs. This observation rules out the possibility that CCK modulates action potential independent GABA release from GC dendrites to enhance inhibition of MTCs (Isaacson & Strowbridge, 1998). Third, CCK did not alter sIPSCs in MTCs with truncated apical dendrites (data not shown). Although these MTCs receive no synaptic input from the glomerular circuit, their lateral dendrites and residual apical dendritic shafts receive inhibitory synaptic input from GCs (Shepherd et al. 2007) and GABAergic interneurons in the EPL (Kato et al. 2013; Miyamichi et al. 2013). Thus, our finding suggests that neither GCs, nor EPL interneurons contribute to the CCK‐enhanced synaptic inhibition of MTCs. A previous EM study demonstrated synaptic connections between the CCKergic STC axons and GC dendrites in the IPL (Liu & Shipley, 1994), although the functional operation of these synapses remains unknown. The present study provides the first functional evidence indicating that CCK does not participate in conveying signals at these synapses. Future studies with optogenetic approaches will allow us to determine whether glutamate is the sole neurotransmitter for communication between STCs and GCs in the IPL.
Potentiated glomerular inhibition
Dendritic release of neuropeptides has been reported in the CNS (van den Pol, 2012). Apical dendrites of CCK‐containing STCs ramify in single glomeruli and potentially release the neuropeptide CCK to modulate the inhibitory glomerular circuit. Multiple findings of the present study corroborate the idea that the CCK‐enhanced synaptic inhibition of MTCs is a result of modulation of the glomerular circuit. First, confined application of CCK to single glomeruli enhanced sIPSCs only in MTCs with intact apical dendrites projecting to the drug‐targeted glomeruli, suggesting that CCK excites local inhibitory glomerular interneurons to release GABA and increase the inhibitory glomerular output to MTCs. This is consistent with previous studies showing that CCK receptors are expressed in the glomerular layer and inhibitory glomerular interneurons (Zarbin et al. 1983; Van Dijk et al. 1984; Mercer et al. 2000; Ma et al. 2013). Furthermore, direct CCK excitation of interneurons is implicated in the increased GABA release in multiple other brain regions (Miller et al. 1997; Tanganelli et al. 2001; Deng & Lei, 2006).
Second, activation of CCK‐B receptors increases sIPSCs in all three subpopulations of glomerular neurons that receive inhibitory synaptic input solely from the glomerular layer (Hayar et al. 2004b; Kosaka & Kosaka, 2008; Kiyokage et al. 2010), demonstrating an elevation of overall glomerular inhibition. Similar to the action potential independent mIPSCs in MTCs, mIPSCs in SACs and PGCs are not sensitive to CCK either, indicating that CCK enhances only action potential‐evoked inhibitory input to these two populations of inhibitory glomerular neurons. By contrast, CCK significantly increases the mIPSC frequency in ETCs, suggesting that CCK enhances action potential independent GABA release from presynaptic inhibitory glomerular interneurons at their dendrodendritic synapses with ETCs. Emerging evidence shows that differential molecular machineries mediate spontaneous (action potential independent) and action potential‐evoked neurotransmitter release (Kaeser & Regehr, 2014; Kavalali, 2015). Thus, our findings implicate distinct presynaptic modulatory mechanisms underlying the CCK‐enhanced glomerular inhibition of the excitatory ETCs or inhibitory glomerular neurons SACs/PGCs.
Third, CCK elevated GABAB receptor‐mediated presynaptic inhibition of the ON terminals. GABAB receptors are present at both extrasynaptic and presynaptic sites of ON terminals (Bonino et al. 1999; Margeta‐Mitrovic et al. 1999; Panzanelli et al. 2004). Activation of these GABAB receptors by GABA released from inhibitory glomerular neurons results in presynaptic inhibition of transmission from the olfactory sensory neurons to their postsynaptic targets in the OB (Nickell et al. 1994; Aroniadou‐Anderjaska et al. 2000; Wachowiak et al. 2005). This finding supports the idea that CCK excites GABAergic interneurons to release GABA in the glomerular circuit.
Finally, activation of CCK‐B receptors by CCK at an extremely low and more physiologically relevant concentration significantly increases the intrinsic excitability of all inhibitory SACs, indicating the expression of functional CCK‐B receptors in this subpopulation of inhibitory glomerular neurons. This is consistent with previous studies showing an intense CCK‐B receptor distribution in the glomerular layer (Zarbin et al. 1983). Because SACs have long processes linking many glomeruli and form the interglomerular circuit (Kosaka & Kosaka, 2008; Kiyokage et al. 2010), their high sensitivity to CCK further suggests that CCK preferentially engages the inhibitory interglomerular circuit to increase lateral inhibition of MTCs.
Functional implication and future directions
Neuropeptides including CCK play important roles in many brain functions by modulating neuronal excitability and circuit operation (Lee & Soltesz, 2011; Leinwand & Chalasani, 2011; van den Pol, 2012; Nusbaum et al. 2017). One major finding of the present study is that CCK potentiates the overall glomerular inhibition, which leads to elevated inhibition of ON terminals, MTCs, and glomerular neurons. Inhibition of glutamate release from ON terminals reduces response amplitude of postsynaptic targets including MTCs and glomerular neurons (Nickell et al. 1994; Aroniadou‐Anderjaska et al. 2000; Ennis et al. 2001; Wachowiak et al. 2005; Vaaga et al. 2017). Glomerular inhibition reduces and shapes MTCs output to downstream centres (Gire & Schoppa, 2009; Shao et al. 2012; Whitesell et al. 2013; Banerjee et al. 2015; Najac et al. 2015; Liu et al. 2016), presumably via two major mechanisms: (i) hyperpolarizing MTCs so that they need large excitatory responses to reach firing threshold and (ii) a GABAA receptor‐mediated shunting effect that reduces the amplitude of MTC responses to ON input. Furthermore, inhibition of ETCs will further reduce MTC responses to ON input because ETCs intermediate and amplify ON input to MTCs (De Saint Jan et al. 2009; Najac et al. 2011; Gire et al. 2012). Conjointly, these functional consequences of actions of CCK at multiple levels will integrate to reduce the sensitivity of the system to olfactory stimulation and prevent response saturation in the olfactory system when animals encounter high concentrations of odourants in the environment.
Alternatively, the CCK‐induced overall enhancement of glomerular inhibition may function to increase the signal‐to‐noise ratio of the system by reducing the background noise level. This might be important for animals to detect faint or novel odours in the environment. Interestingly, animals perform high‐frequency sniffing to explore novel odourants (Adrian, 1950; Welker, 1964; Verhagen et al. 2007). This pattern of odour sampling behaviour presents high‐frequency and repetitive stimulation to activate the olfactory sensory neurons and their postsynaptic targets, including CCKergic STCs. The release of neuropeptides, including CCK from nerve terminals, requires high‐frequency or burst firing. Thus, if released in this scenario, CCK could play a role in preparing the system process information of novel odours.
Another major finding of present study is that CCK selectively activates SACs, which have long processes connecting many glomeruli and mediate later inhibition at the glomerular level (Aungst et al. 2003; Kosaka & Kosaka, 2008; Kiyokage et al. 2010; Whitesell et al. 2013; Banerjee et al. 2015; Liu et al. 2016). Because the GC‐mediated lateral synaptic inhibition of MTCs accelerates odour discrimination (Abraham et al. 2010), we propose that the CCK‐enhanced SAC‐mediated lateral inhibition in the glomerular layer has a similar role at the behavioural level.
CCKergic STCs co‐express the classic neurotransmitter glutamate (Yoo et al. 2006; Gabellec et al. 2007; Ohmomo et al. 2009), which acts on postsynaptic neurons via the fast ionotropic AMPA and NMDA receptors and/or metabotropic glutamate receptors. Do CCKergic STCs co‐release CCK and glutamate? If so, how do these co‐transmitters interact to transmit signals to downstream cellular targets? Future studies with optogenetic and/or chemogenetic approaches will allow us to address these questions.
Additional information
Competing interests
The authors declare that they have no competing interests.
Author contributions
All authors approved the final version of the manuscript submitted for publication and agree to be accountable for all aspects of the work, in ensuring that questions related to the accuracy or integrity of any part of the work are appropriately investigated and resolved, and that all persons designated as authors qualify for authorship, and have been listed. Xiang Liu: Acquisition or analysis or interpretation of data for the work. Shaolin Liu: Conception or design of the work; Acquisition or analysis or interpretation of data for the work; Drafting the work or revising it critically for important intellectual content; Final approval of the version to be published; Agreement to be accountable for all aspects of the work.
Funding
This work was supported by NIDCD/5R01DC014447 (SL).
Biography
Shaolin Liu is a visiting assistant professor of neurobiology at The University of Maryland School of Medicine. His PhD work was on the neurobiological mechanisms of hippocampal synaptic plasticity and learning/memory at the Chinese Academy of Medical Sciences and Peking Union Medial College in China. He studied intracellular signalling pathways underlying synaptic plasticity in the visual cortex and cerebellum before moving to his current position. With respect to his long‐term goal of understanding anatomical and functional organization of neural circuits underlying sensation and behaviours in health and diseases, his current research focuses on the neurophysiological basis of signal processing in the olfactory system.

Edited by: Jaideep Bains & Katalin Toth
This is an Editor's Choice article from the 1 June 2018 issue.
References
- Abraham NM, Egger V, Shimshek DR, Renden R, Fukunaga I, Sprengel R, Seeburg PH, Klugmann M, Margrie TW, Schaefer AT & Kuner T (2010). Synaptic inhibition in the olfactory bulb accelerates odor discrimination in mice. Neuron 65, 399–411. [DOI] [PMC free article] [PubMed] [Google Scholar]
- Acosta GB (1998). Administration of cholecystokinin sulphated octapeptide (CCK‐8S) induces changes on rat amino acid tissue levels and on a behavioral test for anxiety. Gen Pharmacol 31, 637–641. [DOI] [PubMed] [Google Scholar]
- Acosta GB (2001). A possible interaction between CCKergic and GABAergic systems in the rat brain. Comp Biochem Physiol C Toxicol Pharmacol 128, 11–17. [DOI] [PubMed] [Google Scholar]
- Adrian ED (1950). The electrical activity of the mammalian olfactory bulb. Electroencephalogr Clin Neurophysiol 2, 377–388. [DOI] [PubMed] [Google Scholar]
- Antal M, Eyre M, Finklea B & Nusser Z (2006). External tufted cells in the main olfactory bulb form two distinct subpopulations. Eur J Neurosci 24, 1124–1136. [DOI] [PMC free article] [PubMed] [Google Scholar]
- Aroniadou‐Anderjaska V, Zhou FM, Priest CA, Ennis M & Shipley MT (2000). Tonic and synaptically evoked presynaptic inhibition of sensory input to the rat olfactory bulb via GABA(B) heteroreceptors. J Neurophysiol 84, 1194–1203. [DOI] [PubMed] [Google Scholar]
- Aungst JL, Heyward PM, Puche AC, Karnup SV, Hayar A, Szabo G & Shipley MT (2003). Centre‐surround inhibition among olfactory bulb glomeruli. Nature 426, 623–629. [DOI] [PubMed] [Google Scholar]
- Baltanas FC, Curto GG, Gomez C, Diaz D, Murias AR, Crespo C, Erdelyi F, Szabo G, Alonso JR & Weruaga E (2011). Types of cholecystokinin‐containing periglomerular cells in the mouse olfactory bulb. J Neurosci Res 89, 35–43. [DOI] [PubMed] [Google Scholar]
- Banerjee A, Marbach F, Anselmi F, Koh MS, Davis MB, Garcia da Silva P, Delevich K, Oyibo HK, Gupta P, Li B & Albeanu DF (2015). An interglomerular circuit gates glomerular output and implements gain control in the mouse olfactory bulb. Neuron 87, 193–207. [DOI] [PMC free article] [PubMed] [Google Scholar]
- Bonino M, Cantino D & Sassoe‐Pognetto M (1999). Cellular and subcellular localization of gamma‐aminobutyric acidB receptors in the rat olfactory bulb. Neurosci Lett 274, 195–198. [DOI] [PubMed] [Google Scholar]
- Burton SD, LaRocca G, Liu A, Cheetham CE & Urban NN (2017). Olfactory bulb deep short‐axon cells mediate widespread inhibition of tufted cell apical dendrites. J Neurosci 37, 1117–1138. [DOI] [PMC free article] [PubMed] [Google Scholar]
- Castillo PE, Carleton A, Vincent JD & Lledo PM (1999). Multiple and opposing roles of cholinergic transmission in the main olfactory bulb. J Neurosci 19, 9180–9191. [DOI] [PMC free article] [PubMed] [Google Scholar]
- Cheetham CE, Grier BD & Belluscio L (2015). Bulk regional viral injection in neonatal mice enables structural and functional interrogation of defined neuronal populations throughout targeted brain areas. Front Neural Circuits 9, 72. [DOI] [PMC free article] [PubMed] [Google Scholar]
- De Saint Jan D, Hirnet D, Westbrook GL & Charpak S (2009). External tufted cells drive the output of olfactory bulb glomeruli. J Neurosci 29, 2043–2052. [DOI] [PMC free article] [PubMed] [Google Scholar]
- Deng PY & Lei S (2006). Bidirectional modulation of GABAergic transmission by cholecystokinin in hippocampal dentate gyrus granule cells of juvenile rats. J Physiol 572, 425–442. [DOI] [PMC free article] [PubMed] [Google Scholar]
- Economo MN, Hansen KR & Wachowiak M (2016). Control of mitral/tufted cell output by selective inhibition among olfactory bulb glomeruli. Neuron 91, 397–411. [DOI] [PMC free article] [PubMed] [Google Scholar]
- Ennis M, Zhou FM, Ciombor KJ, Aroniadou‐Anderjaska V, Hayar A, Borrelli E, Zimmer LA, Margolis F & Shipley MT (2001). Dopamine D2 receptor‐mediated presynaptic inhibition of olfactory nerve terminals. J Neurophysiol 86, 2986–2997. [DOI] [PubMed] [Google Scholar]
- Eyre MD, Antal M & Nusser Z (2008). Distinct deep short‐axon cell subtypes of the main olfactory bulb provide novel intrabulbar and extrabulbar GABAergic connections. J Neurosci 28, 8217–8229. [DOI] [PMC free article] [PubMed] [Google Scholar]
- Gabellec MM, Panzanelli P, Sassoe‐Pognetto M & Lledo PM (2007). Synapse‐specific localization of vesicular glutamate transporters in the rat olfactory bulb. Eur J Neurosci 25, 1373–1383. [DOI] [PubMed] [Google Scholar]
- Geramita M & Urban NN (2016). Postnatal odor exposure increases the strength of interglomerular lateral inhibition onto olfactory bulb tufted cells. J Neurosci 36, 12321–12327. [DOI] [PMC free article] [PubMed] [Google Scholar]
- Ghijsen WE, Leenders AG & Wiegant VM (2001). Regulation of cholecystokinin release from central nerve terminals. Peptides 22, 1213–1221. [DOI] [PubMed] [Google Scholar]
- Gire DH, Franks KM, Zak JD, Tanaka KF, Whitesell JD, Mulligan AA, Hen R & Schoppa NE (2012). Mitral cells in the olfactory bulb are mainly excited through a multistep signaling path. J Neurosci 32, 2964–2975. [DOI] [PMC free article] [PubMed] [Google Scholar]
- Gire DH & Schoppa NE (2009). Control of on/off glomerular signaling by a local GABAergic microcircuit in the olfactory bulb. J Neurosci 29, 13454–13464. [DOI] [PMC free article] [PubMed] [Google Scholar]
- Gong S, Doughty M, Harbaugh CR, Cummins A, Hatten ME, Heintz N & Gerfen CR (2007). Targeting Cre recombinase to specific neuron populations with bacterial artificial chromosome constructs. J Neurosci 27, 9817–9823. [DOI] [PMC free article] [PubMed] [Google Scholar]
- Grundy D ( 2015). Principles and standards for reporting animal experiments in The Journal of Physiology and Experimental Physiology. J Physiol 593, 2547–2549. [DOI] [PMC free article] [PubMed] [Google Scholar]
- Gully D, Frehel D, Marcy C, Spinazze A, Lespy L, Neliat G, Maffrand JP & Le Fur G (1993). Peripheral biological activity of SR 27897: a new potent non‐peptide antagonist of CCKA receptors. Eur J Pharmacol 232, 13–19. [DOI] [PubMed] [Google Scholar]
- Gutierrez‐Mecinas M, Crespo C, Blasco‐Ibanez JM, Gracia‐Llanes FJ, Marques‐Mari AI & Martinez‐Guijarro FJ (2005). Characterization of somatostatin‐ and cholecystokinin‐immunoreactive periglomerular cells in the rat olfactory bulb. J Comp Neurol 489, 467–479. [DOI] [PubMed] [Google Scholar]
- Hayar A, Karnup S, Ennis M & Shipley MT (2004a). External tufted cells: a major excitatory element that coordinates glomerular activity. J Neurosci 24, 6676–6685. [DOI] [PMC free article] [PubMed] [Google Scholar]
- Hayar A, Karnup S, Shipley MT & Ennis M (2004b). Olfactory bulb glomeruli: external tufted cells intrinsically burst at theta frequency and are entrained by patterned olfactory input. J Neurosci 24, 1190–1199. [DOI] [PMC free article] [PubMed] [Google Scholar]
- Huang L, Garcia I, Jen HI & Arenkiel BR (2013). Reciprocal connectivity between mitral cells and external plexiform layer interneurons in the mouse olfactory bulb. Front Neural Circuits 7, 32. [DOI] [PMC free article] [PubMed] [Google Scholar]
- Hughes J, Boden P, Costall B, Domeney A, Kelly E, Horwell DC, Hunter JC, Pinnock RD & Woodruff GN (1990). Development of a class of selective cholecystokinin type B receptor antagonists having potent anxiolytic activity. Proc Natl Acad Sci USA 87, 6728–6732. [DOI] [PMC free article] [PubMed] [Google Scholar]
- Ingram SM, Krause RG 2nd, Baldino F Jr, Skeen LC & Lewis ME (1989). Neuronal localization of cholecystokinin mRNA in the rat brain by using in situ hybridization histochemistry. J Comp Neurol 287, 260–272. [DOI] [PubMed] [Google Scholar]
- Isaacson JS & Strowbridge BW (1998). Olfactory reciprocal synapses: dendritic signaling in the CNS. Neuron 20, 749–761. [DOI] [PubMed] [Google Scholar]
- Isokawa M (1996). Decrement of GABAA receptor‐mediated inhibitory postsynaptic currents in dentate granule cells in epileptic hippocampus. J Neurophysiol 75, 1901–1908. [DOI] [PubMed] [Google Scholar]
- Kaeser PS & Regehr WG (2014). Molecular mechanisms for synchronous, asynchronous, and spontaneous neurotransmitter release. Annu Rev Physiol 76, 333–363. [DOI] [PMC free article] [PubMed] [Google Scholar]
- Karpuk N & Hayar A (2008). Activation of postsynaptic GABAB receptors modulates the bursting pattern and synaptic activity of olfactory bulb juxtaglomerular neurons. J Neurophysiol 99, 308–319. [DOI] [PMC free article] [PubMed] [Google Scholar]
- Kato HK, Gillet SN, Peters AJ, Isaacson JS & Komiyama T (2013). Parvalbumin‐expressing interneurons linearly control olfactory bulb output. Neuron 80, 1218–1231. [DOI] [PMC free article] [PubMed] [Google Scholar]
- Kavalali ET (2015). The mechanisms and functions of spontaneous neurotransmitter release. Nat Rev Neurosci 16, 5–16. [DOI] [PubMed] [Google Scholar]
- Kiyokage E, Pan YZ, Shao Z, Kobayashi K, Szabo G, Yanagawa Y, Obata K, Okano H, Toida K, Puche AC & Shipley MT (2010). Molecular identity of periglomerular and short axon cells. J Neurosci 30, 1185–1196. [DOI] [PMC free article] [PubMed] [Google Scholar]
- Kosaka T & Kosaka K (2008). Tyrosine hydroxylase‐positive GABAergic juxtaglomerular neurons are the main source of the interglomerular connections in the mouse main olfactory bulb. Neurosci Res 60, 349–354. [DOI] [PubMed] [Google Scholar]
- Larsson LI & Rehfeld JF (1979). Localization and molecular heterogeneity of cholecystokinin in the central and peripheral nervous system. Brain Res 165, 201–218. [DOI] [PubMed] [Google Scholar]
- Lee SY & Soltesz I (2011). Cholecystokinin: a multi‐functional molecular switch of neuronal circuits. Dev Neurobiol 71, 83–91. [DOI] [PMC free article] [PubMed] [Google Scholar]
- Leinwand SG & Chalasani SH (2011). Olfactory networks: from sensation to perception. Curr Opin Genet Dev 21, 806–811. [DOI] [PubMed] [Google Scholar]
- Lemaire M, Barneoud P, Bohme GA, Piot O, Haun F, Roques BP & Blanchard JC (1994a). CCK‐A and CCK‐B receptors enhance olfactory recognition via distinct neuronal pathways. Learn Mem 1, 153–164. [PubMed] [Google Scholar]
- Lemaire M, Bohme GA, Piot O, Roques BP & Blanchard JC (1994b). CCK‐A and CCK‐B selective receptor agonists and antagonists modulate olfactory recognition in male rats. Psychopharmacology (Berl) 115, 435–440. [DOI] [PubMed] [Google Scholar]
- Lepousez G, Csaba Z, Bernard V, Loudes C, Videau C, Lacombe J, Epelbaum J & Viollet C (2010). Somatostatin interneurons delineate the inner part of the external plexiform layer in the mouse main olfactory bulb. J Comp Neurol 518, 1976–1994. [DOI] [PubMed] [Google Scholar]
- Lin CW, Shiosaki K, Miller TR, Witte DG, Bianchi BR, Wolfram CA, Kopecka H, Craig R, Wagenaar F & Nadzan AM (1991). Characterization of two novel cholecystokinin tetrapeptide (30‐33) analogues, A‐71623 and A‐70874, that exhibit high potency and selectivity for cholecystokinin‐A receptors. Mol Pharmacol 39, 346–351. [PubMed] [Google Scholar]
- Linster C & Cleland TA (2009). Glomerular microcircuits in the olfactory bulb. Neural Netw 22, 1169–1173. [DOI] [PMC free article] [PubMed] [Google Scholar]
- Liu S, Puche AC & Shipley MT (2016). The interglomerular circuit potently inhibits olfactory bulb output neurons by both direct and indirect pathways. J Neurosci 36, 9604–9617. [DOI] [PMC free article] [PubMed] [Google Scholar]
- Liu S & Shipley MT (2008). Multiple conductances cooperatively regulate spontaneous bursting in mouse olfactory bulb external tufted cells. J Neurosci 28, 1625–1639. [DOI] [PMC free article] [PubMed] [Google Scholar]
- Liu WL & Shipley MT (1994). Intrabulbar associational system in the rat olfactory bulb comprises cholecystokinin‐containing tufted cells that synapse onto the dendrites of GABAergic granule cells. J Comp Neurol 346, 541–558. [DOI] [PubMed] [Google Scholar]
- Lodovichi C, Belluscio L & Katz LC (2003). Functional topography of connections linking mirror‐symmetric maps in the mouse olfactory bulb. Neuron 38, 265–276. [DOI] [PubMed] [Google Scholar]
- Lopez‐Bendito G, Sturgess K, Erdelyi F, Szabo G, Molnar Z & Paulsen O (2004). Preferential origin and layer destination of GAD65‐GFP cortical interneurons. Cereb Cortex 14, 1122–1133. [DOI] [PubMed] [Google Scholar]
- Ludwig M, Apps D, Menzies J, Patel JC & Rice ME (2016). Dendritic release of neurotransmitters. Compr Physiol 7, 235–252. [DOI] [PMC free article] [PubMed] [Google Scholar]
- Ma J, Dankulich‐Nagrudny L & Lowe G (2013). Cholecystokinin: an excitatory modulator of mitral/tufted cells in the mouse olfactory bulb. PLoS One 8, e64170. [DOI] [PMC free article] [PubMed] [Google Scholar]
- Ma J & Lowe G (2007). Calcium permeable AMPA receptors and autoreceptors in external tufted cells of rat olfactory bulb. Neuroscience 144, 1094–1108. [DOI] [PMC free article] [PubMed] [Google Scholar]
- Macrides F & Schneider SP (1982). Laminar organization of mitral and tufted cells in the main olfactory bulb of the adult hamster. J Comp Neurol 208, 419–430. [DOI] [PubMed] [Google Scholar]
- Madisen L, Zwingman TA, Sunkin SM, Oh SW, Zariwala HA, Gu H, Ng LL, Palmiter RD, Hawrylycz MJ, Jones AR, Lein ES & Zeng H (2010). A robust and high‐throughput Cre reporting and characterization system for the whole mouse brain. Nat Neurosci 13, 133–140. [DOI] [PMC free article] [PubMed] [Google Scholar]
- Margeta‐Mitrovic M, Mitrovic I, Riley RC, Jan LY & Basbaum AI (1999). Immunohistochemical localization of GABA(B) receptors in the rat central nervous system. J Comp Neurol 405, 299–321. [DOI] [PubMed] [Google Scholar]
- Matsushita N, Okada H, Yasoshima Y, Takahashi K, Kiuchi K & Kobayashi K (2002). Dynamics of tyrosine hydroxylase promoter activity during midbrain dopaminergic neuron development. J Neurochem 82, 295–304. [DOI] [PubMed] [Google Scholar]
- Mercer LD, Le VQ, Nunan J, Jones NM & Beart PM (2000). Direct visualization of cholecystokinin subtype2 receptors in rat central nervous system using anti‐peptide antibodies. Neurosci Lett 293, 167–170. [DOI] [PubMed] [Google Scholar]
- Miller KK, Hoffer A, Svoboda KR & Lupica CR (1997). Cholecystokinin increases GABA release by inhibiting a resting K+ conductance in hippocampal interneurons. J Neurosci 17, 4994–5003. [DOI] [PMC free article] [PubMed] [Google Scholar]
- Miyamichi K, Shlomai‐Fuchs Y, Shu M, Weissbourd BC, Luo L & Mizrahi A (2013). Dissecting local circuits: parvalbumin interneurons underlie broad feedback control of olfactory bulb output. Neuron 80, 1232–1245. [DOI] [PMC free article] [PubMed] [Google Scholar]
- Najac M, De Saint Jan D, Reguero L, Grandes P & Charpak S (2011). Monosynaptic and polysynaptic feed‐forward inputs to mitral cells from olfactory sensory neurons. J Neurosci 31, 8722–8729. [DOI] [PMC free article] [PubMed] [Google Scholar]
- Najac M, Sanz Diez A, Kumar A, Benito N, Charpak S & De Saint Jan D (2015). Intraglomerular lateral inhibition promotes spike timing variability in principal neurons of the olfactory bulb. J Neurosci 35, 4319–4331. [DOI] [PMC free article] [PubMed] [Google Scholar]
- Nickell WT, Behbehani MM & Shipley MT (1994). Evidence for GABAB‐mediated inhibition of transmission from the olfactory nerve to mitral cells in the rat olfactory bulb. Brain Res Bull 35, 119–123. [DOI] [PubMed] [Google Scholar]
- Nusbaum MP, Blitz DM & Marder E (2017). Functional consequences of neuropeptide and small‐molecule co‐transmission. Nat Rev Neurosci 18, 389–403. [DOI] [PMC free article] [PubMed] [Google Scholar]
- Ohmomo H, Ina A, Yoshida S, Shutoh F, Ueda S & Hisano S (2009). Postnatal changes in expression of vesicular glutamate transporters in the main olfactory bulb of the rat. Neuroscience 160, 419–426. [DOI] [PubMed] [Google Scholar]
- Panzanelli P, Lopez‐Bendito G, Lujan R & Sassoe‐Pognetto M (2004). Localization and developmental expression of GABA(B) receptors in the rat olfactory bulb. J Neurocytol 33, 87–99. [DOI] [PubMed] [Google Scholar]
- Perkins KL & Wong RK (1995). Intracellular QX‐314 blocks the hyperpolarization‐activated inward current Iq in hippocampal CA1 pyramidal cells. J Neurophysiol 73, 911–915. [DOI] [PubMed] [Google Scholar]
- Pinching AJ & Powell TP (1971a). The neuron types of the glomerular layer of the olfactory bulb. J Cell Sci 9, 305–345. [DOI] [PubMed] [Google Scholar]
- Pinching AJ & Powell TP (1971b). The neuropil of the periglomerular region of the olfactory bulb. J Cell Sci 9, 379–409. [DOI] [PubMed] [Google Scholar]
- Poncelet M, Arnone M, Heaulme M, Gonalons N, Gueudet C, Santucci V, Thurneyssen O, Keane P, Gully D, Le Fur G, Soubrié P (1993). Neurobehavioural effects of SR 27897, a selective cholecystokinin type A (CCK‐A) receptor antagonist. Naunyn Schmiedebergs Arch Pharmacol 348, 102–107. [DOI] [PubMed] [Google Scholar]
- Pressler RT & Strowbridge BW (2006). Blanes cells mediate persistent feedforward inhibition onto granule cells in the olfactory bulb. Neuron 49, 889–904. [DOI] [PubMed] [Google Scholar]
- Price JL & Powell TP (1970). The morphology of the granule cells of the olfactory bulb. J Cell Sci 7, 91–123. [DOI] [PubMed] [Google Scholar]
- Rall W, Shepherd GM, Reese TS & Brightman MW (1966). Dendrodendritic synaptic pathway for inhibition in the olfactory bulb. Exp Neurol 14, 44–56. [DOI] [PubMed] [Google Scholar]
- Ramirez DM & Kavalali ET (2011). Differential regulation of spontaneous and evoked neurotransmitter release at central synapses. Curr Opin Neurobiol 21, 275–282. [DOI] [PMC free article] [PubMed] [Google Scholar]
- Rehfeld JF ( 1978). Immunochemical studies on cholecystokinin. II. Distribution and molecular heterogeneity in the central nervous system and small intestine of man and hog. J Biol Chem 253, 4022–4030. [PubMed] [Google Scholar]
- Romon y Cajal S (1909. –1911). Histologie du système nerveux de l'homme & des vertébrés. Maloine, Paris. [Google Scholar]
- Saito A, Williams JA & Goldfine ID (1981). Alterations in brain cholecystokinin receptors after fasting. Nature 289, 599–600. [DOI] [PubMed] [Google Scholar]
- Schiffmann SN & Vanderhaeghen JJ (1991). Distribution of cells containing mRNA encoding cholecystokinin in the rat central nervous system. J Comp Neurol 304, 219–233. [DOI] [PubMed] [Google Scholar]
- Schneider SP & Macrides F (1978). Laminar distributions of internuerons in the main olfactory bulb of the adult hamster. Brain Res Bull 3, 73–82. [DOI] [PubMed] [Google Scholar]
- Schoenfeld TA, Marchand JE & Macrides F (1985). Topographic organization of tufted cell axonal projections in the hamster main olfactory bulb: an intrabulbar associational system. J Comp Neurol 235, 503–518. [DOI] [PubMed] [Google Scholar]
- Seroogy KB, Brecha N & Gall C (1985). Distribution of cholecystokinin‐like immunoreactivity in the rat main olfactory bulb. J Comp Neurol 239, 373–383. [DOI] [PubMed] [Google Scholar]
- Shao Z, Puche AC, Liu S & Shipley MT (2012). Intraglomerular inhibition shapes the strength and temporal structure of glomerular output. J Neurophysiol 108, 782–793. [DOI] [PMC free article] [PubMed] [Google Scholar]
- Shepherd GM, Chen WR, Willhite D, Migliore M & Greer CA (2007). The olfactory granule cell: from classical enigma to central role in olfactory processing. Brain Res Rev 55, 373–382. [DOI] [PubMed] [Google Scholar]
- Talbot MJ & Sayer RJ (1996). Intracellular QX‐314 inhibits calcium currents in hippocampal CA1 pyramidal neurons. J Neurophysiol 76, 2120–2124. [DOI] [PubMed] [Google Scholar]
- Tanganelli S, Fuxe K, Antonelli T, O'Connor WT & Ferraro L (2001). Cholecystokinin/dopamine/GABA interactions in the nucleus accumbens: biochemical and functional correlates. Peptides 22, 1229–1234. [DOI] [PubMed] [Google Scholar]
- Urban NN & Sakmann B (2002). Reciprocal intraglomerular excitation and intra‐ and interglomerular lateral inhibition between mouse olfactory bulb mitral cells. J Physiol 542, 355–367. [DOI] [PMC free article] [PubMed] [Google Scholar]
- Vaaga CE, Yorgason JT, Williams JT & Westbrook GL (2017). Presynaptic gain control by endogenous cotransmission of dopamine and GABA in the olfactory bulb. J Neurophysiol 117, 1163–1170. [DOI] [PMC free article] [PubMed] [Google Scholar]
- van den Pol AN (2012). Neuropeptide transmission in brain circuits. Neuron 76, 98–115. [DOI] [PMC free article] [PubMed] [Google Scholar]
- Van Dijk A, Richards JG, Trzeciak A, Gillessen D & Mohler H (1984). Cholecystokinin receptors: biochemical demonstration and autoradiographical localization in rat brain and pancreas using [3H] cholecystokinin8 as radioligand. J Neurosci 4, 1021–1033. [DOI] [PMC free article] [PubMed] [Google Scholar]
- Vanderhaeghen JJ, Lotstra F, De Mey J & Gilles C (1980). Immunohistochemical localization of cholecystokinin‐ and gastrin‐like peptides in the brain and hypophysis of the rat. Proc Natl Acad Sci USA 77, 1190–1194. [DOI] [PMC free article] [PubMed] [Google Scholar]
- Verhagen JV, Wesson DW, Netoff TI, White JA & Wachowiak M (2007). Sniffing controls an adaptive filter of sensory input to the olfactory bulb. Nat Neurosci 10, 631–639. [DOI] [PubMed] [Google Scholar]
- Vucinic D, Cohen LB & Kosmidis EK (2006). Interglomerular center‐surround inhibition shapes odorant‐evoked input to the mouse olfactory bulb in vivo. J Neurophysiol 95, 1881–1887. [DOI] [PubMed] [Google Scholar]
- Wachowiak M, McGann JP, Heyward PM, Shao Z, Puche AC & Shipley MT (2005). Inhibition [corrected] of olfactory receptor neuron input to olfactory bulb glomeruli mediated by suppression of presynaptic calcium influx. J Neurophysiol 94, 2700–2712. [DOI] [PMC free article] [PubMed] [Google Scholar]
- Wachowiak M & Shipley MT (2006). Coding and synaptic processing of sensory information in the glomerular layer of the olfactory bulb. Semin Cell Dev Biol 17, 411–423. [DOI] [PubMed] [Google Scholar]
- Wang H, Zhu YZ, Farook JM, Moochhala S, Teo AL, Lee LK & Wong PT (2003). Genetic variations in CCK2 receptor in PVG hooded and Sprague‐Dawley rats and its mRNA expression on cat exposure. Behav Neurosci 117, 385–390. [DOI] [PubMed] [Google Scholar]
- Wank SA (1995). Cholecystokinin receptors. Am J Physiol Gastrointest Liver Physiol 269, G628–G646. [DOI] [PubMed] [Google Scholar]
- Welker WI ( 1964). Analysis of sniffing of the albino rat. Behaviour 22, 22. [Google Scholar]
- Whitesell JD, Sorensen KA, Jarvie BC, Hentges ST & Schoppa NE (2013). Interglomerular lateral inhibition targeted on external tufted cells in the olfactory bulb. J Neurosci 33, 1552–1563. [DOI] [PMC free article] [PubMed] [Google Scholar]
- Yoo KY, Hwang IK, Lee JC, Cho JH, Kim SM, Jung JY, Kang TC & Won MH (2006). Immunohistochemical localization of glutamate in the gerbil main olfactory bulb using an antiserum directed against glutamate. Anat Histol Embryol 35, 93–96. [DOI] [PubMed] [Google Scholar]
- Zarbin MA, Innis RB, Wamsley JK, Snyder SH & Kuhar MJ (1983). Autoradiographic localization of cholecystokinin receptors in rodent brain. J Neurosci 3, 877–906. [DOI] [PMC free article] [PubMed] [Google Scholar]
- Zhou Z & Belluscio L (2008). Intrabulbar projecting external tufted cells mediate a timing‐based mechanism that dynamically gates olfactory bulb output. J Neurosci 28, 9920–9928. [DOI] [PMC free article] [PubMed] [Google Scholar]