

Abstract
The epidermal growth factor receptor (EGFR, HER1) is a therapeutic target in head and neck squamous cell carcinoma (HNSCC). After initial promising results with EGFR‐targeted therapies such as cetuximab, therapeutic resistance has become a major clinical problem, and new treatment options are therefore necessary. Moreover, the relationship between HER receptors, anti‐EGFR therapies, and the human papillomavirus (HPV) status in HNSCC is not fully understood. In contrast to first‐generation EGFR inhibitors, afatinib irreversibly inhibits multiple HER receptors simultaneously. Therefore, treatment with afatinib might result in a more pronounced therapeutic benefit, even in patients experiencing cetuximab resistance. In this study, the cytotoxic effect of afatinib as single agent and in combination with cisplatin was investigated in cetuximab‐sensitive, intrinsically cetuximab‐resistant, and acquired cetuximab‐resistant HNSCC cell lines with different HPV status under normoxia and hypoxia. Furthermore, the influence of cetuximab resistance, HPV, and hypoxia on the expression of HER receptors was investigated. Our results demonstrated that afatinib was able to establish cytotoxicity in cetuximab‐sensitive, intrinsically cetuximab‐resistant, and acquired cetuximab‐resistant HNSCC cell lines, independent of the HPV status. However, cross‐resistance between cetuximab and afatinib might be possible. Treatment with afatinib caused a G0/G1 cell cycle arrest as well as induction of apoptotic cell death. Additive to antagonistic interactions between afatinib and cisplatin could be observed. Neither cetuximab resistance nor HPV status significantly influenced the expression of HER receptors in HNSCC cell lines. In contrast, the expression of EGFR, HER2, and HER3 was significantly altered under hypoxia. Oxygen deficiency is a common characteristic of HNSCC tumors, and these hypoxic tumor regions often contain cells that are more resistant to treatment. However, we observed that afatinib maintained its cytotoxic effect under hypoxia. In conclusion, our preclinical data support the hypothesis that afatinib might be a promising therapeutic strategy to treat patients with HNSCC experiencing intrinsic or acquired cetuximab resistance.
Keywords: afatinib, cetuximab, epidermal growth factor receptor, head and neck squamous cell carcinoma, human papillomavirus, resistance
Abbreviations
- AnnV
annexin V‐FITC
- CI
combination index
- EGFR
epidermal growth factor receptor
- HIF
hypoxia‐inducible factor
- HNSCC
head and neck squamous cell carcinoma
- HPV
human papillomavirus
- mAb
monoclonal antibody
- MFI
mean fluorescence intensity
- PI
propidium iodide
- R/M
recurrent/metastatic
- SRB
sulforhodamine B
- TKI
tyrosine kinase inhibitor
1. Introduction
Targeted therapies are at the forefront of personalized medicine in cancer treatment. Thanks to our rapidly expanding understanding of the molecular biology of cancer, an increasing number of patients are currently considered as candidates for treatment with molecular targeted pharmaceuticals. Interestingly, the epidermal growth factor receptor (EGFR, HER1) plays an integral role in the tumorigenesis and is richly expressed in a wide range of malignancies, including head and neck squamous cell carcinoma (HNSCC). Increased or sustained activation of the EGFR signaling pathway can convert a normal cell to a malignant cell by providing sustained signals for cell proliferation, anti‐apoptotic signaling, angiogenesis, and metastasis), thus making it a compelling drug target (Mahipal et al., 2014).
Head and neck squamous cell carcinoma is the sixth most common cancer in the world, and despite innovations in surgery and radiotherapy, overall 5‐year survival rates remain poor. HNSCCs are known to express high levels of EGFR, which is associated with poor prognosis (Mahipal et al., 2014). Therefore, inhibition of aberrant activation of the EGFR signal transduction pathway has been a focus of research over the last decades and has led to the development of tyrosine kinase inhibitors (TKIs), including erlotinib and gefitinib, as well as monoclonal antibodies (mAbs) that prevent ligand binding and/or receptor dimerization, such as cetuximab and panitumumab (Zhang et al., 2007). Clinical trials in HNSCC of cetuximab, gefitinib, or erlotinib, as monotherapies, have yielded response rates of only 5–15% (Cohen et al., 2009).
Most cancer treatments are combinations of chemotherapeutic agents and/or radiotherapy. Therefore, it was expected that EGFR‐targeted agents would achieve their greatest efficacy in combination with traditional cytotoxic agents or irradiation. Indeed, cetuximab may enhance the effect of radiotherapy and platinum‐based drugs by (a) inhibiting cell proliferation, cell repopulation, DNA repair, and tumor oxygenation; (b) modulating cell cycle perturbation and cell accumulation in radiosensitive phases; and (c) inducing apoptosis and necrosis (Fan et al., 1993; Skvortsova et al., 2010). In addition, it has already been observed that irradiation treatment results in an increase in EGFR expression on cancer cells (Liang et al., 2003). Furthermore, cetuximab has additional immune‐based mechanisms of activity as it is able to stimulate antibody‐dependent cellular cytotoxicity and enhance cytotoxic T‐lymphocyte cross‐priming by dendritic cells (Kimura et al., 2007; Yang et al., 2013). Both chemotherapy and radiation can also initiate effective antitumor immunity.
As a result, cetuximab has been approved for the treatment of HNSCC in combination with either radiotherapy in the locoregionally advanced disease setting (leading to an absolute survival gain of 10% at 5 years) or with platinum‐based drugs plus 5‐fluorouracil in the recurrent/metastatic (R/M) disease setting (leading to a median survival of 10.1 months versus 7.4 months with chemotherapy alone; Bonner et al., 2006; Vermorken et al., 2008). Although the addition of targeted therapy improves overall survival, lack of durable efficacy due to drug resistance is a major clinical problem (Cohen, 2014). To date, no definitive biomarkers have been identified to predict the efficacy of EGFR‐targeted therapies in patients with HNSCC (Boeckx et al., 2013; Kim et al., 2017).
Therapeutic resistance may arise from mechanisms that can compensate for reduced EGFR signaling and/or mechanisms that can modulate EGFR‐dependent signaling. In literature, activation of HER2 signaling has been associated with cetuximab resistance as its signaling occurs through many of the same downstream effectors of EGFR (Quesnelle and Grandis, 2011; Yonesaka et al., 2011). Therefore, it has been suggested that inhibition of both EGFR and HER2 could be an effective strategy to overcome cetuximab resistance. In HNSCC, increased HER expression has been linked to poor outcomes, including decreased overall survival, locoregional relapse, and treatment failure (Ang et al., 2002; Ganly et al., 2007; Takikita et al., 2011). Furthermore, Wheeler et al. (2008) demonstrated that cetuximab‐resistant HNSCC cells manifested strong activation of HER2 and HER3. In addition, cetuximab resistance could be the result of constitutive activation of the EGFR pathway caused by shedding of the HB‐EGF ligand after activation of ADAM by a stimulus, possibly interleukin 8 (Boeckx et al., 2015a). This HB‐EGF ligand binds not only to EGFR but also to HER4. As a result, inhibitors that bind multiple HER receptors might counteract cetuximab resistance.
Despite the reported intrinsic and acquired resistance to EGFR‐targeting agents, interest in targeting EGFR for the treatment of HNSCC remains high, with new strategies, such as inhibitor combinations and novel irreversible or multitargeting inhibitors, currently being evaluated. The particular mode of activation of the HER network, involving ligand‐induced homo‐ and heterodimerization of the four HER receptors, has prompted a new approach to inhibit this complex network and prevent premature emergence of resistance (Boeckx et al., 2013; Shepard et al., 2008). The simultaneous inhibition of both partners in a HER dimer, using covalent binders that confer irreversible inhibition, represents one of these new paradigms. In contrast to the first‐generation EGFR inhibitors, afatinib is an irreversible HER family blocker that inhibits the enzymatic activity of EGFR, HER2, and HER4 (De Pauw et al., 2016; Li et al., 2008a; Minkovsky and Berezov, 2008; Solca et al., 2012). As HER3 is kinase‐inactive and requires obligate heterodimerization with other HER family receptors, afatinib also inhibits HER3‐mediated signal transduction. The increased inhibition scope of HER receptors by afatinib most likely leads to a more robust blockade of the HER network (Ioannou et al., 2013). Previous preclinical research demonstrated effective cytotoxic activity of afatinib in HNSCC cell lines and xenograft models (Young et al., 2015). Consequently, treatment with afatinib might result in a distinct and more pronounced therapeutic benefit.
Besides crosstalk among the different HER receptor tyrosine kinases, therapeutic resistance may also arise after prolonged exposure of cells to reduced oxygen levels (hypoxia) (Wouters et al., 2007). Hypoxia‐inducible factors (HIFs) are, for instance, able to activate the EGFR signaling pathway (Wouters et al., 2013). As HNSCC is often characterized by hypoxic regions and as there is a link between hypoxia and EGFR signaling, we consider it highly important to investigate the cytotoxic effect of afatinib under both normal and reduced oxygen conditions.
Recent observations show that the human papillomavirus (HPV) is a diagnostic marker for a separate entity of HNSCC with enhanced overall and disease‐free survival, but its use as a predictive marker has not been proven yet (Marur et al., 2010). Although there is a great geographical variation in incidence of HPV‐associated tumors, 2013 global statistics demonstrated a 36% overall prevalence of HPV in HNSCC (Liu et al., 2013), thereby representing a substantial proportion of patients with HNSCC, which seems to further increase over time (Mehanna et al., 2013). HPV oncogenes have not been demonstrated to influence anti‐EGFR antibody response, and therefore, cetuximab treatment should be administered independently of HPV status (Nagel et al., 2013; Pogorzelski et al., 2014). Nevertheless, recent molecular phenotyping demonstrated EGFR‐independent signaling in HPV‐related HNSCC, suggesting that HPV‐positive patients with HNSCC could be less responsive to EGFR inhibitors (Machiels et al., 2015; Seiwert et al., 2015). Seiwert et al. (2015) demonstrated that the mutational landscape of HPV‐positive and HPV‐negative HNSCC differs significantly, which may explain the distinct clinical behavior and prognosis. As a result, further studies are needed to investigate the clinical implications of the observed mutations, with respect to sensitivity to targeted therapies, radiation, and chemotherapy. Research has also demonstrated that the expression of HER2 and HER3 is significantly elevated in HPV‐positive HNSCC in comparison with HPV‐negative HNSCC (Pollock et al., 2015). Furthermore, expression of these HER2 and HER3 receptors has previously been associated with resistance to EGFR inhibitors in HNSCC (Erjala et al., 2006). Consequently, agents targeting multiple HER receptors may have the potential to effectively treat both HPV‐positive and HPV‐negative tumors and may be able to overcome intrinsic and/or acquired cetuximab resistance in HNSCC (Pollock et al., 2015).
The present study aims to provide preclinical data concerning the efficacy of afatinib in monotherapy as well as in combination with cisplatin in HNSCC cell lines with different sensitivity to cetuximab. As the possible association between HPV status and efficacy of EGFR inhibition is still unclear, both HPV‐negative and HPV‐positive cell lines were included. Furthermore, variations in expression of HER family members between cell lines according to cetuximab resistance status, oxygen condition, and HPV status were investigated. In addition, the molecular mechanisms underlying the cytotoxic effect of afatinib were assessed.
2. Materials and methods
2.1. Cell culture
Eleven human HNSCC cancer cell lines with different cetuximab sensitivity and HPV status were included in this study. Cal‐27 and UM‐SCC‐104 were obtained from American Type Culture Collection (ATCC, Rockville, MD, USA) and Merck Millipore (SA/NV, Overijse, Belgium), respectively. SC263 and SQD9 were kindly provided by Sandra Nuyts (University Hospital Leuven, Leuven, Belgium), and LICR‐HN1 and SCC22b were kindly provided by Olivier De Wever (Laboratory of Experimental Cancer Research, Ghent University Hospital, Ghent, Belgium). 93‐VU147‐T was provided by Josephine Dorsman (VU University Medical Center, Amsterdam, the Netherlands). All cell lines were HPV negative, with the exception of 93‐VU147‐T and UM‐SCC‐104. All cell lines were cultured in Dulbecco's modified Eagle's medium, supplemented with 10% fetal bovine serum, 1% penicillin/streptomycin, and 1% l‐glutamine (Life Technologies, Merelbeke, Belgium). Cells were grown as monolayers and maintained in exponential growth in 5% CO2/95% air in a humidified incubator at 37 °C. All cell lines were confirmed free of mycoplasma infection through regular testing (MycoAlert Mycoplasma Detection Kit, Lonza, Verviers, Belgium).
2.2. Oxygen conditions
Hypoxia (1% O2) was achieved in a Bactron IV anaerobic chamber (Shel Lab, Cornelius, OR, USA), as described previously (Wouters et al., 2009). After overnight incubation to allow attachment of cells, hypoxic conditions were initiated immediately after addition of the drug.
2.3. Cytotoxicity assays
Cell survival was assessed using the colorimetric sulforhodamine B (SRB) assay, as previously described (Limame et al., 2012; Pauwels et al., 2003). This assay assesses the number of viable cells after treatment, as it is not possible to make a distinction with this assay between inhibition of proliferation (cytostatic effect) and cell death (cytotoxic effect). Optimal seeding densities for each cell line were determined to ensure exponential growth during the whole duration of the assay. Cells were counted automatically with a Scepter 2.0 device (Merck Millipore SA/NV). After overnight incubation, cells were treated with cetuximab (0–50 nm, 168 h), afatinib (0–10 μm, 72 h), or afatinib in combination with cisplatin (0–10 μm, 24 h). Two sequential combination schedules were tested:
Afatinib for 72 h immediately followed by cisplatin for 24 h;
Cisplatin for 24 h immediately followed by afatinib for 72 h.
The pharmaceuticals, that is, cetuximab (anti‐EGFR mAb, Merck, Darmstadt, Germany) and cisplatin (Selleck Chemicals, Houston, TX, USA), were diluted in sterile PBS. Afatinib (EGFR‐TKI, Selleck Chemicals) was diluted in DMSO (Merck Millipore SA/NV), and further dilutions were made in cell culture medium. IC50 values (i.e., drug concentration causing 50% growth inhibition) were calculated using winnonlin software (Pharsight, Mountain View, CA, USA). Possible synergism between afatinib and cisplatin was determined by calculation of the combination index (CI) using the additive model as described by others (Deben et al., 2016; Jonsson et al., 1998; Valeriote and Lin, 1975). CI < 0.8, CI = 1.0 ± 0.2, and CI > 1.2 indicated synergism, additivity, and antagonism, respectively.
2.4. Generation of resistant cell clones
Generation of resistant cell clones was performed as described previously (Boeckx et al., 2015a). Cetuximab‐resistant variants were derived from the original cetuximab‐sensitive parental SC263 and SCC22b cell lines by continuous exposure to cetuximab, starting with the IC50 concentration of cetuximab. In parallel, controlled parental cells were exposed to the vehicle control (suffix PBS). After 10 dose doublings, dose–response studies were determined for each resistant cell line (suffix R). To examine whether acquired resistance was a transient or permanent effect, dose–response curves of cetuximab were re‐assessed in the resistant cell lines after 6 weeks in culture without cetuximab.
2.5. Expression analysis of HER family members
The cellular membrane expression level of EGFR, HER2, HER3, and HER4 under both normoxia and hypoxia was assessed using flow cytometry. Cells were fixed in 4% formaldehyde (10 min) under normoxia or hypoxia after EGFR, HER2, HER3, and HER4 PE‐conjugated antibody incubation (10 μL/106 cells, 25 μg antibody in 1 mL, R&D Systems, Minneapolis, MN, USA). These receptor‐specific antibodies recognize and bind to the extracellular domain of the receptor. Corresponding isotype controls (respectively, rat IgG2A, mouse IgG2B, mouse IgG1 and mouse IgG2A, 10 μL/106 cells, 50 μg antibody in 2 mL; R&D Systems) were included for all samples and served as negative controls. Dead cells were excluded from the analysis by staining with Live/Dead Fixable Far‐Red Dead Cell Stain Kit (Thermo Fisher Scientific, Merelbeke, Belgium). All samples were measured on a FACScan flow cytometer (BD Biosciences, Erembodegem, Belgium). Flow cytometric data were analyzed using flowjo v10.1 (TreeStar Inc., Ashland, OR, USA). The percentage of EGFR‐, HER2‐, HER3‐ and HER4‐positive cells (overton) was determined in comparison with the corresponding isotype control. Furthermore, the signal for aspecific binding was subtracted from the mean fluorescence intensities (=ΔMFI). This parameter indicates the amount of cellular membrane expression of EGFR, HER2, HER3, and HER4 on individual cells.
2.6. Assays for apoptosis and cell cycle distribution
After overnight incubation, cells were treated for 72 h with afatinib. As the sensitivity to afatinib strongly varied between the cell lines, afatinib concentrations were based on the outcome of the monotherapy experiments and corresponded with the IC20, IC40, and IC60 values specific for each cell line under normoxia and hypoxia. Cell cycle distribution was determined immediately after 72 h of treatment with afatinib under both normoxia and hypoxia, using a CycleTEST™ PLUS DNA reagent kit (BD Biosciences). Induction of apoptotic cell death was investigated flow cytometrically using the annexin V‐FITC (AnnV)/propidium iodide (PI) assay (BD Biosciences). Both assays were performed on a FACScan flow cytometer and analyzed with flowjo v10.1.
Alternatively, the induction of apoptotic cell death was examined by real‐time measurements of caspase‐3/7 activity using the IncuCyte ZOOM live‐cell analysis instrument (Essen BioScience, Ann Arbor, MI, USA). After overnight incubation, cells were treated with afatinib. The IncuCyte caspase‐3/7 green apoptosis reagent (Essen BioScience) was added at the start of treatment at a final concentration of 2.5 μm. This caspase‐3/7 apoptosis reagent is cleaved by activated caspase‐3/7, which results in the release of a DNA dye and green fluorescent staining of nuclear DNA. Images were taken every 2 h from the start of treatment. Kinetic activation of caspase‐3/7 was monitored morphologically using live‐cell imaging and quantified using the IncuCyte basic analyzer (Essen BioScience).
2.7. Statistical analysis
We performed all experiments at least three times independently, unless otherwise stated. In cytotoxicity experiments and IncuCyte Caspase‐3/7 Green Apoptosis Assays, each condition was tested in triplicate in each of the three experiments. Flow cytometry experiments were independently performed three times with one sample for each condition. Results are presented as mean ± standard deviation. The effects of various conditions and treatments were studied using linear regression or linear mixed models in case of nonindependent observations. All models were fitted using a stepwise backward strategy, starting from a model with all fixed effects and their interaction. If the interaction term was not significant, a model with only the main was fitted. If one of these terms was significant, effect sizes were estimated. If the treatment effect was significant, a post hoc analysis with Tukey's correction for multiple testing was performed.
Effects of oxygen and resistance status on the expression of HER family members and afatinib's cytotoxic effect were modeled using a linear mixed model with oxygen status, resistance status, and their interaction as fixed effects. A random intercept for cell line was added to account for the dependence between observations within the same cell line. Furthermore, a separate analysis was performed to test for differences in HER status between HPV‐positive and HPV‐negative HNSCC cell lines. Linear regression models were fitted to study the effect of treatment, oxygen condition, and their interaction on the percentage of G0/G1 cells as well as AnnV+/PI− and AnnV+/PI+ cells. Regarding the combination experiments, differences in IC50 values were tested for significance with the Mann–Whitney U‐test.
graphpad prism 7 (Graphpad Software, La Jolla, CA, USA) was used for data comparison and artwork. All statistical analyses were performed in r version 3.3.2 (The R Foundation for Statistical Computing, Vienna, Austria). P‐values below 0.050 were considered significant.
3. Results
3.1. Identification of HNSCC cell lines with intrinsic cetuximab resistance and generation of cell lines with acquired cetuximab resistance
We previously identified intrinsic resistance to cetuximab in several HNSCC cell lines such as LICR‐HN1 and Cal‐27 (Boeckx et al., 2014). A resistant daughter cell line was already generated from the cetuximab‐sensitive SC263 cell line, in order to establish acquired resistance to cetuximab (Boeckx et al., 2015a). Similarly, sensitivity to cetuximab therapy was investigated in an additional panel of HNSCC cell lines. The dose–response curves of the HNSCC cell lines for cetuximab are shown in Fig. 1. Based on these dose–response curves and the corresponding IC50 values, five of seven HNSCC cell lines (i.e., LICR‐HN1, Cal‐27, SQD9, 93‐VU‐147T, and UM‐SCC‐104) were considered as intrinsically resistant to cetuximab as the percentage of viable cells in these cell lines did not decrease below 50%. SC263 and SCC22b were identified as cetuximab sensitive (IC50 values of 0.12 ± 0.04 nm and 0.41 ± 0.23 nm, respectively).
Figure 1.
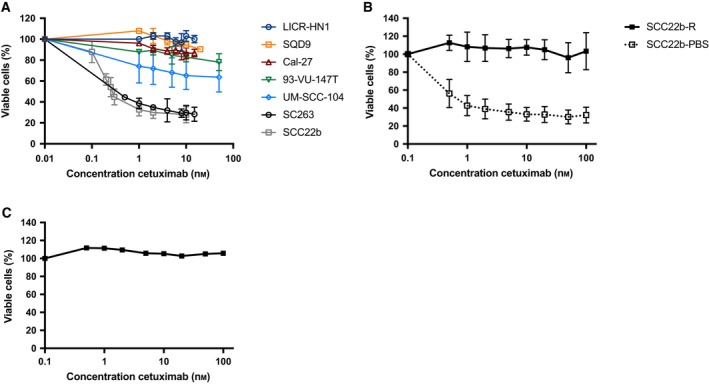
Dose–response curves of cetuximab (168 h) evaluated using the SRB assay. (A) Dose–response curves for HPV‐positive and HPV‐negative HNSCC cell lines. Five of seven HNSCC cell lines (i.e., LICR‐HN1, Cal‐27, SQD9, 93‐VU‐147T, and UM‐SCC104) were considered as intrinsically resistant to cetuximab versus SC263 and SCC22b, which were cetuximab sensitive. (B) Dose–response curves for isogenic cetuximab‐resistant (SCC22b‐R) and cetuximab‐sensitive (SCC22b‐PBS) HNSCC cell lines. (C) Dose–response curve for the cetuximab‐resistant cell line SCC22b‐R after 6 weeks of culture in drug‐free medium, followed by cetuximab treatment for 168 h. This graph represents one experiment executed in threefold.
As mentioned above, one acquired cetuximab‐resistant daughter HNSCC cell line was already generated during previous research (Boeckx et al., 2015a). An additional HNSCC cell line with acquired cetuximab resistance was developed from the human SCC22b HNSCC cell line, shown to be initially cetuximab sensitive. Resistant cells were characterized by performing cell proliferation assays upon exposure to cetuximab (Fig. 1B). A higher proliferation potential was observed in the acquired cetuximab‐resistant SCC22b‐R cells when treated with cetuximab compared to sensitive SCC22b‐PBS cells. Furthermore, the stability of cetuximab resistance was confirmed, as SC263‐R (Boeckx et al., 2015a) and SCC22b‐R (Fig. 1C) remained cetuximab resistant, even after culturing in drug‐free medium for 6 weeks.
3.2. Expression level of HER family members in a panel of HNSCC cell lines with different sensitivity to cetuximab
As afatinib inhibits multiple members of the HER receptor family, we examined the basal cellular membrane protein expression level of these HER family members under normoxic and hypoxic conditions in our panel of HNSCC cell lines with different sensitivity to cetuximab and HPV status.
The majority of HNSCC cell lines showed high percentages of EGFR‐, HER2‐, and HER3‐positive cells (Fig. 2A,C,E). Furthermore, these receptor‐positive cells demonstrated high expression of EGFR, HER2, and HER3 (Fig. 2B,D,F). In contrast, HER4 expression was barely observed in any of the HNSCC cell lines tested, and when detected, HER4 expression levels were very low (data not shown). Remarkably, LICR‐HN1 demonstrated lower levels of EGFR expression in comparison with other HNSCC cell lines. Nevertheless, EGFR, HER2, and HER3 were highly expressed in all other HNSCC cell lines with ΔMFI above 346.7 ± 101.0, 326.3 ± 122.8, and 586.7 ± 54.1, respectively. Interestingly, the intrinsically cetuximab‐resistant cell lines 93‐VU‐147T and SQD9 demonstrated huge levels of, respectively, HER2 (ΔMFI = 1792.3 ± 125.6) and HER3 expression (ΔMFI = 4229.7 ± 1068.2) compared to the other HNSCC cell lines.
Figure 2.
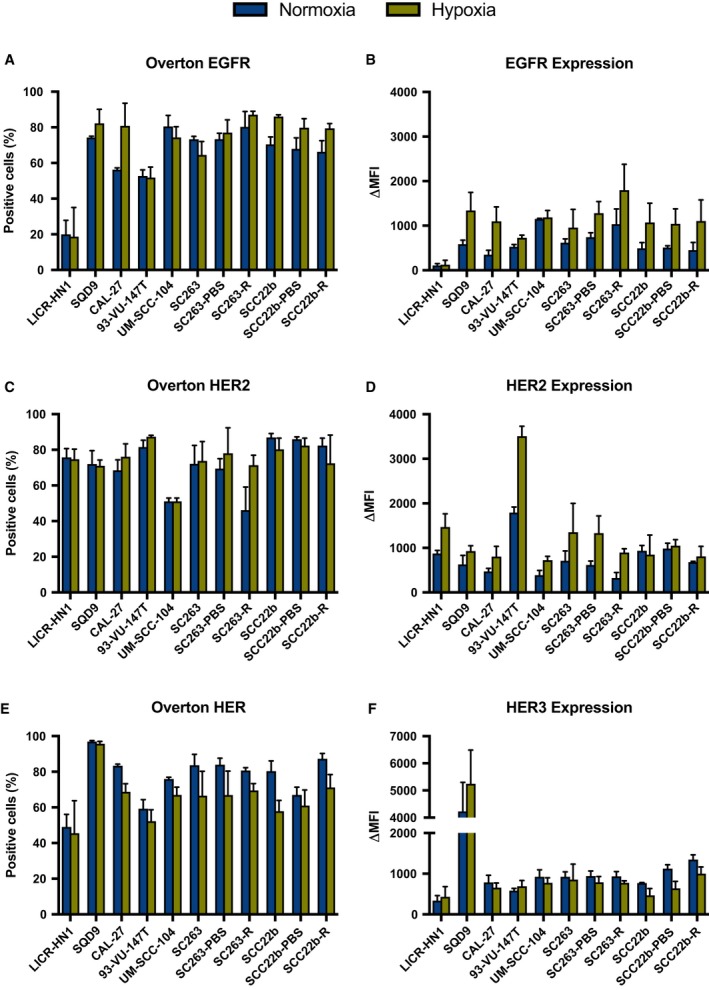
Protein levels of HER receptors under normoxic and hypoxic conditions in a panel of HNSCC cell lines with different sensitivity to cetuximab. The percentage of EGFR‐, HER2‐, and HER3‐positive cells (overton) are presented in A, C, and E, respectively. The expression levels of EGFR, HER2, and HER3 on the corresponding receptor‐positive cells (ΔMFI) are presented in B, D, and F, respectively. Protein levels were measured with the FACScan flow cytometer.
No significant differences in the percentages of EGFR‐, HER2‐, HER3‐, and HER4‐positive cells (P ≥ 0.143) and the ΔMFI of receptor‐positive cells (P ≥ 0.170) were observed between cetuximab‐sensitive, intrinsically cetuximab‐resistant, and acquired cetuximab‐resistant HNSCC cell lines. In addition, no significant effect of HPV status was detected for the percentage of EGFR‐, HER2‐, HER3‐, and HER4‐positive cells (P ≥ 0.302) as well as ΔMFI of receptor‐positive cells (P ≥ 0.110). Hence, the percentage EGFR‐, HER2‐, HER3‐, and HER4‐positive cells and ΔMFI of receptor‐positive cells seems to be cell line specific and independent of HPV status.
Next, the effect of reduced oxygen levels on the expression of EGFR, HER2, HER3, and HER4 was evaluated. No significant interaction between oxygen condition and cetuximab resistance status on EGFR, HER2, HER3, and HER4 expression was found. When looking at the effect of oxygen availability, there was a significant increase in the percentage of EGFR‐positive cells (P = 0.006) and ΔMFI of EGFR‐positive cells (P < 0.001) under hypoxic conditions in all HNSCC cell lines (Table 1). The significant increase in overton for EGFR under hypoxia was mainly observed in acquired cetuximab‐resistant HNSCC cell lines (P = 0.016) (Fig. 3A). The significant increase in ΔMFI of EGFR‐positive cells under hypoxia was detected in cetuximab‐sensitive and intrinsically cetuximab‐resistant as well as acquired cetuximab‐resistant and PBS‐treated HNSCC cell lines (P ≤ 0.018) (Fig. 3B). Regarding HER2, the percentage of HER2‐positive cells increased under hypoxic conditions in all HNSCC cell lines (P = 0.065) (Table 1), especially in intrinsically cetuximab‐resistant HNSCC cell lines (P = 0.024) (Fig. 3A). Moreover, ΔMFI of HER2‐positive cells was significantly raised under hypoxic conditions in all HNSCC cell lines (P < 0.001). This significant increase under hypoxia was mainly noticed in intrinsically cetuximab‐resistant as well as acquired cetuximab‐resistant and PBS‐treated control HNSCC cell lines (P ≤ 0.050) (Fig. 3B). In contrast, for HER3, the percentage of positive cells was significantly decreased under hypoxia in all HNSCC cell lines (P < 0.001) (Table 1). Overall, no significant change in ΔMFI of HER3‐positive cells was observed under reduced oxygen levels (P = 0.425). However, taking the difference in cetuximab resistance status between cell lines into account, a significant decrease in ΔMFI under hypoxia was observed for HER3 in acquired cetuximab‐resistant and PBS‐treated control HNSCC cell lines (P ≤ 0.010) (Fig. 3B). Lastly, HER4 expression was not altered under hypoxic conditions (P ≥ 0.300) (data not shown).
Table 1.
Effect sizes with standard errors for the influence of oxygen condition on the expression levels of EGFR, HER2, HER3, and HER4 in all HNSCC cell lines. The effect size is only reported if there was a significant difference in overton and ΔMFI of HER receptors between normoxia and hypoxia (P‐value ‘effect oxygen’). The effect size represents the difference in mean overton and ΔMFI between normoxia and hypoxia. Positive and negative effect sizes, respectively, indicate an increase and decrease under hypoxia compared to normoxia. The P‐value shows the significance, testing the null hypothesis that the effect size equals zero. P‐values ≤ ≤0.05 are indicated in bold. /, effect size was not shown in case there was no significant effect of oxygen condition on the outcome
| % Positive cells (overton) | Expression level (ΔMFI) | |||||
|---|---|---|---|---|---|---|
| P‐value effect oxygen | Effect size (%) | P‐value effect size | P‐value effect oxygen | Effect size (ΔMFI) | P‐value effect size | |
| EGFR | 0.006 | 5.95 ± 2.03 | 0.003 | < 0.001 | 463.35 ± 64.65 | < 0.001 |
| HER2 | 0.065 | / | / | < 0.001 | 483.62 ± 80.93 | < 0.001 |
| HER3 | < 0.001 | −12.95 ± 1.95 | < 0.001 | 0.425 | / | / |
| HER4 | 0.377 | / | / | 0.300 | / | / |
Figure 3.
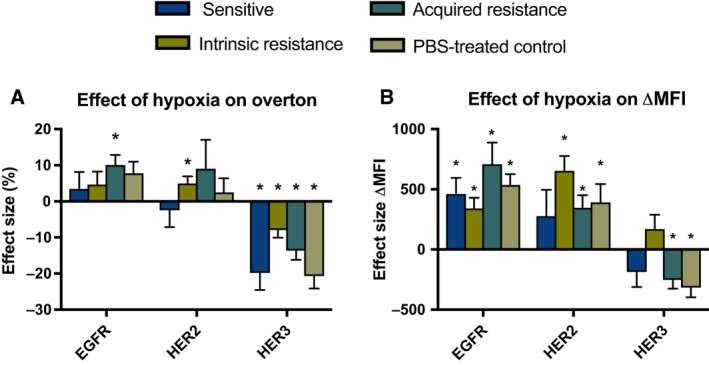
Effect sizes with standard errors for the influence of hypoxia on the expression of HER family members in HNSCC cell lines with different cetuximab resistance status. The effect size represents the difference in mean overton (A) and ΔMFI (B) between normoxia and hypoxia. Positive and negative effect sizes, respectively, indicate an increase and decrease under hypoxia compared to normoxia. The * indicates a significant P‐value for the main effect of oxygen condition.
Overall, these results demonstrated that HNSCC cell lines with different sensitivity to cetuximab contain a high percentage of EGFR‐, HER2‐, and HER3‐positive cells and that these receptors are generally highly expressed on these positive cells. Furthermore, hypoxia significantly affected the expression of these receptors. In contrast, cetuximab resistance and HPV status had no significant influence on the expression of HER receptors. This means that the HNSCC cell lines used in this study are a valid target candidate for treatment with afatinib, according to the target expression of EGFR and HER2.
3.3. Afatinib is able to overcome intrinsic and acquired cetuximab resistance in a panel of HNSCC cell lines under normal and reduced oxygen conditions
The cytotoxic effect of the irreversible HER family blocker afatinib was studied in cetuximab‐sensitive, intrinsically cetuximab‐resistant as well as acquired cetuximab‐resistant and PBS‐treated control HNSCC cell lines under both normoxia and hypoxia. A clear concentration‐dependent cytotoxic effect of afatinib (0–5000 nm) after 72 h of treatment was observed in all HNSCC cell lines (Fig. 4). The IC50 values for afatinib under normoxic conditions ranged from 19 ± 15 nm to 4040 ± 70 nm (Table 2). Neither cetuximab resistance (P = 0.750) nor the HPV status (P = 0.800) seems to influence the inhibitory potential of afatinib. However, certain intrinsically cetuximab‐resistant and acquired cetuximab‐resistant HNSCC cell lines demonstrated higher IC50 values compared to other intrinsically cetuximab‐resistant and acquired cetuximab‐resistant HNSCC cell lines used in this study. For instance, the intrinsically cetuximab‐resistant HNSCC cell lines Cal27 and UM‐SCC‐104 demonstrated considerably lower IC50 values compared to LICR‐HN1 and 93‐VU‐147T. Despite that statistical analysis did not reveal a significant influence of cetuximab resistance on the cytotoxicity of afatinib, these results indicate the possibility of cross‐resistance between cetuximab and afatinib.
Figure 4.
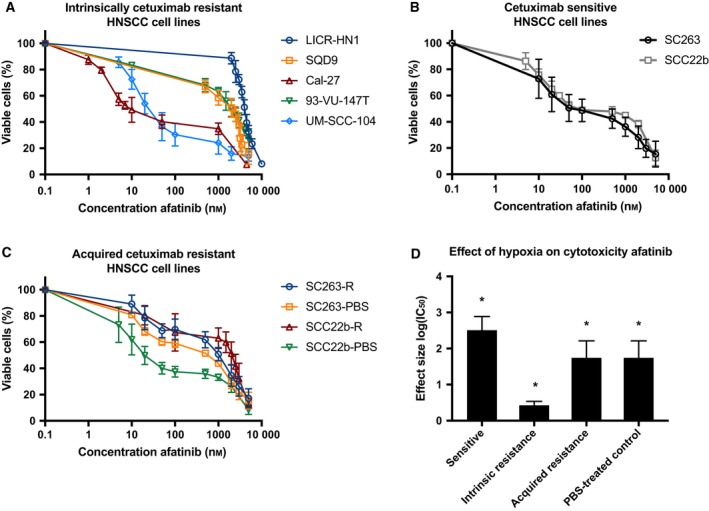
Afatinib's cytotoxicity in cetuximab‐sensitive and cetuximab‐resistant HNSCC cell lines. (A) Dose–response curves of HPV‐positive and HPV‐negative intrinsically cetuximab‐resistant HNSCC cell lines after exposure to afatinib for 72 h under normoxia. (B) Dose–response curves for the cetuximab‐sensitive HNSCC cell lines after exposure to afatinib for 72 h under normoxia. (C) Dose–response curves of acquired cetuximab‐resistant (suffix R) and corresponding cetuximab‐sensitive isogenic cell lines (suffix PBS) after exposure to afatinib for 72 h under normoxia. (D) Effect sizes with standard errors for the influence of hypoxia on afatinib's cytotoxic effect in HNSCC cell lines with different cetuximab resistance status. The average log(IC 50) of afatinib was higher under normoxia compared to hypoxia in cetuximab‐sensitive, intrinsically cetuximab‐resistant, and acquired cetuximab‐resistant HNSCC cell lines. The effect size represents the difference in mean log(IC 50) between normoxia and hypoxia. The * indicates a significant P‐value for the main effect of oxygen condition.
Table 2.
IC50 values and standard errors for HNSCC cell lines after incubation with afatinib for 72 h under normoxic and hypoxic conditions
| Cell line | Cetuximab resistance status | HPV status | IC50 Afatinib 72 h (nm) | |
|---|---|---|---|---|
| Normoxia (21% O2) | Hypoxia (1% O2) | |||
| LICR‐HN1 | Intrinsically resistant | Negative | 4040 ± 70 | 3750 ± 80 |
| SQD9 | Intrinsically resistant | Negative | 1500 ± 310 | 1950 ± 310 |
| Cal27 | Intrinsically resistant | Negative | 19 ± 15 | 7 ± 6 |
| 93‐VU147‐T | Intrinsically resistant | Positive | 2210 ± 260 | 2350 ± 390 |
| UM‐SCC‐104 | Intrinsically resistant | Positive | 34 ± 16 | 22 ± 7 |
| SC263 | Sensitive | Negative | 89 ± 34 | 20 ± 11 |
| SC263‐PBS | PBS‐treated control, sensitive | Negative | 260 ± 110 | 28 ± 12 |
| SC263‐R | Acquired resistant | Negative | 680 ± 270 | 160 ± 60 |
| SCC22b | Sensitive | Negative | 170 ± 110 | 29 ± 18 |
| SCC22b‐PBS | PBS‐treated control, sensitive | Negative | 34 ± 19 | 22 ± 13 |
| SCC22b‐R | Acquired resistant | Negative | 2420 ± 370 | 225 ± 166 |
The cytotoxic effect of afatinib was maintained under reduced oxygen conditions (Table 2). Cetuximab resistance (P = 0.450) and HPV status (P = 0.630) were not associated with afatinib's cytotoxicity under hypoxic conditions. However, statistical analysis showed a significant interaction between resistance status and oxygen condition (P < 0.001). This implies that the difference in IC50 value for afatinib between the normoxia and hypoxia group varies across the different resistance statuses. As such, we analyzed the difference in IC50 value of afatinib between normoxia and hypoxia for cetuximab‐sensitive, intrinsically cetuximab‐resistant, and acquired cetuximab‐resistant HNSCC cell lines. The estimated effect sizes, showing the difference in mean log(IC50) between normoxia and hypoxia, are displayed in Fig. 4D. Significantly higher average log(IC50) values were observed under normoxia compared to log(IC50) values under hypoxia in cetuximab‐sensitive, intrinsically cetuximab‐resistant, and acquired cetuximab‐resistant HNSCC cell lines (P < 0.001). This means that afatinib demonstrated an increased cytotoxicity under hypoxic conditions. However, this effect of hypoxia on afatinib's cytotoxic activity was less pronounced in intrinsically cetuximab‐resistant cell lines.
Overall, afatinib showed a clear concentration‐dependent cytotoxic effect in cetuximab‐sensitive, intrinsically cetuximab‐resistant, and acquired cetuximab‐resistant HNSCC cell lines. Furthermore, our results demonstrate that therapeutic resistance to afatinib is not associated with HPV infection or prolonged exposure to hypoxia in our panel of HNSCC cell lines with different sensitivities to cetuximab.
3.4. Molecular mechanisms underlying the cytotoxic effect of afatinib
3.4.1. Treatment with afatinib results in a G0/G1 cell cycle arrest
As presented in Fig. 5, treatment with afatinib under both normoxia and hypoxia led to an increase in the percentage of G0/G1 cells, accompanied by a decrease in the percentage of cells in the S and G2/M phases, in the majority of the HNSCC cell lines, irrespective of their sensitivity to cetuximab.
Figure 5.
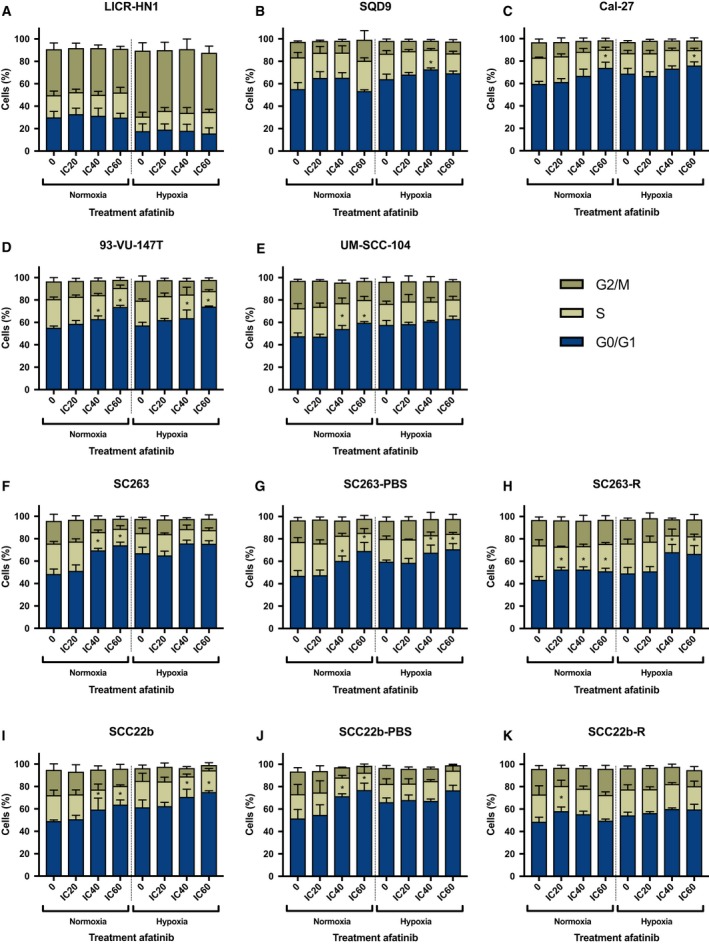
Cell cycle distribution in HNSCC cell lines after afatinib treatment (0 nm, IC 20, IC 40, IC 60) under both normoxic and hypoxic conditions. Cells were stained with PI and DNA content was measured by flow cytometric analysis. Cells were divided into 3 groups: G0/G1 phase (2n), S phase (2n–4n), and G2/M phase (4n). Treatment with afatinib led to an increase of the proportion of cells in the G0/G1 phase of the cell cycle in the majority of HPV‐negative (A–C) and HPV‐positive (D, E) intrinsically cetuximab‐resistant HNSCC cell lines under both normoxia and hypoxia. This G0/G1 cell cycle arrest was also observed in cetuximab‐sensitive (F, I) as well as isogenic acquired cetuximab‐resistant and PBS‐treated control HNSCC cell lines (G, H, J, and K). *P‐value effect treatment on the percentage G0/G1 cells ≤ 0.050.
The effects of treatment and oxygen condition as well as their interaction on the percentage of G0/G1 cells were analyzed using linear regression analyses (Table 3). A significant interaction indicates that the effect of afatinib treatment on the percentage of G0/G1 cells is different under normoxia versus hypoxia. Moreover, it also implies that the effect of oxygen condition on the percentage of G0/G1 cells varies after treatment with different afatinib concentrations. The interaction between treatment and oxygen status was found to be significant in half of the HNSCC cell lines used in this study, indicating a cell line‐specific effect (Table 3). If the interaction was not significant, a model with the main effects of treatment and oxygen condition was performed. Thus, in absence of a significant interaction, the effect of treatment is valid under both normoxia and hypoxia. With regard to the effect of treatment under normoxia, afatinib induced a significant increase in the proportion of G0/G1 cells in all cell lines, except for LICR‐HN1. Compared to treatment under normoxia, the effect of afatinib on the G0/G1 cell cycle arrest was generally lower or equal under hypoxia in cetuximab‐sensitive and intrinsically cetuximab‐resistant HNSCC cell lines, except for SQD9. Remarkably, in the acquired cetuximab‐resistant cell lines, the increase in G0/G1 cells after treatment under normoxia was less pronounced compared to the isogenic PBS‐treated control cell lines, especially in the SCC22b‐R versus SCC22b‐PBS cell line. The influence of hypoxia on the G0/G1 cell cycle arrest induced by afatinib was variable in these acquired cetuximab‐resistant HNSCC cell lines. For instance, treatment with afatinib under hypoxia, compared to normoxia, resulted in a more pronounced G0/G1 cell cycle arrest in the acquired cetuximab‐resistant SC263‐R cell line but not in the SCC22b‐R cell line.
Table 3.
P‐values for the interaction of treatment and oxygen condition on the percentage of cells in the G0/G1 phase of the cell cycle in HNSCC cell lines. If the interaction was not significant (P > 0.050), a model with the main effects of treatment and oxygen condition was fitted to test the significance of treatment effect and oxygen condition separately. NE: main effects were not estimated in case of a significant interaction between treatment and oxygen. Values ≤ ≤0.05 are indicated in bold
| Cell line | P‐value interaction treatment and oxygen condition | P‐value main effect treatment | P‐value main effect oxygen condition |
|---|---|---|---|
| LICR‐HN1 | 0.991 | 0.722 | < 0.001 |
| SQD9 | 0.029 | NE | NE |
| Cal27 | 0.433 | < 0.001 | < 0.001 |
| 93‐VU‐147T | 0.776 | < 0.001 | 0.149 |
| UM‐SCC‐104 | 0.026 | NE | NE |
| SC263 | < 0.001 | NE | NE |
| SC263‐PBS | 0.288 | < 0.001 | < 0.001 |
| SC263‐R | 0.003 | NE | NE |
| SCC22b | 0.997 | < 0.001 | < 0.001 |
| SCC22b‐PBS | 0.008 | NE | NE |
| SCC22b‐R | 0.013 | NE | NE |
Overall, treatment with afatinib under both normoxia and hypoxia established a significant G0/G1 cell cycle arrest. However, the influence of hypoxia on this treatment induced G0/G1 cell cycle arrest was cell line specific and independent of HPV status as well as cetuximab sensitivity.
3.4.2. Treatment with afatinib leads to the induction of apoptotic cell death
Besides the capacity of afatinib to induce a G0/G1 cell cycle arrest, we also assessed its ability to induce programmed apoptotic cell death using the AnnV/PI flow cytometric assay. This technique identifies cells in early (AnnV+/PI−) or late (AnnV+/PI+) phases of apoptosis. The majority of intrinsically cetuximab‐resistant HNSCC cell lines demonstrated a dose‐dependent increase in AnnV+/PI− and AnnV+/PI+ cells as well as a corresponding decrease in viable AnnV−/PI− cells after 72 h of treatment with afatinib under normal and reduced oxygen conditions (Fig. 6). However, in cetuximab‐sensitive, acquired cetuximab‐resistant, and PBS‐treated control HNSCC cell lines, afatinib induced an increase in AnnV+/PI− and AnnV+/PI+ cells after treatment with higher doses afatinib under both normoxia and hypoxia (Fig. 6). This induction of apoptotic cell death after treatment with afatinib under normoxia was confirmed by real‐time measurements of active caspase‐3/7 using the IncuCyte system. After 24 h of afatinib treatment, a significant dose‐depending increase in green object count, indicating an increased caspase‐3/7 activity, was observed in the majority of HNSCC cell lines (Fig. 7).
Figure 6.
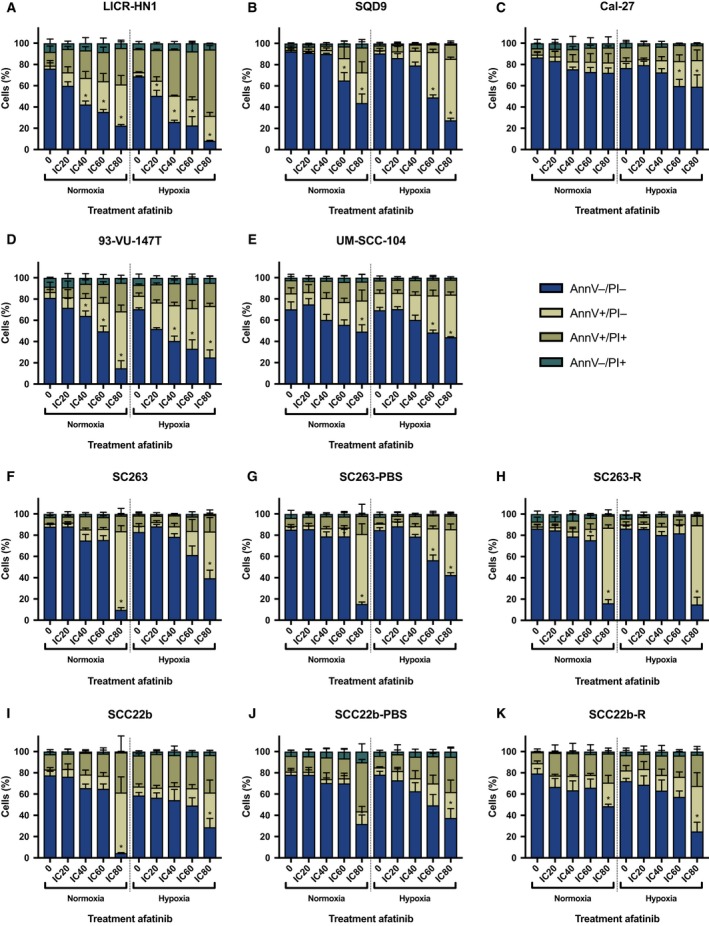
Induction of apoptotic cell death in HNSCC cell lines after afatinib treatment (0 nm, IC 20, IC 40, IC 60, IC 80) under both normoxic and hypoxic conditions. Cells were stained with annexin V‐FITC (AnnV) and PI and measured flow cytometrically. Treatment with afatinib induced an increase in the percentage of AnnV+/PI− and AnnV+/PI+ cells with a corresponding decrease of the percentage viable (AnnV−/PI−) cells in the majority of HPV‐negative (A–C) and HPV‐positive (D, E) intrinsically cetuximab‐resistant HNSCC cell lines under both normal and reduced oxygen conditions. This induction of apoptotic cell death was also observed in cetuximab‐sensitive (F, I) as well as acquired cetuximab‐resistant and PBS‐treated control (G, H, J, and K) HNSCC cell lines. *P‐value effect treatment on the percentage AnnV+/PI− cells ≤ 0.050.
Figure 7.
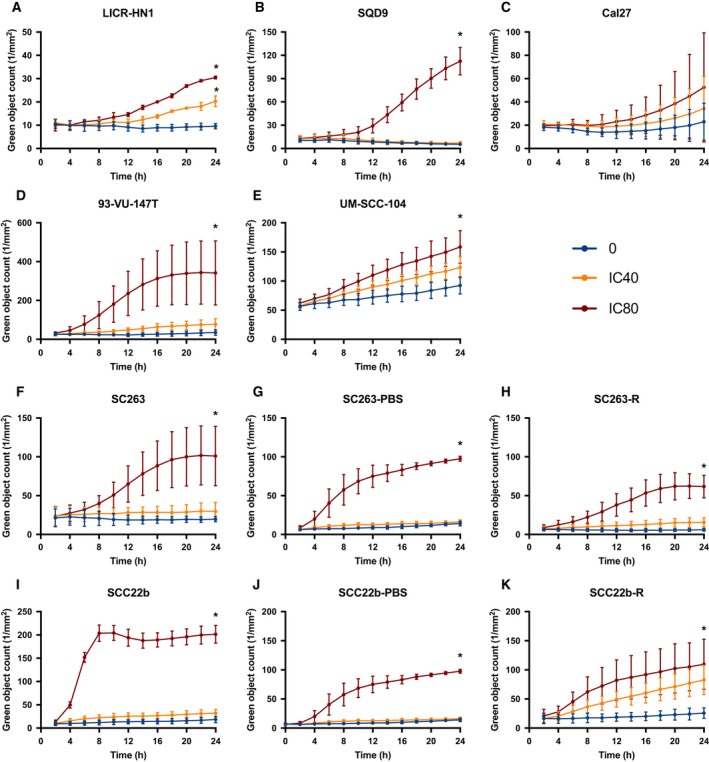
Caspase‐3/7 activity in HNSCC cell lines during afatinib treatment (0 nm, IC 40, IC 80) under normoxic conditions. The induction of apoptosis was detected by real‐time measurements of active caspase‐3/7 during afatinib treatment using the IncuCyte system. The green object count corresponds with the caspase‐3/7 activity. After 24 h, treatment with afatinib induced a significant increase in caspase‐3/7 activity in the majority of HPV‐negative (A–C) and HPV‐positive (D, E) intrinsically cetuximab‐resistant HNSCC cell lines. This significant increase in caspase‐3/7 activity was also detected in cetuximab‐sensitive (F, I), acquired cetuximab‐resistant, and PBS‐treated control (G, H, J, and K) HNSCC cell lines. *P‐value effect treatment on the green object count ≤ 0.050.
The effects of treatment and oxygen condition as well as their interaction on the percentage of AnnV−/PI−, AnnV+/PI−, and AnnV+/PI+ cells were determined using linear regression (Table 4). After 72 h of afatinib treatment, AnnV+ cells are mainly PI− and thus in the early phase of apoptosis. When looking at the viable cells and early apoptotic cells, the interaction between treatment and oxygen status was found significant in half of the HNSCC cell lines used in this study, indicating a cell line‐specific effect. Significant interaction indicated that the effect of afatinib treatment on the percentage of viable and early apoptotic is different under normoxia versus hypoxia. Moreover, it also implies that the effect of oxygen condition on the percentage of viable and early apoptotic cells varies after treatment with different concentrations afatinib. For example, the percentage of AnnV+/PI− cells was considerable high after treatment under hypoxia in comparison with treatment under normoxia in UM‐SCC‐104 cells. This is consistent with our previous findings in the cytotoxicity assay, indicating that the number of viable cells after afatinib treatment decreases more under hypoxic compared to normoxic conditions. When cells were already in late apoptosis after 72 h of treatment, no significant interaction between treatment and oxygen status was found in the majority of HNSCC cell lines used in this study (Table 4).
Table 4.
P‐values for the interaction of treatment and oxygen condition on the percentage of AnnV−/PI−, AnnV+/PI−, and AnnV+/PI+ cells in HNSCC cell lines. If the interaction was not significant (P > 0.050), a model with the main effects of treatment and oxygen condition was fitted to test the significance of the effect of treatment and oxygen condition separately. NE: main effects were not estimated in case of a significant interaction between treatment and oxygen. Values ≤ ≤0.05 are indicated in bold
| Cell line | P‐value interaction treatment and oxygen condition | P‐value main effect treatment | P‐value main effect oxygen condition |
|---|---|---|---|
| AnnV−/PI− | |||
| LICR‐HN1 | 0.393 | < 0.001 | < 0.001 |
| SQD9 | 0.020 | NE | NE |
| Cal27 | 0.538 | < 0.001 | < 0.001 |
| 93‐VU‐147T | 0.001 | NE | NE |
| UM‐SCC‐104 | 0.694 | < 0.001 | 0.053 |
| SC263 | < 0.001 | NE | NE |
| SC263‐PBS | < 0.001 | NE | NE |
| SC263‐R | 0.682 | < 0.001 | 0.342 |
| SCC22b | < 0.001 | NE | NE |
| SCC22b‐PBS | 0.103 | < 0.001 | 0.053 |
| SCC22b‐R | 0.048 | NE | NE |
| AnnV+/PI− | |||
| LICR‐HN1 | 0.030 | NE | NE |
| SQD9 | 0.002 | NE | NE |
| Cal27 | 0.296 | 0.003 | 0.003 |
| 93‐VU‐147T | 0.005 | NE | NE |
| UM‐SCC‐104 | 0.191 | < 0.001 | 0.003 |
| SC263 | < 0.001 | NE | NE |
| SC263‐PBS | < 0.001 | NE | NE |
| SC263‐R | 0.778 | < 0.001 | 0.259 |
| SCC22b | 0.005 | NE | NE |
| SCC22b‐PBS | 0.371 | < 0.001 | < 0.001 |
| SCC22b‐R | 0.042 | NE | NE |
| AnnV+/PI+ | |||
| LICR‐HN1 | 0.007 | NE | NE |
| SQD9 | 0.016 | NE | NE |
| Cal27 | 0.396 | 0.124 | 0.023 |
| 93‐VU‐147T | 0.086 | < 0.001 | 0.023 |
| UM‐SCC‐104 | 0.682 | 0.090 | 0.209 |
| SC263 | 0.531 | < 0.001 | 0.339 |
| SC263‐PBS | 0.805 | 0.017 | 0.286 |
| SC263‐R | 0.870 | 0.092 | 0.538 |
| SCC22b | 0.130 | 0.017 | 0.001 |
| SCC22b‐PBS | 0.095 | < 0.001 | 0.450 |
| SCC22b‐R | 0.653 | 0.012 | 0.769 |
3.5. Combining afatinib with cisplatin in HNSCC cell lines with different sensitivity to cetuximab shows additive to antagonistic effects
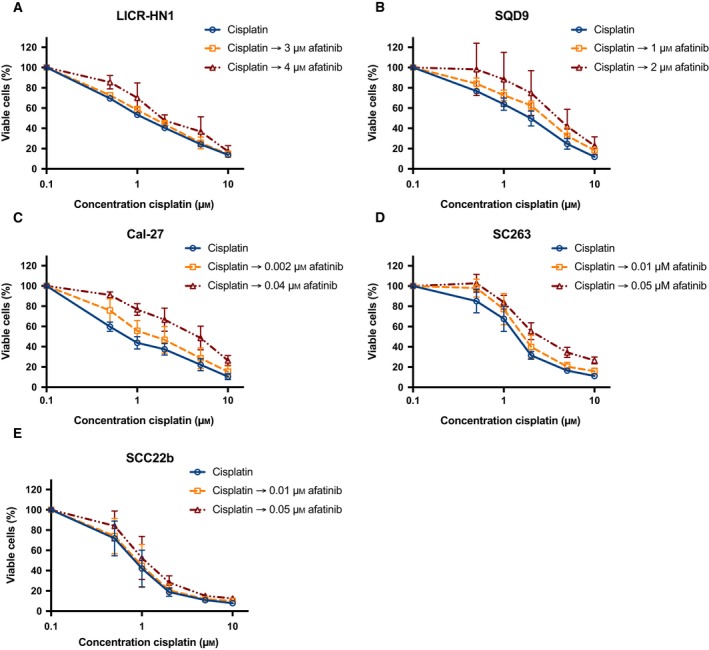
To investigate the potential interaction between afatinib and cisplatin, tumor cells were incubated with fixed doses of afatinib for 72 h combined with sequential treatment of 0–10 μm cisplatin for 24 h. The fixed afatinib concentrations were based on the outcome of the monotherapy experiments and correspond with the IC20 and IC40 values specific for each cell line. The dose–response curves of the cetuximab‐sensitive and intrinsically cetuximab‐resistant cell lines after treatment with these combination regimens are shown in Figs 7 and 8. All HNSCC cell lines were sensitive to treatment with cisplatin monotherapy with IC50 values ranging from 0.83 ± 0.11 μm to 4.65 ± 0.33 μm (Table 5). Compared to cisplatin treatment alone, treatment with afatinib before cisplatin demonstrated no significant decrease in IC50 value (P ≥ 0.149). In contrast, treatment with cisplatin followed by afatinib resulted generally in a significant increase in IC50 compared to the IC50 of cisplatin monotherapy (0.050 ≤ P ≤ 0.825). Furthermore, CI ranged from 1.01 ± 0.06 to 1.96 ± 0.40. Thus, sequential exposure to afatinib followed by cisplatin or the inverse regimen (i.e., cisplatin followed by afatinib) revealed additive or subadditive to antagonistic, yet no synergistic interactions.
Figure 8.
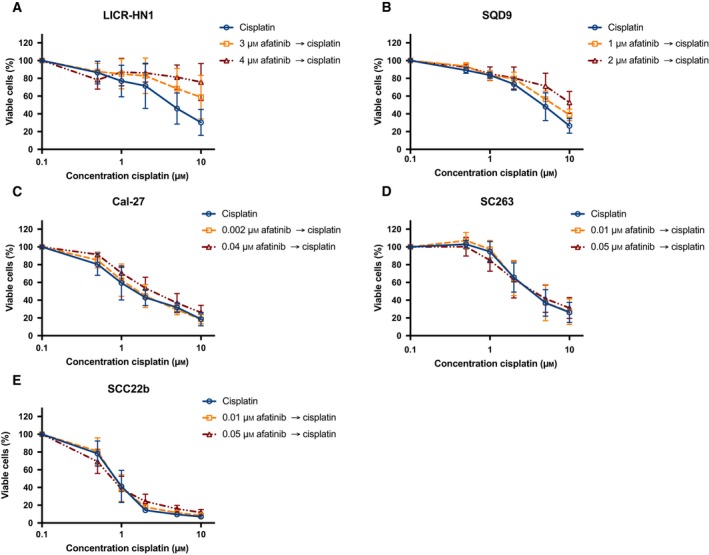
The cytotoxic effects of afatinib followed by cisplatin treatment in a panel of HNSCC cell lines with different sensitivity to cetuximab. Dose–response curves for the intrinsically cetuximab‐resistant cell lines LICR‐HN1 (A), SQD9 (B), and Cal‐27 (C) indicate an additive to antagonistic effect. Dose–response curves for the cetuximab‐sensitive cell lines SC263 (D) and SCC22b (E) show an additive to subadditive effect. Survival curves were corrected for the cytotoxic effect of 72‐h afatinib alone. Cells were treated with fixed concentrations afatinib, which were based on the outcome of the monotherapy experiments.
Table 5.
IC50, CI, and standard errors for HNSCC cell lines after sequential treatment with afatinib followed by cisplatin as well as cisplatin followed by afatinib. CI < 0.8, CI = 1.0 ± 0.2, and CI > 1.2 indicated synergism, additivity, or antagonism, respectively. ND, not determined, as cell survival did not decrease below 50%. P ≤ 0.050, significant difference in IC50 compared to cisplatin monotherapy. P‐values ≤ ≤0.05 are indicated in bold. –, cannot be calculated
| Cell line | Condition | IC50 (μm) | P‐value | CI |
|---|---|---|---|---|
| LICR‐HN1 | 72 h 0 μm afatinib → 24 h cisplatin | 4.42 ± 0.49 | – | – |
| 72 h 3 μm afatinib → 24 h cisplatin | ND | – | 1.34 ± 0.38 | |
| 72 h 4 μm afatinib → 24 h cisplatin | ND | – | 1.50 ± 0.65 | |
| 24 h cisplatin → 72 h 0 μm afatinib | 1.25 ± 0.05 | – | – | |
| 24 h cisplatin → 72 h 3 μm afatinib | 1.48 ± 0.04 | 0.050 | 1.07 ± 0.02 | |
| 24 h cisplatin → 72 h 4 μm afatinib | 2.25 ± 0.37 | 0.050 | 1.30 ± 0.13 | |
| SQD9 | 72 h 0 μm afatinib → 24 h cisplatin | 4.65 ± 0.33 | – | – |
| 72 h 1 μm afatinib → 24 h cisplatin | 6.58 ± 0.61 | 0.149 | 1.16 ± 0.185 | |
| 72 h 2 μm afatinib → 24 h cisplatin | ND | – | 1.33 ± 0.42 | |
| 24 h cisplatin → 72 h 0 μm afatinib | 1.78 ± 0.14 | – | – | |
| 24 h cisplatin → 72 h 1 μm afatinib | 2.78 ± 0.28 | 0.050 | 1.27 ± 0.17 | |
| 24 h cisplatin → 72 h 2 μm afatinib | 4.06 ± 0.16 | 0.050 | 1.56 ± 0.25 | |
| Cal‐27 | 72 h 0 μm afatinib → 24 h cisplatin | 1.72 ± 0.28 | – | – |
| 72 h 0.002 μm afatinib → 24 h cisplatin | 1.83 ± 0.28 | 0.465 | 1.01 ± 0.06 | |
| 72 h 0.04 μm afatinib → 24 h cisplatin | 2.68 ± 0.49 | 0.175 | 1.23 ± 0.11 | |
| 24 h cisplatin → 72 h 0 μm afatinib | 0.83 ± 0.11 | – | – | |
| 24 h cisplatin → 72 h 0.002 μm afatinib | 1.58 ± 0.19 | 0.127 | 1.31 ± 0.09 | |
| 24 h cisplatin → 72 h 0.04 μm afatinib | 4.07 ± 0.48 | 0.050 | 1.96 ± 0.40 | |
| SC263 | 72 h 0 μm afatinib → 24 h cisplatin | 3.48 ± 0.64 | – | – |
| 72 h 0.01 μm afatinib → 24 h cisplatin | 3.44 ± 0.78 | 1.000 | 1.02 ± 0.02 | |
| 72 h 0.05 μm afatinib → 24 h cisplatin | 3.72 ± 0.71 | 0.827 | 1.03 ± 0.12 | |
| 24 h cisplatin → 72 h 0 μm afatinib | 1.44 ± 0.20 | – | – | |
| 24 h cisplatin → 72 h 0.01 μm afatinib | 1.82 ± 0.35 | 0.513 | 1.24 ± 0.11 | |
| 24 h cisplatin → 72 h 0.05 μm afatinib | 2.87 ± 0.71 | 0.050 | 1.73 ± 0.51 | |
| SCC22b | 72 h 0 μm afatinib → 24 h cisplatin | 0.87 ± 0.09 | – | – |
| 72 h 0.01 μm afatinib → 24 h cisplatin | 0.88 ± 0.13 | 0.602 | 1.13 ± 0.13 | |
| 72 h 0.05 μm afatinib → 24 h cisplatin | 0.80 ± 0.17 | 1.37 ± 0.42 | ||
| 24 h cisplatin → 72 h 0 μm afatinib | 0.84 ± 0.09 | – | – | |
| 24 h cisplatin → 72 h 0.01 μm afatinib | 0.90 ± 0.12 | 0.825 | 1.11 ± 0.10 | |
| 24 h cisplatin → 72 h 0.05 μm afatinib | 1.15 ± 0.20 | 0.268 | 1.38 ± 0.18 |
Figure 9.
The cytotoxic effect of cisplatin followed by afatinib treatment in a panel of HNSCC cell lines with different sensitivity to cetuximab. Dose–response curves for the intrinsically cetuximab‐resistant cell lines LICR‐HN1 (A), SQD9 (B), and Cal‐27 (C) also indicate an additive to antagonistic effect. Dose–response curves for the cetuximab‐sensitive cell lines SC263 (D) and SCC22b (E) show an additive to antagonistic effect. Survival curves were corrected for the cytotoxic effect of 72‐h afatinib alone. Cells were treated with fixed concentrations afatinib, which were based on the outcome of the monotherapy experiments.
4. Discussion
Therapeutic resistance to EGFR‐targeted therapies remains a major clinical problem. In order to overcome resistance to these EGFR‐targeted therapies, new treatment options are urgently needed. Due to extensive crosstalk among HER receptors, blockade of one HER receptor can be partially compensated by other HER family members, which therefore must be targeted by new therapeutic regimens. In contrast to the first‐generation EGFR inhibitors, afatinib blocks irreversibly EGFR, HER2, and HER4. As a result, we hypothesized that treatment with afatinib might result in a distinct and more pronounced therapeutic benefit. To test this hypothesis, we investigated the cytotoxicity of afatinib in a panel of two HPV‐positive and nine HPV‐negative HNSCC cell lines that are either sensitive or intrinsically/acquired resistant to cetuximab.
We observed that the majority of HNSCC cell lines used in this study demonstrated high expression of EGFR, HER2, and HER3, but rather low HER4 expression under both normal and reduced oxygen conditions. It has already been established that EGFR is a key survival factor under hypoxic conditions, as EGFR stimulates HIF signaling to improve cellular survival (Wouters et al., 2013). On the other hand, HIF signaling can also activate the EGFR pathway, potentiating survival and tumor growth (Wang and Schneider, 2010). Consistent with previous studies, we demonstrated that the percentage of EGFR‐positive cells and the EGFR expression level was significantly increased under reduced oxygen conditions (Krause et al., 2005; Laderoute et al., 1992; Swinson and O'Byrne, 2006). Besides the effect on EGFR expression, hypoxia also induced a significant raise in HER2 expression. In contrast, a significant decrease in the percentage of HER3‐positive cells but not in HER3 expression level was observed under hypoxia. No effect of hypoxia on HER4 expression was noticed.
Previous research demonstrated that EGFR is expressed in more than 90% of HNSCC and that high EGFR expression is correlated with worse outcomes (Ang et al., 2002; Cohen, 2006; Dassonville et al., 1993; Rubin Grandis et al., 1996, 1998; Santini et al., 1991). However, EGFR expression level and gene copy number are not predictive for response to treatment with EGFR‐targeted therapies plus platinum/5‐fluorouracil as first‐line therapy for patients with R/M HNSCC (Licitra et al., 2011, 2013). Furthermore, increased HER2 and HER3 expression have been associated with gefitinib resistance (Erjala et al., 2006). Thus, cetuximab resistance may arise from alterations in the expression level of HER receptors. In our study, no significant changes in expression of HER receptors were found between cetuximab‐sensitive, intrinsically cetuximab‐resistant, and acquired cetuximab‐resistant HNSCC cell lines. Nevertheless, the kinase activity of these receptors can still be strongly induced in cetuximab‐resistant cells (Wheeler et al., 2008), making inhibition of homo‐ and heterodimerization of these HER receptors still a promising strategy to overcome cetuximab resistance.
Overall, as the majority of our HNSCC cell lines demonstrated high EGFR, HER2, and HER3 expression under normal and reduced oxygen conditions, these intrinsically cetuximab‐resistant and acquired cetuximab‐resistant HNSCC cell lines are valid target candidates for afatinib treatment.
In the current study, we demonstrated that afatinib indeed has the potential to overcome intrinsic and acquired cetuximab resistance in both HPV‐positive and HPV‐negative HNSCC tumors, as it was able to establish a cytotoxic effect in HNSCC cell lines with different cetuximab sensitivity and HPV status. No significant effect of cetuximab resistance status and HPV status on the cytotoxic effect of afatinib was observed. Our results are in concordance with those of others who showed that targeting multiple members of the HER receptor family is effective in overcoming intrinsic and acquired cetuximab resistance (Iida et al., 2014, 2016; Quesnelle and Grandis, 2011). Furthermore, a phase II study has recently demonstrated that afatinib showed antitumor activity comparable to cetuximab with lack of cross‐resistance (Seiwert et al., 2014). Thus, inhibition of multiple members of the HER receptor family seems to be necessary in order to completely overcome intrinsic and acquired cetuximab resistance. Nevertheless, previous research by us and others demonstrated that MEHD7945A, a dual mAb targeting EGFR and HER3, is only partially able to overcome cetuximab resistance in HNSCC cell lines (De Pauw et al., 2017; Fayette et al., 2016). These studies suggested the presence of additional resistance mechanisms to cetuximab treatment besides HER3 signaling. As afatinib irreversibly inhibits EGFR, HER2 as well as HER4 and consequently also HER3 by inhibiting its dimerization partners, a more pronounced therapeutic benefit with afatinib might be expected in patients with HNSCC experiencing cetuximab resistance.
Despite that statistical analysis did not reveal a significant influence of cetuximab resistance on the cytotoxicity of afatinib, our results indicated the possibility of cross‐resistance between cetuximab and afatinib. The presence of cross‐resistance between cetuximab and afatinib indicates that resistance to EGFR inhibitors is not exclusively due to alterations of HER receptor signaling.
In the LUX‐Head and Neck 1 phase III trial, progression‐free survival was significantly improved by afatinib compared to methotrexate in patients with second‐line R/M HNSCC (Machiels et al., 2015). In contrast to the study of Seiwert et al. (2014), subgroup analysis showed a pronounced therapeutic benefit for patients who had not been treated with an EGFR‐targeted antibody in R/M setting, indicating cross‐resistance with afatinib. The lack of an observed overall survival benefit with afatinib compared to methotrexate might result from some characteristics of the study population, particularly the inclusion of HPV‐positive patients and those who received previous EGFR‐targeted treatment. The inclusion of these unselected patients might have diluted the treatment effect of afatinib (Machiels et al., 2015). Indeed, further subgroup analysis of the LUX‐Head and Neck 1 trial identified biomarkers (HPV‐negative, EGFR‐amplified, low HER3 expression, and high PTEN expression) that could predict clinical outcomes with afatinib versus methotrexate in R/M HNSCC. This finding emphasizes the importance of well‐defined biomarkers for optimal patient selection.
Interestingly, afatinib demonstrated higher cytotoxic activity under hypoxia in cetuximab‐sensitive, intrinsically cetuximab‐resistant, and acquired cetuximab‐resistant HNSCC cell lines. This is an important finding, as oxygen deficiency is a common characteristic of HNSCC and these hypoxic tumor regions often contain viable cells that are more resistant to conventional chemotherapy and/or radiotherapy (Wouters et al., 2007). It has already been speculated that hypoxia enhances the sensitivity to the cytotoxic effect of EGFR‐targeted mAb and TKIs, given the link between HIF and EGFR signaling (Boeckx et al., 2015b; Pore et al., 2006; Riesterer et al., 2011). For instance, cetuximab and gefitinib are able to overcome hypoxia‐induced drug resistance by downregulation of HIF‐1alpha through inhibition of the EGFR–Akt pathway (Li and Fan, 2010; Li et al., 2008b; Luwor et al., 2005; Rho et al., 2009). Hence, treatment with afatinib can similarly lead to HIF‐1alpha downregulation. Increased expression of EGFR and/or HER2 under hypoxic conditions may also explain afatinib's increased cytotoxic effect under hypoxia, as afatinib irreversibly inhibits both receptors.
Concerning the mechanism of action by with afatinib exerts its effect, we observed that treatment with afatinib under both normal and reduced oxygen levels established a G0/G1 cell cycle arrest and induction of apoptotic cell death in the majority of cetuximab‐sensitive, intrinsically cetuximab‐resistant, and acquired cetuximab‐resistant HNSCC cell lines, which is in accordance with previous findings in HNSCC (Iida et al., 2016; Liu et al., 2016; Macha et al., 2017). However, induction of G0/G1 cell cycle arrest and induction of apoptotic cell death were not associated with each other in all cell lines under investigation. As activation of the EGFR signal transduction pathway can result in stimulation of both proliferation and anti‐apoptotic signaling (Wee and Wang, 2017), blockade of EGFR as well as other HER family members through afatinib can prevent subsequent activation of these signaling pathway. Consequently, afatinib can affect the cell cycle, programmed cell death, or both cellular processes simultaneously.
Importantly, in the current study, we also included HPV status of our HNSCC cell line panel as an important variable. Despite the impressive progress regarding comprehension of the etiology, epidemiology, and prognostic impact of HPV, the extent to which HPV status may be predictive of response to therapeutic regimens used in the treatment of HNSCC remains incompletely understood (Vermorken, 2017).
Previous research demonstrated that the expression of EGFR was significantly increased in HPV‐negative HNSCC tumors, whereas the expression of HER2 and HER3 was significantly elevated in HPV‐positive HNSCC, suggesting that agents targeting multiple HER receptors might be more effective in HPV‐positive HNSCC (Mazibrada et al., 2014; Pollock et al., 2015). These findings were supported by data available from the Cancer Genome Atlas Network and Chicago Genomics Cohort, demonstrating that HPV‐negative tumors show high EGFR levels and EGFR amplification, whereas HPV‐positive tumors show generally low EGFR expression and high HER2 and HER3 expression (Pollock et al., 2015; Szturz et al., 2017). In contrast, we did not find significant differences in EGFR, HER2, and HER3 expression between the HPV‐positive and HPV‐negative HNSCC cell lines included in our extensive panel of HNSCC cell lines. Hence, HPV did not induce overexpression of HER2 and HER3 in our HPV‐positive HNSCC cell lines. Yet, it is important to keep in mind that the use of only two HPV‐positive cell lines limits our interpretations. Nevertheless, in our as well as Pollock's study (Pollock et al., 2015), afatinib established a clear cytotoxic effect after drug exposure in HPV‐positive HNSCC cell lines, which might indicate its potential for the treatment of HPV‐positive patients with HNSCC.
A phase Ib trial recently demonstrated that afatinib, ribavirin, and weekly paclitaxel and carboplatin as induction chemotherapy is safe and well tolerated in patients with locally advanced HPV‐associated oropharyngeal HNSCC (Dunn et al., 2017). In contrast, clinical data of the LUX‐Head and Neck 1 trial do not support these preclinical observations and demonstrated that patients with HPV‐positive tumors had less benefit from treatment with afatinib (Machiels et al., 2015, 2016). They reported that subgroups of patients with HNSCC, who may achieve increased benefit from afatinib, were identified based on prespecified tumor biomarkers (i.e., HPV‐negative, EGFR amplification, low HER3 expression, and high PTEN expression (Cohen et al., 2017). Consequently, further preclinical and clinical research is needed to draw final conclusions upon the possible predictive role of HPV status for the treatment with EGFR‐targeted therapies.
At the moment, most cancer treatments are combinations of chemotherapeutic agents and/or radiotherapy, and it is expected that new EGFR‐targeted agents will achieve their greatest efficacy in combination with traditional cytotoxic agents and/or radiotherapy. Indeed, previous research demonstrated that afatinib radiosensitizes HNSCC cells by targeting cancer stem cells (Macha et al., 2017). Furthermore, concurrent treatment of afatinib with gemcitabine demonstrated synergistic antitumor effects in nasopharyngeal carcinoma, but also potentially enhanced toxicity in mouse models (Xue et al., 2016). As cetuximab has been approved for the treatment of R/M HNSCC in combination with platinum‐based drugs (Vermorken et al., 2008), we investigated the combination of afatinib with cisplatin. Preclinical research in wild‐type EGFR HNSCC cell lines already demonstrated that cotreatment with afatinib enhances the therapeutic effect of platinum‐based chemotherapy such as cisplatin (Brands et al., 2016). However, it was also reported that simultaneous treatments with afatinib and standard chemotherapy are associated with increased frequency of side effects in HNSCC xenograft studies and clinical trials, so that we found it more relevant to study sequential treatment regimens (Chung et al., 2016; Xue et al., 2016). Unfortunately, in our study, we were not able to demonstrate any synergistic interaction upon sequential treatment of afatinib followed by cisplatin or the inverse sequence, being cisplatin followed by afatinib. In contrast to cetuximab, afatinib seems not the ideal combination partner with platinum‐based drugs for the treatment of HNSCC.
Besides combining afatinib with standard chemotherapy and/or radiotherapy, combinations with other targeted agents such as CDK and Akt inhibitors have shown synergistic effects in HNSCC cell lines (Beck et al., 2016; Silva‐Oliveira et al., 2017). However, combining two EGFR inhibitors, that is, afatinib with cetuximab, did not reveal any advantage to single‐agent treatment (Quesnelle and Grandis, 2011; Young et al., 2015). Although a randomized phase II of afatinib versus cetuximab in R/M HNSCC suggested a lack of cross‐resistance between afatinib and cetuximab (Seiwert et al., 2014), biomarker analysis of the LUX‐Head and Neck 1 trial suggested that afatinib is more effective in patients whose tumors are cetuximab naïve, indicating the possibility of cross‐resistance (Cohen et al., 2017).
Of particular interest and complexity are regimens combining immunotherapy with EGFR‐targeted therapy in HNSCC. The EXTREME study demonstrated that cetuximab could prolong median overall survival when added to platinum/5‐fluorouracil doublet in R/M HNSCC (Vermorken et al., 2008). To date, however, no other EGFR‐blocking agent has demonstrated these results in clinical studies (Szturz and Vermorken, 2017). From this point of view, it appears that cetuximab has additional immune‐based mechanisms of activity through stimulation of antibody‐dependent cytotoxicity and enhancement of cytotoxic T‐lymphocyte cross‐priming by dendritic cells (Kimura et al., 2007; Yang et al., 2013). The PD‐1‐directed immune checkpoint inhibitors, nivolumab (based on phase III data) and pembrolizumab (based on phase II data), are novel therapeutic agents that have gained FDA approval and have become available for second‐line treatment of R/M HNSCC (Chow et al., 2016; Ferris et al., 2016; Seiwert et al., 2016). There are several clinical studies exploring the inhibition of the PD‐1/PD‐L1 axis in combination with or without cetuximab (NCT02764593 and NCT02999087).
As afatinib has no additional immune‐based mechanisms, it seems not the ideal combination partner with immunotherapy. Nevertheless, afatinib is able to overcome cetuximab resistance, as shown in this study. Several clinical studies are currently evaluating single‐agent treatment with afatinib in HNSCC (LUX‐Head and Neck 2, 3, and 4, that is, NCT0134566, NCT01856478, and NCT02131155). Furthermore, afatinib displayed a radiosensitizing effect in preclinical studies (Huguet et al., 2016; Macha et al., 2017). As a result, afatinib is still considered as a promising agent to treat patients with HNSCC. However, optimization of combination treatment regimens with afatinib and conventional as well as other targeted therapies is necessary. Furthermore, identifying predictive biomarkers to select the patients that benefit most from these particular combination strategies is of crucial importance.
5. Conclusion
Our results suggest that afatinib has the potential to overcome intrinsic and acquired cetuximab resistance in both HPV‐positive and HPV‐negative HNSCC tumors, as it was able to establish a cytotoxic effect in HNSCC cell lines with different cetuximab sensitivity and HPV status. However, cross‐resistance between cetuximab and afatinib might be possible. Therefore, further research is required to identify predictive biomarkers to optimize patient selection. Treatment with afatinib causes a G0/G1 cell cycle arrest and induces apoptotic cell death. Sequential combinations of afatinib with cisplatin demonstrated additive to antagonistic effects. In contrast to cetuximab, afatinib seems not to be the ideal combination partner with platinum‐based drugs for the treatment of HNSCC. In this study, neither cetuximab resistance nor HPV status significantly influenced the expression of HER family members in HNSCC cell lines. In contrast, the expression of EGFR, HER2, and HER3 was significantly altered under reduced oxygen conditions. Furthermore, the cytotoxic effect of afatinib was increased under hypoxia. Overall, these data support the hypothesis that afatinib might be a promising therapeutic strategy to treat patients with HNSCC experiencing intrinsic or acquired cetuximab resistance. Nevertheless, further identification of predictive biomarkers is necessary.
Author contributions
IDP participated in the design of the study, carried out the in vitro experiments, performed statistical analysis, and drafted the manuscript. FL obtained funding for the study, participated in the design, and helped to draft the manuscript. JVB assisted in the in vitro experiments, participated in its design, and contributed to draft the manuscript. HB assisted in the in vitro experiments toward his Master thesis in Biomedical Sciences. EF performed statistical analysis. VD and PP participated in the design of the study. MP obtained funding for the study. JBV participated in the design of the study and helped to draft the manuscript. AW conceived of the study, participated in its design and coordination, and assisted to draft the manuscript. All authors read and approved the final manuscript.
Conflict of interest
JBV participated in advisory boards of Boehringer‐Ingelheim. The other authors declare that they have no conflict of interest.
Acknowledgements
This work was performed with the support of the ‘Kom op tegen Kanker’ (Stand up to Cancer), the Flemish Cancer Society. IDP is funded by the University Research Fund (BOF) of the University of Antwerp. The authors would like to thank Hilde Lambrechts and Christophe Hermans for their help on the performed experiments, Jorrit De Waele for his technical advice about the flow cytometry experiments, and Mr. Willy Floren for funding some of the equipment used in this study.
References
- Ang KK, Berkey BA, Tu X, Zhang HZ, Katz R, Hammond EH, Fu KK and Milas L (2002) Impact of epidermal growth factor receptor expression on survival and pattern of relapse in patients with advanced head and neck carcinoma. Can Res 62, 7350–7356. [PubMed] [Google Scholar]
- Beck TN, Georgopoulos R, Shagisultanova EI, Sarcu D, Handorf EA, Dubyk C, Lango MN, Ridge JA, Astsaturov I, Serebriiskii IG et al (2016) EGFR and RB1 as dual biomarkers in HPV‐negative head and neck cancer. Mol Cancer Ther 15, 2486–2497. [DOI] [PMC free article] [PubMed] [Google Scholar]
- Boeckx C, Baay M, Wouters A, Specenier P, Vermorken JB, Peeters M and Lardon F (2013) Anti‐epidermal growth factor receptor therapy in head and neck squamous cell carcinoma: focus on potential molecular mechanisms of drug resistance. Oncologist 18, 850–864. [DOI] [PMC free article] [PubMed] [Google Scholar]
- Boeckx C, Blockx L, de Beeck KO, Limame R, Camp GV, Peeters M, Vermorken JB, Specenier P, Wouters A, Baay M et al (2015a) Establishment and characterization of cetuximab resistant head and neck squamous cell carcinoma cell lines: focus on the contribution of the AP‐1 transcription factor. Am J Cancer Res 5, 1921–1938. [PMC free article] [PubMed] [Google Scholar]
- Boeckx C, Op de Beeck K, Wouters A, Deschoolmeester V, Limame R, Zwaenepoel K, Specenier P, Pauwels P, Vermorken JB, Peeters M et al (2014) Overcoming cetuximab resistance in HNSCC: the role of AURKB and DUSP proteins. Cancer Lett 354, 365–377. [DOI] [PubMed] [Google Scholar]
- Boeckx C, Van den Bossche J, De Pauw I, Peeters M, Lardon F, Baay M and Wouters A (2015b) The hypoxic tumor microenvironment and drug resistance against EGFR inhibitors: preclinical study in cetuximab‐sensitive head and neck squamous cell carcinoma cell lines. BMC Res Notes 8, 203. [DOI] [PMC free article] [PubMed] [Google Scholar]
- Bonner JA, Harari PM, Giralt J, Azarnia N, Shin DM, Cohen RB, Jones CU, Sur R, Raben D, Jassem J et al (2006) Radiotherapy plus cetuximab for squamous‐cell carcinoma of the head and neck. N Engl J Med 354, 567–578. [DOI] [PubMed] [Google Scholar]
- Brands RC, Muller‐Richter UD, De Donno F, Seher A, Mutzbauer G, Linz C, Kubler AC and Hartmann S (2016) Co‐treatment of wild‐type EGFR head and neck cancer cell lines with afatinib and cisplatin. Mol Med Rep 13, 2338–2344. [DOI] [PubMed] [Google Scholar]
- Chow LQ, Haddad R, Gupta S, Mahipal A, Mehra R, Tahara M, Berger R, Eder JP, Burtness B, Lee SH et al (2016) Antitumor activity of pembrolizumab in biomarker‐unselected patients with recurrent and/or metastatic head and neck squamous cell carcinoma: results from the phase Ib KEYNOTE‐012 expansion cohort. J Clin Oncol 34, 3838–3845. [DOI] [PMC free article] [PubMed] [Google Scholar]
- Chung CH, Rudek MA, Kang H, Marur S, John P, Tsottles N, Bonerigo S, Veasey A, Kiess A, Quon H et al (2016) A phase I study afatinib/carboplatin/paclitaxel induction chemotherapy followed by standard chemoradiation in HPV‐negative or high‐risk HPV‐positive locally advanced stage III/IVa/IVb head and neck squamous cell carcinoma. Oral Oncol 53, 54–59. [DOI] [PMC free article] [PubMed] [Google Scholar]
- Cohen EE (2006) Role of epidermal growth factor receptor pathway‐targeted therapy in patients with recurrent and/or metastatic squamous cell carcinoma of the head and neck. J Clin Oncol 24, 2659–2665. [DOI] [PubMed] [Google Scholar]
- Cohen RB (2014) Current challenges and clinical investigations of epidermal growth factor receptor (EGFR)‐ and ErbB family‐targeted agents in the treatment of head and neck squamous cell carcinoma (HNSCC). Cancer Treat Rev 40, 567–577. [DOI] [PubMed] [Google Scholar]
- Cohen EE, Halpern AB, Kasza K, Kocherginsky M, Williams R and Vokes EE (2009) Factors associated with clinical benefit from epidermal growth factor receptor inhibitors in recurrent and metastatic squamous cell carcinoma of the head and neck. Oral Oncol 45, e155–e160. [DOI] [PMC free article] [PubMed] [Google Scholar]
- Cohen EEW, Licitra LF, Burtness B, Fayette J, Gauler T, Clement PM, Grau JJ, Del Campo JM, Mailliez A, Haddad RI et al (2017) Biomarkers predict enhanced clinical outcomes with afatinib versus methotrexate in patients with second‐line recurrent and/or metastatic head and neck cancer. Ann Oncol 28, 2526–2532. [DOI] [PMC free article] [PubMed] [Google Scholar]
- Dassonville O, Formento JL, Francoual M, Ramaioli A, Santini J, Schneider M, Demard F and Milano G (1993) Expression of epidermal growth factor receptor and survival in upper aerodigestive tract cancer. J Clin Oncol 11, 1873–1878. [DOI] [PubMed] [Google Scholar]
- De Pauw I, Wouters A, Van den Bossche J, Deschoolmeester V, Baysal H, Pauwels P, Peeters M, Vermorken JB and Lardon F (2017) Dual targeting of epidermal growth factor receptor and HER3 by MEHD7945A as monotherapy or in combination with cisplatin partially overcomes cetuximab resistance in head and neck squamous cell carcinoma cell lines. Cancer Biother Radiopharm 32, 229–238. [PubMed] [Google Scholar]
- De Pauw I, Wouters A, Van den Bossche J, Peeters M, Pauwels P, Deschoolmeester V, Vermorken JB and Lardon F (2016) Preclinical and clinical studies on afatinib in monotherapy and in combination regimens: potential impact in colorectal cancer. Pharmacol Ther 166, 71–83. [DOI] [PubMed] [Google Scholar]
- Deben C, Lardon F, Wouters A, Op de Beeck K, Van den Bossche J, Jacobs J, Van Der Steen N, Peeters M, Rolfo C, Deschoolmeester V et al (2016) APR‐246 (PRIMA‐1(MET)) strongly synergizes with AZD2281 (olaparib) induced PARP inhibition to induce apoptosis in non‐small cell lung cancer cell lines. Cancer Lett 375, 313–322. [DOI] [PubMed] [Google Scholar]
- Dunn LA, Fury MG, Sherman EJ, Ho AA, Katabi N, Haque SS and Pfister DG (2017) Phase I study of induction chemotherapy with afatinib, ribavirin, and weekly carboplatin and paclitaxel for stage IVA/IVB human papillomavirus‐associated oropharyngeal squamous cell cancer. Head Neck 40, 233–241. [DOI] [PMC free article] [PubMed] [Google Scholar]
- Erjala K, Sundvall M, Junttila TT, Zhang N, Savisalo M, Mali P, Kulmala J, Pulkkinen J, Grenman R and Elenius K (2006) Signaling via ErbB2 and ErbB3 associates with resistance and epidermal growth factor receptor (EGFR) amplification with sensitivity to EGFR inhibitor gefitinib in head and neck squamous cell carcinoma cells. Clin Cancer Res 12, 4103–4111. [DOI] [PubMed] [Google Scholar]
- Fan Z, Baselga J, Masui H and Mendelsohn J (1993) Antitumor effect of anti‐epidermal growth factor receptor monoclonal antibodies plus cis‐diamminedichloroplatinum on well established A431 cell xenografts. Can Res 53, 4637–4642. [PubMed] [Google Scholar]
- Fayette J, Wirth L, Oprean C, Udrea A, Jimeno A, Rischin D, Nutting C, Harari PM, Csoszi T, Cernea D et al (2016) Randomized phase II study of duligotuzumab (MEHD7945A) vs. cetuximab in squamous cell carcinoma of the head and neck (MEHGAN Study). Front Oncol 6, 232. [DOI] [PMC free article] [PubMed] [Google Scholar]
- Ferris RL, Blumenschein G Jr, Fayette J, Guigay J, Colevas AD, Licitra L, Harrington K, Kasper S, Vokes EE, Even C et al (2016) Nivolumab for recurrent squamous‐cell carcinoma of the head and neck. N Engl J Med 375, 1856–1867. [DOI] [PMC free article] [PubMed] [Google Scholar]
- Ganly I, Talbot S, Carlson D, Viale A, Maghami E, Osman I, Sherman E, Pfister D, Chuai S, Shaha AR et al (2007) Identification of angiogenesis/metastases genes predicting chemoradiotherapy response in patients with laryngopharyngeal carcinoma. J Clin Oncol 25, 1369–1376. [DOI] [PubMed] [Google Scholar]
- Huguet F, Fernet M, Giocanti N, Favaudon V and Larsen AK (2016) Afatinib, an irreversible EGFR family inhibitor, shows activity toward pancreatic cancer cells, alone and in combination with radiotherapy, independent of KRAS status. Target Oncol 11, 371–381. [DOI] [PubMed] [Google Scholar]
- Iida M, Bahrar H, Brand TM, Pearson HE, Coan JP, Orbuch RA, Flanigan BG, Swick AD, Prabakaran PJ, Lantto J et al (2016) Targeting the HER Family with Pan‐HER effectively overcomes resistance to cetuximab. Mol Cancer Ther 15, 2175–2186. [DOI] [PMC free article] [PubMed] [Google Scholar]
- Iida M, Brand TM, Starr MM, Huppert EJ, Luthar N, Bahrar H, Coan JP, Pearson HE, Salgia R and Wheeler DL (2014) Overcoming acquired resistance to cetuximab by dual targeting HER family receptors with antibody‐based therapy. Mol Cancer 13, 242. [DOI] [PMC free article] [PubMed] [Google Scholar]
- Ioannou N, Seddon AM, Dalgleish A, Mackintosh D and Modjtahedi H (2013) Treatment with a combination of the ErbB (HER) family blocker afatinib and the IGF‐IR inhibitor, NVP‐AEW541 induces synergistic growth inhibition of human pancreatic cancer cells. BMC Cancer 13, 41. [DOI] [PMC free article] [PubMed] [Google Scholar]
- Jonsson E, Fridborg H, Nygren P and Larsson R (1998) Synergistic interactions of combinations of topotecan with standard drugs in primary cultures of human tumor cells from patients. Eur J Clin Pharmacol 54, 509–514. [DOI] [PubMed] [Google Scholar]
- Kim BJ, Jeong JH, Kim HS and Kim JH (2017) The role of anti‐EGFR agents in patients with locoregionally advanced head and neck cancer: a meta‐analysis of randomized trials. Oncotarget 8, 102371–102380. [DOI] [PMC free article] [PubMed] [Google Scholar]
- Kimura H, Sakai K, Arao T, Shimoyama T, Tamura T and Nishio K (2007) Antibody‐dependent cellular cytotoxicity of cetuximab against tumor cells with wild‐type or mutant epidermal growth factor receptor. Cancer Sci 98, 1275–1280. [DOI] [PMC free article] [PubMed] [Google Scholar]
- Krause M, Ostermann G, Petersen C, Yaromina A, Hessel F, Harstrick A, van der Kogel AJ, Thames HD and Baumann M (2005) Decreased repopulation as well as increased reoxygenation contribute to the improvement in local control after targeting of the EGFR by C225 during fractionated irradiation. Radiother Oncol 76, 162–167. [DOI] [PubMed] [Google Scholar]
- Laderoute KR, Grant TD, Murphy BJ and Sutherland RM (1992) Enhanced epidermal growth factor receptor synthesis in human squamous carcinoma cells exposed to low levels of oxygen. Int J Cancer 52, 428–432. [DOI] [PubMed] [Google Scholar]
- Li D, Ambrogio L, Shimamura T, Kubo S, Takahashi M, Chirieac LR, Padera RF, Shapiro GI, Baum A, Himmelsbach F et al (2008a) BIBW2992, an irreversible EGFR/HER2 inhibitor highly effective in preclinical lung cancer models. Oncogene 27, 4702–4711. [DOI] [PMC free article] [PubMed] [Google Scholar]
- Li X and Fan Z (2010) The epidermal growth factor receptor antibody cetuximab induces autophagy in cancer cells by downregulating HIF‐1alpha and Bcl‐2 and activating the beclin 1/hVps34 complex. Can Res 70, 5942–5952. [DOI] [PMC free article] [PubMed] [Google Scholar]
- Li X, Lu Y, Liang K, Pan T, Mendelsohn J and Fan Z (2008b) Requirement of hypoxia‐inducible factor‐1alpha down‐regulation in mediating the antitumor activity of the anti‐epidermal growth factor receptor monoclonal antibody cetuximab. Mol Cancer Ther 7, 1207–1217. [DOI] [PubMed] [Google Scholar]
- Liang K, Ang KK, Milas L, Hunter N and Fan Z (2003) The epidermal growth factor receptor mediates radioresistance. Int J Radiat Oncol Biol Phys 57, 246–254. [DOI] [PubMed] [Google Scholar]
- Licitra L, Mesia R, Rivera F, Remenar E, Hitt R, Erfan J, Rottey S, Kawecki A, Zabolotnyy D, Benasso M et al (2011) Evaluation of EGFR gene copy number as a predictive biomarker for the efficacy of cetuximab in combination with chemotherapy in the first‐line treatment of recurrent and/or metastatic squamous cell carcinoma of the head and neck: EXTREME study. Ann Oncol 22, 1078–1087. [DOI] [PMC free article] [PubMed] [Google Scholar]
- Licitra L, Storkel S, Kerr KM, Van Cutsem E, Pirker R, Hirsch FR, Vermorken JB, von Heydebreck A, Esser R, Celik I et al (2013) Predictive value of epidermal growth factor receptor expression for first‐line chemotherapy plus cetuximab in patients with head and neck and colorectal cancer: analysis of data from the EXTREME and CRYSTAL studies. Eur J Cancer, 49, 1161–1168. [DOI] [PubMed] [Google Scholar]
- Limame R, Wouters A, Pauwels B, Fransen E, Peeters M, Lardon F, De Wever O and Pauwels P (2012) Comparative analysis of dynamic cell viability, migration and invasion assessments by novel real‐time technology and classic endpoint assays. PLoS One 7, e46536. [DOI] [PMC free article] [PubMed] [Google Scholar]
- Liu H, Li J, Diao M, Cai Z, Yang J and Zeng Y (2013) Statistical analysis of human papillomavirus in a subset of upper aerodigestive tract tumors. J Med Virol 85, 1775–1785. [DOI] [PubMed] [Google Scholar]
- Liu X, Lv Z, Zou J, Liu X, Ma J, Wang J, Sa N, Jing P and Xu W (2016) Afatinib down‐regulates MCL‐1 expression through the PERK‐eIF2alpha‐ATF4 axis and leads to apoptosis in head and neck squamous cell carcinoma. Am J Cancer Res 6, 1708–1719. [PMC free article] [PubMed] [Google Scholar]
- Luwor RB, Lu Y, Li X, Mendelsohn J and Fan Z (2005) The antiepidermal growth factor receptor monoclonal antibody cetuximab/C225 reduces hypoxia‐inducible factor‐1 alpha, leading to transcriptional inhibition of vascular endothelial growth factor expression. Oncogene 24, 4433–4441. [DOI] [PubMed] [Google Scholar]
- Macha MA, Rachagani S, Qazi AK, Jahan R, Gupta S, Patel A, Seshacharyulu P, Lin C, Li S, Wang S et al (2017) Afatinib radiosensitizes head and neck squamous cell carcinoma cells by targeting cancer stem cells. Oncotarget 8, 20961–20973. [DOI] [PMC free article] [PubMed] [Google Scholar]
- Machiels JP, Galot R and Schmitz S (2016) HER2 and HER3 in HPV+ and HPV‐ HNSCC–letter. Clin Cancer Res 22, 1825. [DOI] [PubMed] [Google Scholar]
- Machiels JP, Haddad RI, Fayette J, Licitra LF, Tahara M, Vermorken JB, Clement PM, Gauler T, Cupissol D, Grau JJ et al (2015) Afatinib versus methotrexate as second‐line treatment in patients with recurrent or metastatic squamous‐cell carcinoma of the head and neck progressing on or after platinum‐based therapy (LUX‐Head & Neck 1): an open‐label, randomised phase 3 trial. Lancet Oncol 16, 583–594. [DOI] [PubMed] [Google Scholar]
- Mahipal A, Kothari N and Gupta S (2014) Epidermal growth factor receptor inhibitors: coming of age. Cancer Control 21, 74–79. [DOI] [PubMed] [Google Scholar]
- Marur S, D'Souza G, Westra WH and Forastiere AA (2010) HPV‐associated head and neck cancer: a virus‐related cancer epidemic. Lancet Oncol 11, 781–789. [DOI] [PMC free article] [PubMed] [Google Scholar]
- Mazibrada J, Longo L, Vatrano S, Cappia S, Giorcelli J, Pentenero M, Gandolfo S, Volante M, dell'Oste V, Lo Cigno I et al (2014) Differential expression of HER2, STAT3, SOX2, IFI16 and cell cycle markers during HPV‐related head and neck carcinogenesis. New Microbiol 37, 129–143. [PubMed] [Google Scholar]
- Mehanna H, Beech T, Nicholson T, El‐Hariry I, McConkey C, Paleri V and Roberts S (2013) Prevalence of human papillomavirus in oropharyngeal and nonoropharyngeal head and neck cancer–systematic review and meta‐analysis of trends by time and region. Head Neck 35, 747–755. [DOI] [PubMed] [Google Scholar]
- Minkovsky N and Berezov A (2008) BIBW‐2992, a dual receptor tyrosine kinase inhibitor for the treatment of solid tumors. Curr Opin Investig Drugs, 9, 1336–1346. [PubMed] [Google Scholar]
- Nagel R, Martens‐de Kemp SR, Buijze M, Jacobs G, Braakhuis BJ and Brakenhoff RH (2013) Treatment response of HPV‐positive and HPV‐negative head and neck squamous cell carcinoma cell lines. Oral Oncol 49, 560–566. [DOI] [PubMed] [Google Scholar]
- Pauwels B, Korst AE, de Pooter CM, Pattyn GG, Lambrechts HA, Baay MF, Lardon F and Vermorken JB (2003) Comparison of the sulforhodamine B assay and the clonogenic assay for in vitro chemoradiation studies. Cancer Chemother Pharmacol 51, 221–226. [DOI] [PubMed] [Google Scholar]
- Pogorzelski M, Ting S, Gauler TC, Breitenbuecher F, Vossebein I, Hoffarth S, Markowetz J, Lang S, Bergmann C, Brandau S et al (2014) Impact of human papilloma virus infection on the response of head and neck cancers to anti‐epidermal growth factor receptor antibody therapy. Cell Death Dis 5, e1091. [DOI] [PMC free article] [PubMed] [Google Scholar]
- Pollock NI, Wang L, Wallweber G, Gooding WE, Huang W, Chenna A, Winslow J, Sen M, DeGrave KA, Li H et al (2015) Increased expression of HER2, HER3, and HER2:HER3 heterodimers in HPV‐positive HNSCC using a novel proximity‐based assay: implications for targeted therapies. Clin Cancer Res 21, 4597–4606. [DOI] [PMC free article] [PubMed] [Google Scholar]
- Pore N, Jiang Z, Gupta A, Cerniglia G, Kao GD and Maity A (2006) EGFR tyrosine kinase inhibitors decrease VEGF expression by both hypoxia‐inducible factor (HIF)‐1‐independent and HIF‐1‐dependent mechanisms. Can Res 66, 3197–3204. [DOI] [PubMed] [Google Scholar]
- Quesnelle KM and Grandis JR (2011) Dual kinase inhibition of EGFR and HER2 overcomes resistance to cetuximab in a novel in vivo model of acquired cetuximab resistance. Clin Cancer Res 17, 5935–5944. [DOI] [PMC free article] [PubMed] [Google Scholar]
- Rho JK, Choi YJ, Lee JK, Ryoo BY, Na II, Yang SH, Kim CH, Yoo YD and Lee JC (2009) Gefitinib circumvents hypoxia‐induced drug resistance by the modulation of HIF‐1alpha. Oncol Rep 21, 801–807. [PubMed] [Google Scholar]
- Riesterer O, Yang Q, Raju U, Torres M, Molkentine D, Patel N, Valdecanas D, Milas L and Ang KK (2011) Combination of anti‐IGF‐1R antibody A12 and ionizing radiation in upper respiratory tract cancers. Int J Radiat Oncol Biol Phys 79, 1179–1187. [DOI] [PMC free article] [PubMed] [Google Scholar]
- Rubin Grandis J, Melhem MF, Barnes EL and Tweardy DJ (1996) Quantitative immunohistochemical analysis of transforming growth factor‐alpha and epidermal growth factor receptor in patients with squamous cell carcinoma of the head and neck. Cancer 78, 1284–1292. [DOI] [PubMed] [Google Scholar]
- Rubin Grandis J, Melhem MF, Gooding WE, Day R, Holst VA, Wagener MM, Drenning SD and Tweardy DJ (1998) Levels of TGF‐alpha and EGFR protein in head and neck squamous cell carcinoma and patient survival. J Natl Cancer Inst 90, 824–832. [DOI] [PubMed] [Google Scholar]
- Santini J, Formento JL, Francoual M, Milano G, Schneider M, Dassonville O and Demard F (1991) Characterization, quantification, and potential clinical value of the epidermal growth factor receptor in head and neck squamous cell carcinomas. Head Neck 13, 132–139. [DOI] [PubMed] [Google Scholar]
- Seiwert TY, Burtness B, Mehra R, Weiss J, Berger R, Eder JP, Heath K, McClanahan T, Lunceford J, Gause C et al (2016) Safety and clinical activity of pembrolizumab for treatment of recurrent or metastatic squamous cell carcinoma of the head and neck (KEYNOTE‐012): an open‐label, multicentre, phase 1b trial. Lancet Oncol 17, 956–965. [DOI] [PubMed] [Google Scholar]
- Seiwert TY, Fayette J, Cupissol D, Del Campo JM, Clement PM, Hitt R, Degardin M, Zhang W, Blackman A, Ehrnrooth E et al (2014) A randomized, phase II study of afatinib versus cetuximab in metastatic or recurrent squamous cell carcinoma of the head and neck. Ann Oncol 25, 1813–1820. [DOI] [PMC free article] [PubMed] [Google Scholar]
- Seiwert TY, Zuo Z, Keck MK, Khattri A, Pedamallu CS, Stricker T, Brown C, Pugh TJ, Stojanov P, Cho J et al (2015) Integrative and comparative genomic analysis of HPV‐positive and HPV‐negative head and neck squamous cell carcinomas. Clin Cancer Res 21, 632–641. [DOI] [PMC free article] [PubMed] [Google Scholar]
- Shepard HM, Brdlik CM and Schreiber H (2008) Signal integration: a framework for understanding the efficacy of therapeutics targeting the human EGFR family. J Clin Investig 118, 3574–3581. [DOI] [PMC free article] [PubMed] [Google Scholar]
- Silva‐Oliveira RJ, Melendez M, Martinho O, Zanon MF, de Souza Viana L, Carvalho AL and Reis RM (2017) AKT can modulate the in vitro response of HNSCC cells to irreversible EGFR inhibitors. Oncotarget 8, 53288–53301. [DOI] [PMC free article] [PubMed] [Google Scholar]
- Skvortsova I, Skvortsov S, Raju U, Stasyk T, Riesterer O, Schottdorf EM, Popper BA, Schiestl B, Eichberger P, Debbage P et al (2010) Epithelial‐to‐mesenchymal transition and c‐myc expression are the determinants of cetuximab‐induced enhancement of squamous cell carcinoma radioresponse. Radiother Oncol 96, 108–115. [DOI] [PubMed] [Google Scholar]
- Solca F, Dahl G, Zoephel A, Bader G, Sanderson M, Klein C, Kraemer O, Himmelsbach F, Haaksma E and Adolf GR (2012) Target binding properties and cellular activity of afatinib (BIBW 2992), an irreversible ErbB family blocker. J Pharmacol Exp Ther 343, 342–350. [DOI] [PubMed] [Google Scholar]
- Swinson DE and O'Byrne KJ (2006) Interactions between hypoxia and epidermal growth factor receptor in non‐small‐cell lung cancer. Clin Lung Cancer 7, 250–256. [DOI] [PubMed] [Google Scholar]
- Szturz P, Seiwert TY and Vermorken JB (2017) How standard is second‐line cetuximab in recurrent or metastatic head and neck cancer in 2017? J Clin Oncol 35, 2229–2231. [DOI] [PubMed] [Google Scholar]
- Szturz P and Vermorken JB (2017) Immunotherapy in head and neck cancer: aiming at EXTREME precision. BMC Med 15, 110. [DOI] [PMC free article] [PubMed] [Google Scholar]
- Takikita M, Xie R, Chung JY, Cho H, Ylaya K, Hong SM, Moskaluk CA and Hewitt SM (2011) Membranous expression of Her3 is associated with a decreased survival in head and neck squamous cell carcinoma. J Transl Med 9, 126. [DOI] [PMC free article] [PubMed] [Google Scholar]
- Valeriote F and Lin H (1975) Synergistic interaction of anticancer agents: a cellular perspective. Cancer Chemother Rep 59, 895–900. [PubMed] [Google Scholar]
- Vermorken JB (2017) Human papillomavirus (HPV): a criterion for therapeutic decision in squamous cell carcinoma of the head and neck?. Recent Results Cancer Res 206, 137–147. [DOI] [PubMed] [Google Scholar]
- Vermorken JB, Mesia R, Rivera F, Remenar E, Kawecki A, Rottey S, Erfan J, Zabolotnyy D, Kienzer HR, Cupissol D et al (2008) Platinum‐based chemotherapy plus cetuximab in head and neck cancer. N Engl J Med 359, 1116–1127. [DOI] [PubMed] [Google Scholar]
- Wang X and Schneider A (2010) HIF‐2alpha‐mediated activation of the epidermal growth factor receptor potentiates head and neck cancer cell migration in response to hypoxia. Carcinogenesis 31, 1202–1210. [DOI] [PMC free article] [PubMed] [Google Scholar]
- Wee P and Wang Z (2017) Epidermal growth factor receptor cell proliferation signaling pathways. Cancers 9, 52. [DOI] [PMC free article] [PubMed] [Google Scholar]
- Wheeler DL, Huang S, Kruser TJ, Nechrebecki MM, Armstrong EA, Benavente S, Gondi V, Hsu KT and Harari PM (2008) Mechanisms of acquired resistance to cetuximab: role of HER (ErbB) family members. Oncogene 27, 3944–3956. [DOI] [PMC free article] [PubMed] [Google Scholar]
- Wouters A, Boeckx C, Vermorken JB, Van den Weyngaert D, Peeters M and Lardon F (2013) The intriguing interplay between therapies targeting the epidermal growth factor receptor, the hypoxic microenvironment and hypoxia‐inducible factors. Curr Pharm Des 19, 907–917. [PubMed] [Google Scholar]
- Wouters A, Pauwels B, Lambrechts HA, Pattyn GG, Ides J, Baay M, Meijnders P, Dewilde S, Vermorken JB and Lardon F (2009) Chemoradiation interactions under reduced oxygen conditions: cellular characteristics of an in vitro model. Cancer Lett 286, 180–188. [DOI] [PubMed] [Google Scholar]
- Wouters A, Pauwels B, Lardon F and Vermorken JB (2007) Review: implications of in vitro research on the effect of radiotherapy and chemotherapy under hypoxic conditions. Oncologist 12, 690–712. [DOI] [PubMed] [Google Scholar]
- Xue C, Tian Y, Zhang J, Zhao Y, Zhan J, Fang W and Zhang L (2016) In vitro and in vivo efficacy of afatinib as a single agent or in combination with gemcitabine for the treatment of nasopharyngeal carcinoma. Drug Des Devel Ther 10, 1299–1306. [DOI] [PMC free article] [PubMed] [Google Scholar]
- Yang X, Zhang X, Mortenson ED, Radkevich‐Brown O, Wang Y and Fu YX (2013) Cetuximab‐mediated tumor regression depends on innate and adaptive immune responses. Mol Ther 21, 91–100. [DOI] [PMC free article] [PubMed] [Google Scholar]
- Yonesaka K, Zejnullahu K, Okamoto I, Satoh T, Cappuzzo F, Souglakos J, Ercan D, Rogers A, Roncalli M, Takeda M et al (2011) Activation of ERBB2 signaling causes resistance to the EGFR‐directed therapeutic antibody cetuximab. Sci Transl Med 3, 99ra86. [DOI] [PMC free article] [PubMed] [Google Scholar]
- Young NR, Soneru C, Liu J, Grushko TA, Hardeman A, Olopade OI, Baum A, Solca F and Cohen EE (2015) Afatinib efficacy against squamous cell carcinoma of the head and neck cell lines in vitro and in vivo. Target Oncol 10, 501–508. [DOI] [PMC free article] [PubMed] [Google Scholar]
- Zhang H, Berezov A, Wang Q, Zhang G, Drebin J, Murali R and Greene MI (2007) ErbB receptors: from oncogenes to targeted cancer therapies. J Clin Investig 117, 2051–2058. [DOI] [PMC free article] [PubMed] [Google Scholar]