Abstract
YAP/TAZ, downstream transducers of the Hippo pathway, are powerful regulators of cancer growth. How these factors control proliferation remains poorly defined. Here, we found that YAP/TAZ directly regulate expression of key enzymes involved in deoxynucleotide biosynthesis and maintain dNTP precursor pools in human cancer cells. Regulation of deoxynucleotide metabolism is required for YAP‐induced cell growth and underlies the resistance of YAP‐addicted cells to chemotherapeutics targeting dNTP synthesis. During RAS‐induced senescence, YAP/TAZ bypass RAS‐mediated inhibition of nucleotide metabolism and control senescence. Endogenous YAP/TAZ targets and signatures are inhibited by RAS/MEK1 during senescence, and depletion of YAP/TAZ is sufficient to cause senescence‐associated phenotypes, suggesting a role for YAP/TAZ in suppression of senescence. Finally, mechanical cues, such as ECM stiffness and cell geometry, regulate senescence in a YAP‐dependent manner. This study indicates that YAP/TAZ couples cell proliferation with a metabolism suited for DNA replication and facilitates escape from oncogene‐induced senescence. We speculate that this activity might be relevant during the initial phases of tumour progression or during experimental stem cell reprogramming induced by YAP.
Keywords: mechanotransduction, nucleotide metabolism, oncogene‐induced senescence, YAP/TAZ
Subject Categories: Cancer, Metabolism
Introduction
YAP (yes‐associated protein 1) and TAZ (transcriptional coactivator with PDZ‐binding motif, also known as WWTR1) are sibling transcriptional coactivators that shuttle between the cytoplasm and the nucleus where they regulate gene transcription by interacting with TEAD transcription factors (Piccolo et al, 2014). YAP and TAZ have been identified as the downstream transducers of the Hippo pathway, key regulator of tissue proliferation and organ size across animals (Halder & Johnson, 2011). More recently, several reports unveiled multiple regulatory inputs that can influence YAP and TAZ activity, including cell geometry and the mechanical properties of the extracellular matrix, RHO activity, cell–cell junctions, growth‐factor signalling and metabolic pathways (Piccolo et al, 2014; Santinon et al, 2015; Dupont, 2016). This led to the notion that YAP and TAZ integrate different cellular and extracellular cues into a coherent biological response.
One key biological effect of YAP and TAZ is the regulation of cell proliferation, and this is associated with the ability of YAP and TAZ to promote self‐renewal of stem cells (Camargo et al, 2007; Cordenonsi et al, 2011; Panciera et al, 2016). In vivo, this activity appears dispensable in homeostatic conditions of adult tissues, but is fundamental for embryonic tissue proliferation, when tissues need to regenerate after damage, or when cells undergo neoplastic transformation (Azzolin et al, 2014; Zanconato et al, 2015; Moya & Halder, 2016). This makes YAP and TAZ ideal tumour‐specific targets to develop new approaches to disable cancer cell growth and tumour‐seeding ability. In this light, understanding what are the genetic programmes activated by YAP and TAZ might provide important information for treatment and new molecular targets to harm YAP‐addicted tumour cells (Zanconato et al, 2016).
In this study, we found that YAP and TAZ control the transcription of a set of enzymes involved in deoxynucleotide biosynthesis, such that YAP and TAZ activity impacts dNTP metabolism and the availability of dNTP precursors for DNA replication. Regulation of nucleotide metabolism is required for YAP‐induced breast cancer cell growth and underlies the resistance of YAP‐addicted breast cancer cells to chemotherapeutics targeting dNTP synthesis. Moreover, prompted by the notion that dNTP regulation is a crucial step regulating Ras‐induced senescence (Aird et al, 2013; Mannava et al, 2013), we found that YAP is sufficient to overcome Ras‐induced inhibition of nucleotide metabolism and senescence and that endogenous YAP/TAZ activity is inhibited by Ras during the early phase of oncogene‐induced senescence. As such, depletion of YAP/TAZ or their inhibition by upstream inputs, including mechanical cues, induces senescence‐associated phenotypes in primary cells.
Results
YAP and TAZ regulate deoxynucleotide metabolism in cancer cells
To gain insights into how YAP and TAZ regulate cell proliferation, we performed gene list enrichment analysis on genes regulated by YAP/TAZ in MDA‐MB‐231 cells (Enzo et al, 2015). Many pathways linked to cell‐cycle regulation were significantly enriched among the genes downregulated in cells depleted of YAP and TAZ, including genes involved in G1/S and G2/M transition, DNA repair and DNA replication, in line with recent findings (Zanconato et al, 2015; Jang et al, 2017). Interestingly, we also found a very significant enrichment in several key and rate‐limiting enzymes involved in deoxynucleotide (dNTP) synthesis, including ribonucleotide reductase (RNR) subunits RRM1 and RRM2, thymidylate synthetase (TYMS), deoxythymidylate kinase (DTYMK) and thymidine kinase (TK1) (Fig EV1A and B), that are key to ensure progression of cells through the S‐phase.
Figure EV1. YAP/TAZ regulate the expression of key genes involved in dNTP metabolism.
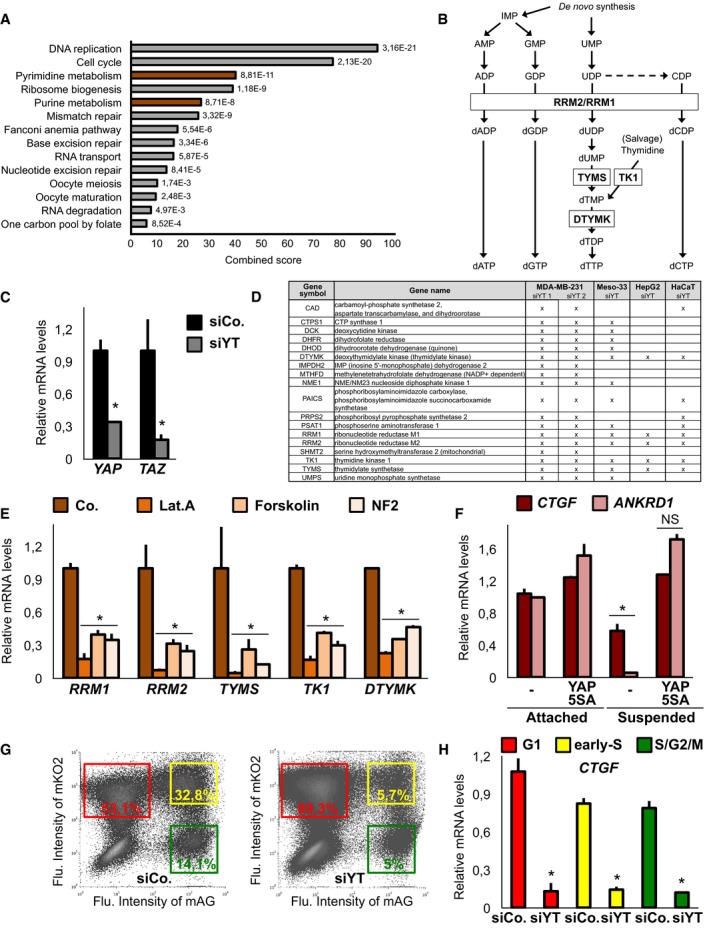
- Gene list enrichment analysis indicates nucleotide metabolism as a significant genetic programme regulated in MDA‐MB‐231 breast cancer cells upon depletion of YAP/TAZ (see Materials and Methods for details).
- Simplified scheme of the deoxynucleotide biosynthetic pathways involving the enzymes that we found regulated by YAP/TAZ. The ribonucleotide reductase (RNR) enzyme, constituted by RRM1 and RRM2 subunits, is the rate‐limiting enzyme in the de novo synthesis and promotes the conversion of nucleotides (ADP, GDP, CDP, and UDP) in the corresponding deoxynucleotides. Thymidylate synthase (TYMS, also known as TS) is the unique enzyme for the de novo synthesis of dTMP; deoxythymidylate kinase (DTYMK) phosphorylates dTMP to generate dTDP. dTMP can be generated also through the salvage pathway, in which deoxynucleoside kinase (TK1) reutilizes thymidine derived from nucleic acid degradation. Other enzymes and reactions were not included for simplicity.
- qPCR for endogenous YAP and TAZ expression levels in MDA‐MB‐231 cells 48 h after siRNA transfection. n = 4.
- Genes related to dNTP metabolism downregulated upon knockdown of YAP/TAZ in published microarray analyses (see Materials and Methods). X indicates significant downregulation compared to control cells (P‐value < 0.05).
- qPCR on MDA‐MB‐231 cells treated with latrunculin A (Lat.A, 340 nM) or forskolin (10 μM) for 24 h, or transfected with a NF2/merlin‐expressing plasmid for 48 h, established treatments leading to YAP/TAZ inhibition. n = 4.
- MDA‐MB‐231 cells were treated as in Fig 1B and examined for established YAP/TAZ target genes. n = 4.
- Representative flow cytometry scatter plots of MDA‐MB‐231 cells expressing Fucci indicators and transfected with the indicated siRNA for 48 h. Red NOT Green: G1 phase; Red AND Green: early S; Green NOT Red: S/G2/M. Coloured squares indicate the gates used for the analysis in Fig 1C. Percentage shows the relative size of the sorted populations.
- MDA‐MB‐231 cells transfected and analysed as in Fig 1C and examined for gene expression of an established direct YAP/TAZ target gene. n = 4.
We validated this observation by qPCR (Figs 1A and EV1C) and surveyed published microarrays, which indicated a coherent and general regulation of dNTP metabolic enzymes by YAP/TAZ in multiple cancer cell lines (Li et al, 2014; Mori et al, 2014), in MST1/2 knockout mice (Fitamant et al, 2015) and in livers overexpressing YAP (Yimlamai et al, 2014; Fig EV1D). In line with these data, inhibition of YAP/TAZ activity by established upstream inputs (Hamaratoglu et al, 2006; Dupont et al, 2011; Kim et al, 2013) led to a coherent inhibition of these metabolic enzymes (Fig EV1E). Moreover, sustaining YAP activity in conditions where endogenous YAP/TAZ are inhibited, such as growth in the absence of cell–substrate adhesions (Zhao et al, 2012), induced expression of these genes (Figs 1B and EV1F).
Figure 1. YAP/TAZ regulate the expression of key genes involved in dNTP metabolism in breast cancer cells.
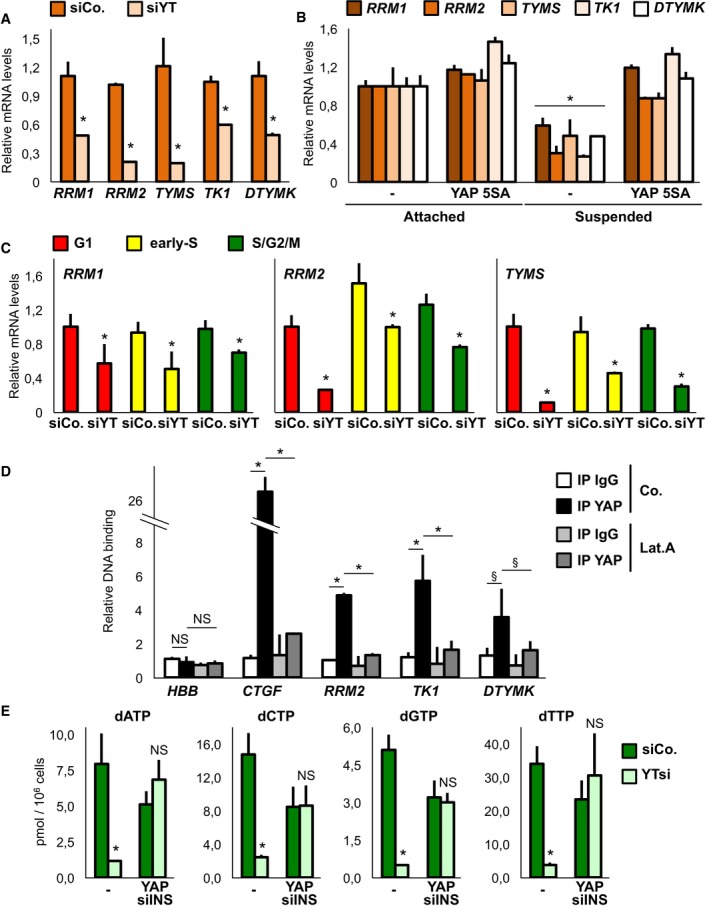
- qPCR for nucleotide metabolism genes on MDA‐MB‐231 transfected with control siRNA (siCo.) or YAP/TAZ siRNA (siYT). Here and throughout the figures, qPCR data are relative to GAPDH levels; mean expression levels in control cells were set to 1, and all other samples are expressed relative to this. n = 6.
- MDA‐MB‐231 cells infected with control vector (−) or with YAP 5SA were seeded either on tissue‐culture plastic (attached) or on top of agarose (suspended). P‐value relative to control attached cells. n = 4.
- qPCR on selected dNTP genes in the different phases of the cell cycle, as obtained by sorting MDA‐MB‐231 cells expressing Fucci cell cycle indicators. Red NOT Green: G1 phase; Red AND Green: early S; Green NOT Red: S/G2/M. n = 4.
- Chromatin immunoprecipitation from MDA‐MB‐231 cells treated with vehicle or with latrunculin A (Lat.A, 650 nM), leading to YAP/TAZ inhibition, for 6 h. Amplification of Haemoglobin beta (HBB) serves as negative control; for each promoter, values are relative to IgG IP, arbitrarily set to 1. § P < 0.08 (two tailed Student's t‐test). n = 4.
- Steady‐state dNTP pools measured in MDA‐MB‐231 cells transfected with the indicated siRNAs and expressing siRNA‐insensitive YAP as indicated. n = 4.
We next asked whether regulation of dNTP metabolism genes by YAP/TAZ was secondary to regulation of the cell cycle. For this, we sorted MDA‐MB‐231 cells in the different phases of the cell cycle based on the FUCCI cell‐cycle indicators (Sakaue‐Sawano et al, 2008): as shown in Figs 1C, and EV1G and H, knockdown of YAP/TAZ regulates dNTP genes independently of the cell cycle, suggesting a direct transcriptional event. We thus queried recent genomewide chromatin immunoprecipitation experiments (Zanconato et al, 2015) and found evidence for a TEAD‐dependent enhancer in at least three of these genes, which we then validated (Fig 1D). Importantly, YAP/TAZ not only regulate dNTP metabolism gene expression, but are quantitatively required to sustain the synthesis of all four dNTP (Fig 1E). Collectively, this indicates that YAP/TAZ directly regulate deoxynucleotide metabolism.
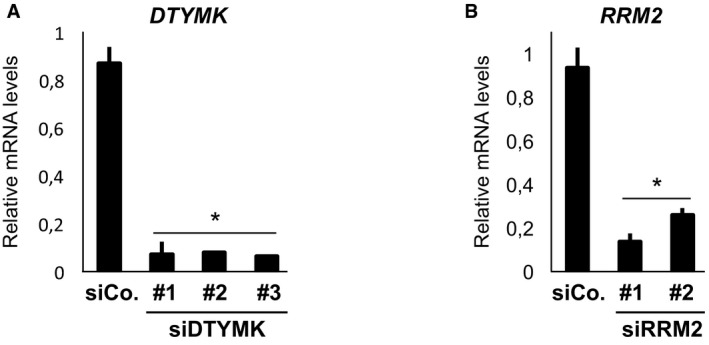
Regulation of nucleotide metabolism genes is relevant for the ability of Myc and mutant‐p53 oncogenes to promote cell proliferation (Hsieh et al, 2015; Kollareddy et al, 2015). We promoted cell growth in soft agar by stable expression of activated YAP 5SA and challenged this by RNA interference for selected dNTP metabolism enzymes regulated by YAP/TAZ. As shown in Figs 2A and B, and EV2A and B, RRM2 and DTYMK are required for YAP‐induced cancer cell growth. Similar results were obtained when endogenous YAP/TAZ activity and proliferation were promoted by stiffening the extracellular matrix (Aragona et al, 2013; Fig 2C). Drugs targeting dNTP synthesis and the activity of RRM2 are often used as chemotherapeutics to treat tumours, including breast cancer; resistance to these drugs can be observed in some cases, and this has been linked to overexpression of RRM1/2 subunits (Vander Heiden, 2011; Aye et al, 2015). We thus compared the sensitivity to gemcitabine treatment of breast cancer cells in conditions of low YAP activity (soft agar) and of increased YAP activity (by expression of YAP 5SA), and found that YAP promotes gemcitabine resistance (Fig 2D). In line with this result, we found evidence that YAP/TAZ target genes are higher in breast cancer cells displaying reduced sensitivity to gemcitabine in the NCI60 cell line database (Fig 2E).
Figure 2. YAP‐induced growth requires key deoxynucleotide metabolism genes.
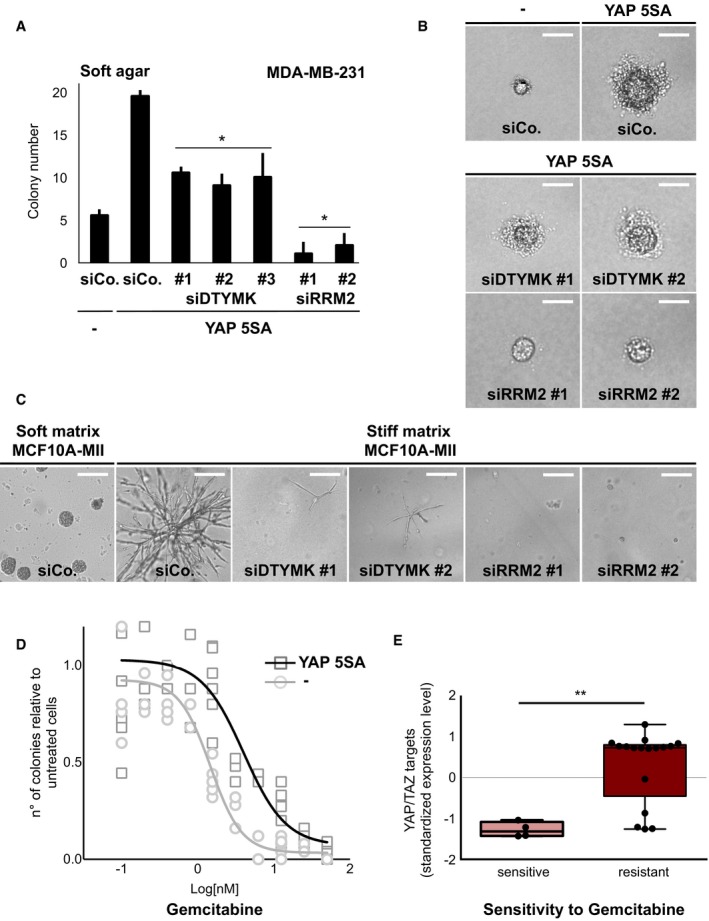
- Depletion of DTYMK or RRM2 in MDA‐MB‐231 cells impairs YAP‐induced colony‐forming ability in soft agar. The graph quantifies the number of colonies growing on a defined surface area, equal for all experimental conditions. n = 4. Data are mean and SD with *P < 0.05 (two‐tailed Student's t‐test).
- Representative pictures of colonies quantified in (A). Pictures indicate that YAP 5SA increases not only the number of colonies but also their size, while siRRM2 and siDTYMK act in the opposite way. Scale bar: 80 μm.
- Representative pictures of MCF10A‐MII cells transfected with the indicated siRNA and embedded in a soft matrix (Matrigel) or in a stiff matrix (Matrigel plus CollagenI), the latter sustaining growth through YAP/TAZ (Aragona et al, 2013). Scale bar: 200 μm. n = 4.
- Control and YAP 5SA‐expressing MDA‐MB‐231 cells in soft agar were treated with the indicated doses of gemcitabine. n = 6.
- Levels of YAP/TAZ target genes in breast cancer cell lines displaying resistance to gemcitabine as compared to sensitive cell lines, based on NCI60 database (see Materials and Methods). Boxes: 25th to 75th percentile; whiskers: smallest to largest value. **P < 0.005 (unpaired two‐tailed t‐test).
Figure EV2. Validation of siRNA efficiency.
-
A, BqPCR for endogenous DTYMK and RRM2 expression levels in MDA‐MB‐231 cells 48 h after siRNA transfection. n = 4. Data are mean and SD with *P < 0.05 (two‐tailed Student's t‐test).
Collectively, data gathered so far indicate that nucleotide metabolism is one of the important genetic programmes sustained by YAP/TAZ in cancer cells to promote proliferation, and this might have relevance for the treatment of YAP‐driven tumours.
YAP overcomes blockade of dNTP metabolism during oncogene‐induced senescence
Oncogene‐induced senescence (OIS) is observed in primary cells and tissues upon activation of oncogenes such as Ras (Campisi, 2013). OIS entails growth arrest together with the emergence of other hallmark phenotypes, including the expression of acidic beta‐galactosidase activity (senescence‐activated beta‐gal or SAβgal), nuclear enlargement with downregulation of LaminB1 expression and the formation of senescence‐associated heterochromatin foci (SAHF), and expression of secreted cytokines (senescence‐activated secretory phenotype or SASP). OIS is considered a tumour‐suppressor mechanism that opposes cell transformation (Prieur & Peeper, 2008; Campisi, 2013). Recent evidence indicates that deoxynucleotide metabolism plays an important role during oncogene‐induced senescence: Ras activation inhibits the expression of key dNTP enzymes, leading to replication stress and in turn inducing the senescent response (Aird et al, 2013; Mannava et al, 2013; Wiley & Campisi, 2016). Interestingly, these enzymes are the same that we found regulated by YAP and TAZ in cancer cells.
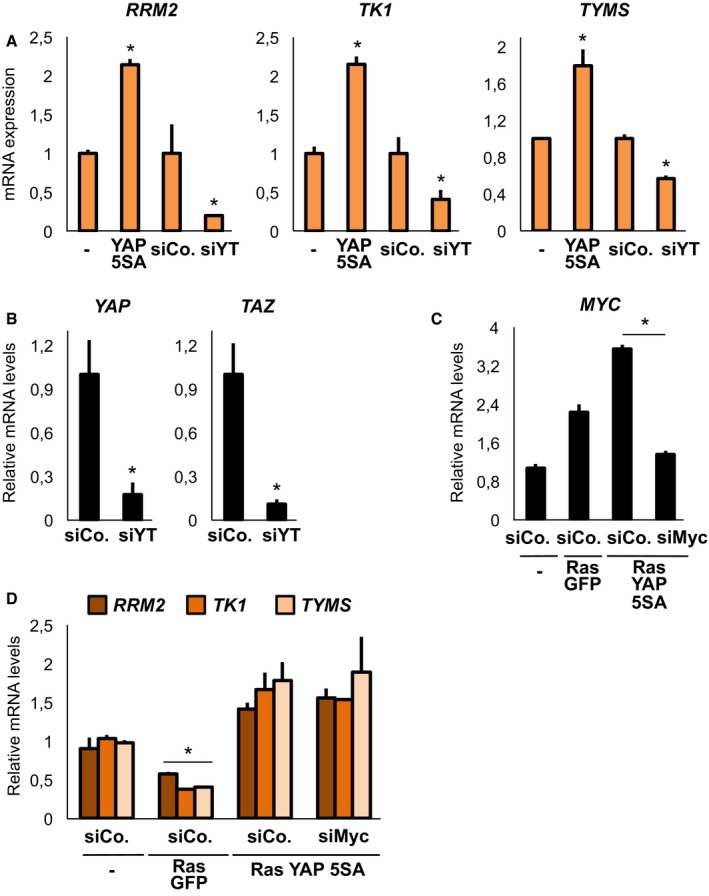
To test whether YAP could intersect OIS, we first checked that dNTP enzymes were effectively regulated by YAP and TAZ also in WI38 human primary lung fibroblasts, an established cellular system for senescence (Fig EV3A and B). Then, we transduced oncogenic Ras (H‐Ras G12V) to initiate the senescence response, alone or with activated YAP‐5SA, and found that YAP was sufficient to reactivate dNTP enzyme expression (Fig 3A and B). This occurs independently of Myc (Fig EV3C and D), even if YAP can intersect Myc activity (Croci et al, 2017), and if Myc is a known regulator of dNTP metabolism (Hsieh et al, 2015). Coherently, YAP also rescued dNTP biosynthesis, indicating an effective rescue of deoxynucleotide metabolism (Fig 3C).
Figure EV3. YAP/TAZ regulate nucleotide metabolism genes in human primary fibroblasts.
-
AqPCR for endogenous nucleotide metabolism genes in WI38 cells that were infected with control (−) or YAP 5SA‐encoding retroviruses (4 days), or transfected with the indicated siRNAs (48 h): control (siCo.), YAP/TAZ (siYT). Control cells were arbitrarily set to 1. n = 4.
-
BqPCR for YAP and TAZ mRNA levels in WI38 cells. n = 4.
-
C, DWI38 cells were transfected with control siRNA (siCo.) or YAP/TAZ siRNA (siYT) and, 8 h later, were infected with the indicated vectors. Cells were collected at 2 days (see Materials and Methods) and assayed by qPCR analysis on Myc (B) or nucleotide metabolism genes (C). n = 4.
Figure 3. YAP overcomes Ras‐induced inhibition of dNTP metabolism in primary human fibroblasts.
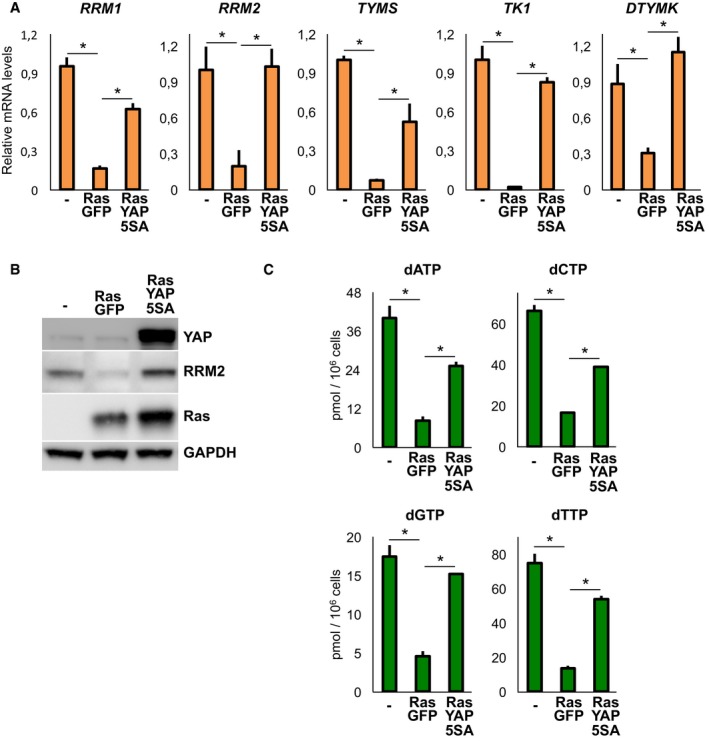
- Western blot analysis of WI38 cell extracts infected as in (A). GAPDH is the loading control. Two independent experiments.
- Steady‐state size of dNTP pools in WI38 cells infected as indicated in (A). n = 4.
We then looked at phenotypes induced downstream of blockade of nucleotide metabolism (Aird et al, 2013) such as proliferation (Fig 4A–C), LaminB1 expression (Fig 5A), SAHF formation (Fig 5B and C), SAβgal (Fig 5D and E) and expression of SASP genes (Fig 5F), and found that all these phenotypes were remarkably rescued by YAP. Similar results were observed in IMR90 human fibroblasts and in HPNE (Chang et al, 2014) ductal pancreatic cells (Fig EV4B–D). Of note, a mutated version of YAP unable to drive transcription (S94A) was unable to counteract Ras‐induced senescence phenotypes (see Figs 4B, and 5B and C). Importantly, knockdown of RRM2 reinstalled senescent phenotypes in cells co‐expressing Ras and YAP (Fig 5G and H). Collectively, these data suggest that YAP overcomes Ras‐induced senescent phenotypes by sustaining dNTP metabolism.
Figure 4. YAP overcomes Ras‐induced growth arrest.

- Expression of active YAP 5SA overcomes regulation of cell‐cycle genes by Ras in WI38 cells (6 days). n = 4.
- EdU incorporation in WI38 cells expressing the indicated retroviral transgenes. YAP 5SA S94A‐mutant is unable to bind TEAD co‐factors and to activate transcription. Representative results of a single experiment (> 350 cells per condition); n = 4.
- Representative EdU stainings and nuclear counterstains (DAPI) of WI38 cells quantified in (B). Scale bar: 80 μm.
Figure 5. YAP overcomes Ras‐induced senescent phenotypes.
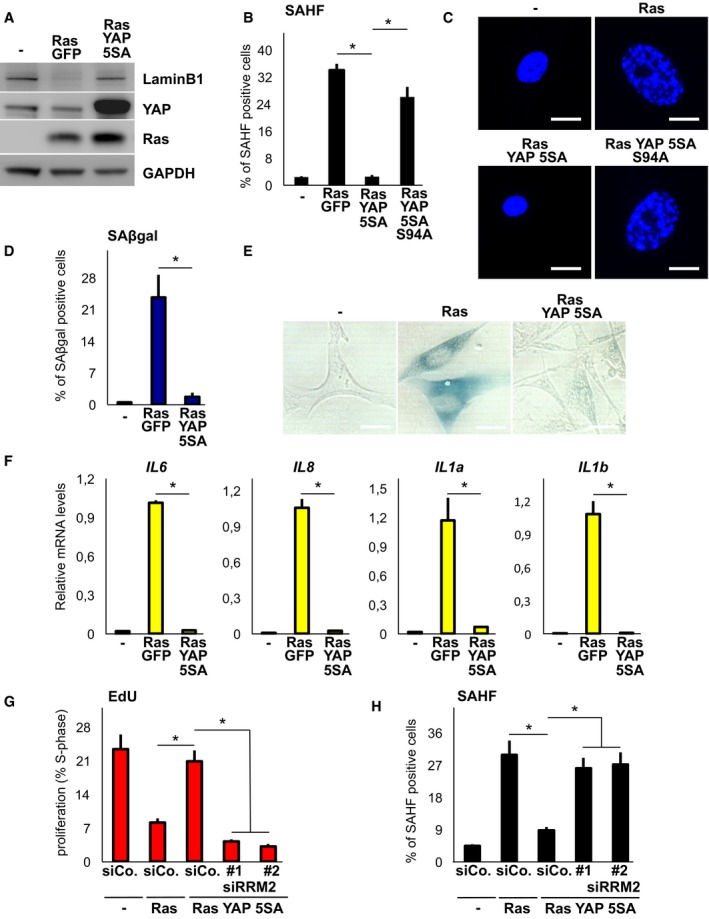
- Western blot analysis of WI38 cells expressing the indicated retroviral transgenes (here and throughout the figure, 6 days). GAPDH serves as loading control. Two independent experiments.
- SAHF (senescence‐associated heterochromatin foci) formation WI38 cells expressing the indicated retroviral transgenes. See Fig EV4A for further controls on Ras. Representative results of a single experiment (> 100 cells per condition); n = 3.
- Representative pictures of DAPI staining to visualize SAHF quantified in (B). Scale bar: 15 μm.
- Induction of SAβgal (senescence‐associated β‐galactosidase) activity in WI38 cells. Representative results of a single experiment (> 100 cells per condition); n = 3.
- Representative pictures of SAβgal staining quantified in (D). Scale bar: 20 μm.
- qPCR for SASP (senescence‐associated secretory phenotype) marker genes in WI38 cells. n = 6.
- Quantification of proliferating WI38 cells as measured by EdU incorporation. Control and RRM2 siRNAs were transfected 1 day after starting selection. Representative results of a single experiment (> 100 cells per condition); n = 4.
- WI38 cells were processed as in (G) but stained for SAHF. Representative results of a single experiment (> 100 cells per condition); n = 3.
Figure EV4. YAP overcomes Ras‐induced inhibition of dNTP metabolism in human pancreatic ductal cells.
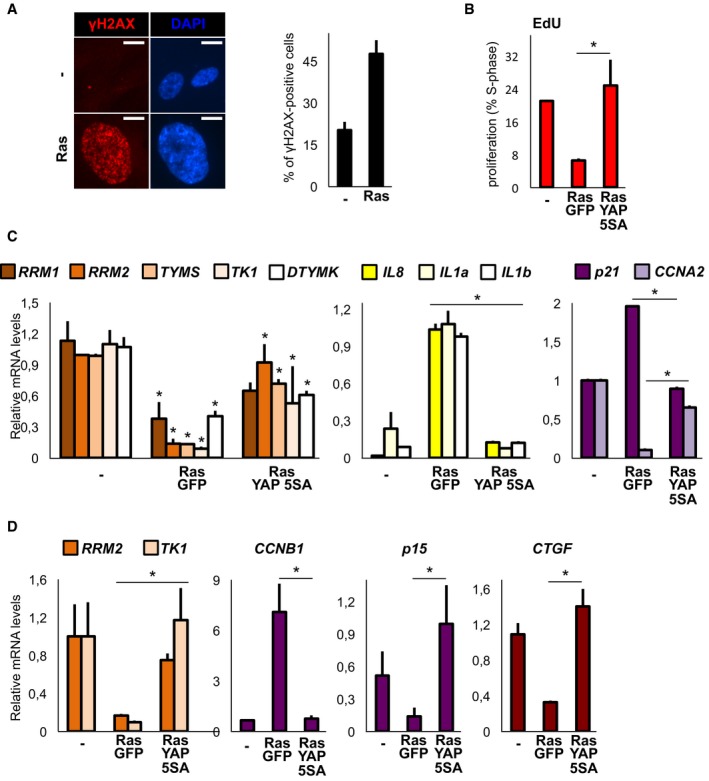
- On the left: representative immunofluorescence images of γH2AX in WI38 cells expressing the indicated retroviral transgenes. Scale bar: 10 μm. On the right: quantification of γH2AX‐positive cells (> 200 cells per condition); n = 3.
- EdU incorporation in human pancreatic ductal cells (HPNE) expressing the indicated lentiviral transgenes. Cells were tested 10 days after infection. Representative results of a single experiment (> 200 cells per condition); n = 4.
- qPCR in HPNE cells processed as in (D) for nucleotide metabolism genes (orange), SASP genes (yellow) and cell‐cycle markers (purple). n = 4.
- qPCR in IMR90 fibroblasts expressing the indicated retroviral constructs. Cells were tested 6 days after starting selection. n = 4.
Ras inhibits endogenous YAP/TAZ targets in cells undergoing senescence
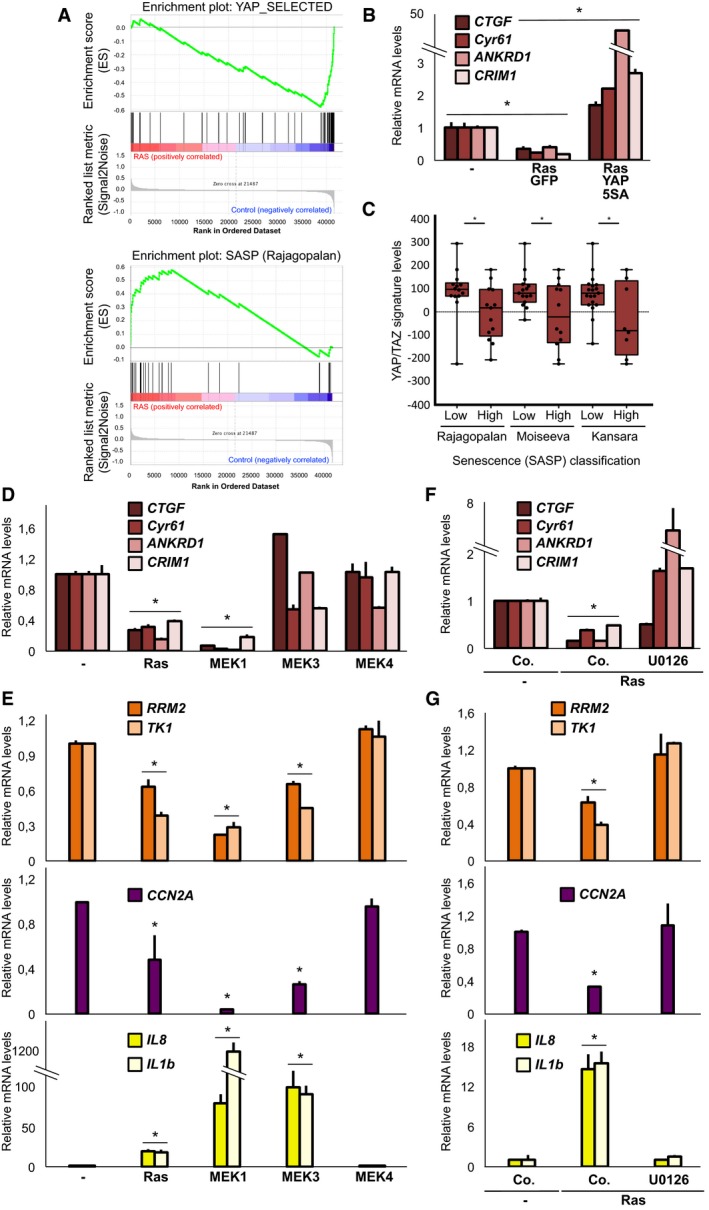
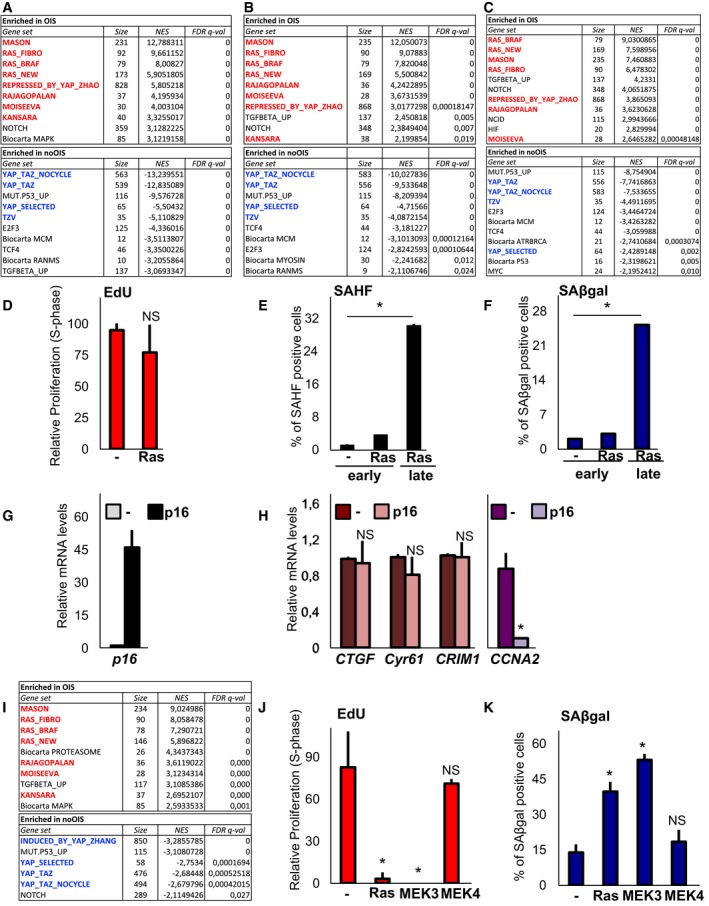
Prompted by our findings, we also tested whether Ras inhibits endogenous YAP/TAZ activity. We first surveyed available microarray experiments performed on fibroblasts expressing activated Ras and found a significant enrichment of YAP/TAZ‐induced targets among the genes inhibited by Ras (Figs 6A, and EV5A and B); conversely, we found the targets inhibited by YAP/TAZ enriched among the genes induced by Ras (Fig EV5A and B). As a control, signatures containing SASP genes (Campisi & d'Adda di Fagagna, 2007; Rajagopalan & Long, 2012; Kansara et al, 2013; Moiseeva et al, 2013) were also enriched among the genes induced by Ras (Figs 6A, and EV5A and B). Interestingly, similar evidence was obtained from data in primary human melanocytes expressing BRAF (V600E; Pawlikowski et al, 2013; Fig EV5C). We then directly monitored the expression of a set of genes broadly regulated by YAP/TAZ (see below, Fig EV6A), including CTGF, CYR61, ANKRD1 and the newly validated CRIM1, and found that Ras inhibited their expression (Fig 6B). Importantly, this regulation, as well as regulation of dNTP metabolism genes (see below, Fig 6E and G), was already evident at early time‐points following Ras expression, before the induction of growth inhibition, SAHF and SAβgal (Fig EV5D–F). This makes unlikely the possibility that regulation of YAP/TAZ targets, including dNTP metabolism, is a secondary effect of senescence establishment. Further supporting the view that YAP/TAZ are regulated before growth arrest, expression of YAP/TAZ target genes was not inhibited upon forced expression of the CDK inhibitor p16/CDKN2A (Fig EV5G and H).
Figure 6. Ras and MEK1 inhibit YAP/TAZ transcriptional activity during induction of senescence.
-
ARepresentative gene set enrichment analysis for YAP/TAZ target genes and SASP genes (Rajagopalan) in published microarrays of primary cells undergoing Ras‐induced senescence (FDR q‐value < 0.05). See Fig EV5A–C for complete results.
- B
-
CAverage levels of a YAP/TAZ target gene signature in mouse skin papillomas with mutated Ras and classified according to high or low levels of the indicated SASP gene signatures (see Materials and Methods). Boxes: 25th to 75th percentile; whiskers: smallest to largest value. Closed circles indicate expression values in the single papillomas (n = 27).
-
DqPCR for endogenous YAP/TAZ target genes in WI38 cells expressing active forms of Ras, MEK1, MEK3 or MEK4 for 2 days. This indicates early inhibition of YAP/TAZ. n = 4.
-
EqPCR on WI38 cells infected as in (D) for dNTP metabolism genes (orange), of the CCNA2 proliferation marker, and of SASP genes (purple). n = 4.
-
F, GqPCR on WI38 cells expressing active Ras and treated with 10 μM U0126 MEK1/2 inhibitor (2 days). n = 4.
Figure EV5. Ras and MEK1 inhibit YAP/TAZ transcriptional activity during induction of senescence.
-
A–CGene set enrichment analysis (GSEA) with multiple signatures, including genes regulated by YAP/TAZ, genes regulated by Ras (Ras_MASON), and SASP signatures (Rajagopalan, Moiseeva, Kansara) on genes regulated by Ras in IMR90 primary human fibroblasts (GSE59522 in A, GSE60652 in B) and by BRAF (V600E) in primary human melanocytes (GSE46801 in C). YAP_TAZ_NOCYCLE is a list of YAP‐induced genes that was manually curated to exclude known E2F and cell cycle‐related genes. REPRESSED_BY_YAP is a list of YAP‐inhibited genes in fibroblasts. A positive normalized enrichment score (NES) indicates signatures enriched in OIS (in red), while negative NES indicates signatures enriched in non‐senescent cells (noOIS, in blue). We considered false discovery rate (FDR) < 0.05 as a cutoff for a significant enrichment. Only the ten most enriched signatures are shown here for simplicity.
-
DEdU incorporation in WI38 cells was processed immediately after puromycin selection (2 days after starting selection) as in Fig 6D–G. n = 6 (> 250 cells per condition).
-
E, FQuantification of SAHF‐ (E) and SAβgal‐positive WI38 cells (F) 2 days (early) or 6 days (late) after starting selection. Representative results of a single experiment (> 150 cells per condition); n = 4.
-
G, HWI38 cells were infected with control vector (−) or with p16 and analysed by qPCR for p16 levels (G) or for YAP/TAZ target genes and CCNA2 proliferation marker (H). Infected cells were harvested after puromycin selection (2 days). These cells were not senescent, as judged by SAHF and SAβgal. n = 6.
-
IGene set enrichment analysis (GSEA) with multiple signatures as in (A) on genes regulated by MEK1 in IMR90 primary human fibroblasts (GSE2487 in D). Only the ten most enriched signatures are shown here for simplicity.
-
J, KWI38 cells were infected as indicated and analysed 6 days after starting selection. for EdU incorporation (I) and SAβgal activity (J). Representative results of a single experiment (> 150 cells per condition); n = 4.
Figure EV6. Inhibition of YAP/TAZ induces senescence‐like phenotypes.
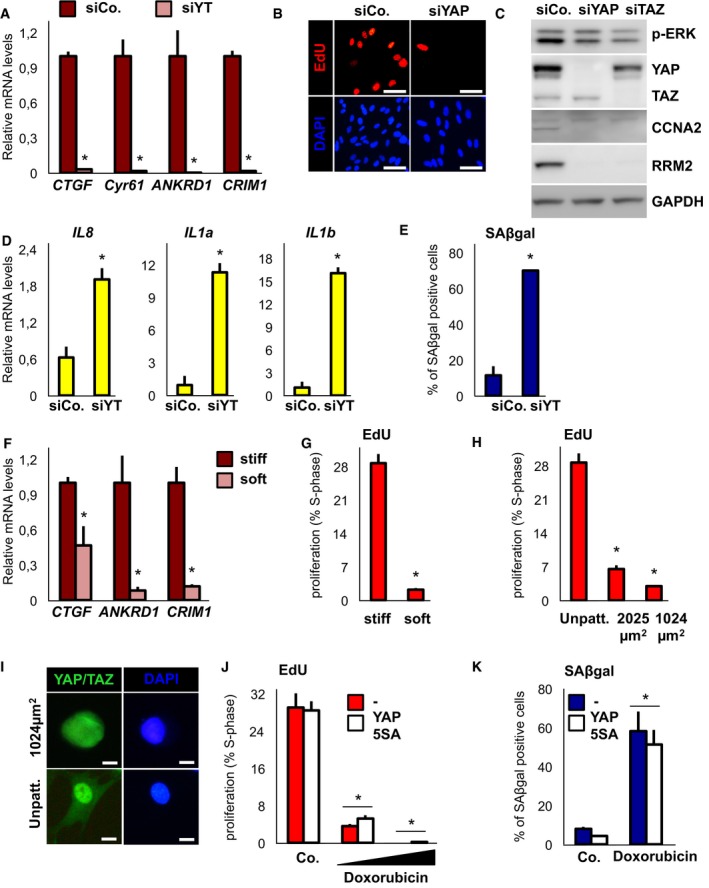
- WI38 cells transfected with the indicated siRNAs: control (siCo.) or YAP/TAZ (siYT) and examined for gene expression of established YAP/TAZ target genes. n = 4.
- Representative EdU stainings and nuclear counterstains (DAPI) of WI38 cells quantified in Fig 7B. Scale bar: 80 μm.
- Western blot analysis for p‐ERK levels in WI38 cells depleted of YAP/TAZ. GAPDH is a loading control.
- qPCR for SASP genes on MDA‐MB‐231 cells transfected with control (siCo.) or YAP/TAZ (siYT) and collected at 2 days. n = 4.
- Quantification of MDA‐MB‐231 cells transfected as in (C) and stained for SAβgal activity 4 days after transfection. Representative results of a single experiment (> 200 cells per condition); n = 4.
- qPCR on WI38 cells plated as in Fig 7F–I on soft hydrogels, and examined for expression of established YAP/TAZ target genes. n = 4.
- Quantification of proliferation (EdU stainings) on WI38 cells plated on fibronectin‐coated glass coverslips (stiff) or fibronectin‐coated hydrogels (soft). Representative result of a single experiment (> 100 cells per condition); n = 4.
- Quantification of proliferation (EdU stainings) on WI38 cells plated on fibronectin‐coated glass coverslips (Unpatt.), on medium‐small (2,025 μm2) or on small (1,024 μm2) fibronectin‐coated small islands. Representative result of a single experiment (> 100 cells per condition); n = 2.
- Representative immunofluorescence images of YAP/TAZ in WI38 cells plated on fibronectin‐coated glass coverslips (Unpatt.) or on small (1,024 μm2) microprinted fibronectin‐coated islands. DAPI serves as nuclear counterstain. Scale bar: 15 μm.
- WI38 cells were infected with control vector (−) or YAP 5SA‐encoding retrovirus, treated with 100 ng/ml or 20 ng/ml doxorubicin and assayed by EdU staining. Representative result of a single experiment (> 100 cells per condition); n = 4.
- WI38 cells were infected with control vector (−) or YAP 5SA‐encoding retrovirus, treated with 100 ng/ml doxorubicin and stained for SAβgal activity. Representative result of a single experiment (> 100 cells per condition); n = 4.
Senescence is a tumour‐suppressive mechanism during skin tumorigenesis induced by TPA/DMBA treatment, where Ras is mutated (Fujiki et al, 1989) and where the transition from papillomas to carcinomas often entails inactivation of the p16/CDKN2A locus (McCreery et al, 2015). Taking advantage of available gene expression data from single mouse skin papillomas (McCreery et al, 2015), we classified them according to high vs. low levels of SASP as a proxy for Ras‐induced senescence, and monitored the levels of YAP/TAZ target genes in these two groups. As shown in Fig 6C, papillomas displaying higher levels of SASP genes expressed significantly lower levels of YAP/TAZ target genes, in line with their inhibition during OIS observed in vitro.
To gain further insights into YAP/TAZ inhibition by Ras, we explored at early time‐points which Ras‐induced signalling pathway (i.e., p38, MAPK and JNK) was more specifically involved. For this, we overexpressed the activated forms of MEK1 (MAPK), MEK3 (p38) and MEK4 (JNK), some of which are sufficient to induce senescence (Lin et al, 1998; Wang et al, 2002), and monitored YAP/TAZ target genes. MEK1 was much stronger at inhibiting YAP/TAZ activity compared to the other MEKs (Fig 6D), and this correlated with senescence induction. In line, we observed a significant enrichment of YAP/TAZ target genes among the genes inhibited by MEK1 in IMR90 fibroblasts by GSEA (Fig EV5K). As a control, we also monitored selected markers for dNTP metabolism, proliferation and SASP (Figs 6E, and EV5I and J). Importantly, when we challenged Ras‐mediated effects with small molecule inhibitors of the MEK1/2 or p38 pathways, we found that MEK inhibition was sufficient to rescue YAP/TAZ target gene expression (Fig 6F and G). These data, together with previous observations, suggest that YAP/TAZ inhibition, proximal to Ras/MEK activation, is required for induction of senescence.
YAP/TAZ requirement unveils a connection between mechanical cues and senescence
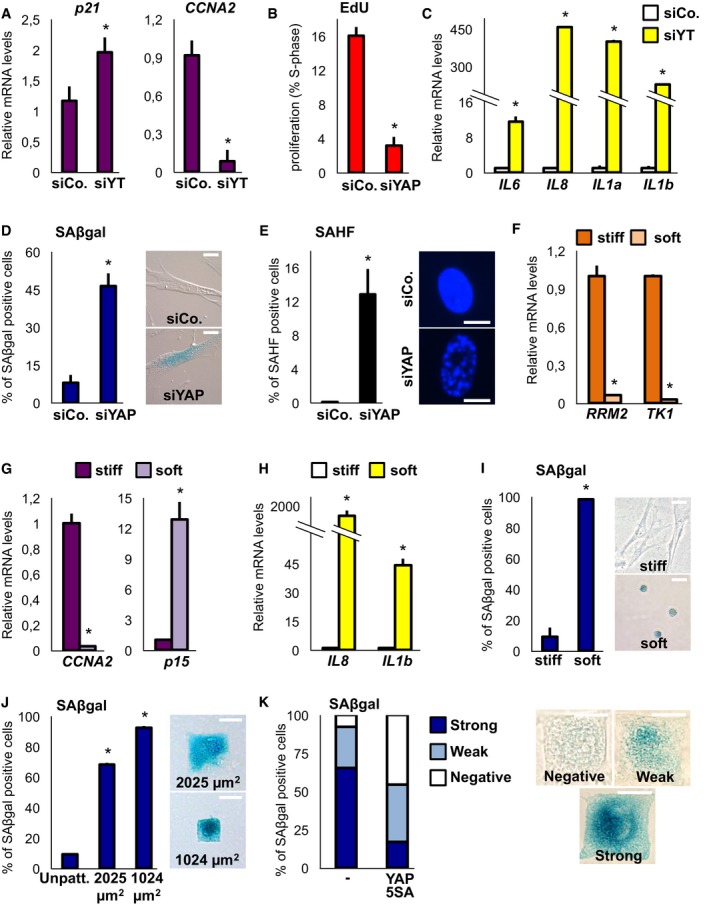
We next asked whether YAP/TAZ inhibition might be also sufficient to recapitulate at least some senescent phenotypes. We knocked down YAP and monitored a panel of senescence markers including proliferation (Fig 7A and B), SASP (Fig 7C), SAβgal expression (Fig 7D) and SAHF formation (Fig 7E), and found them all regulated in WI38 cells. Of note, this happened in the absence of increased MAPK phosphorylation (Fig EV6C), in keeping with YAP/TAZ acting downstream of Ras. Moreover, YAP/TAZ downregulation was associated with the emergence of senescence‐associated phenotypes also in transformed MDA‐MB‐231 cells (Fig EV6D and E).
Figure 7. YAP inhibition by ECM mechanical cues is sufficient to induce senescent phenotypes.
-
A, BsiRNA knockdown of YAP/TAZ induces growth arrest in WI38 cells as assayed by expression of cell‐cycle genes at 2 days (A), n = 4, and EdU incorporation at 5 days (B), representative results of a single experiment (> 600 cells per condition); n = 4. See Fig EV6A for efficiency of siYT on its direct targets.
-
CqPCR for SASP markers on WI38 cells transfected as in (A) at 2 days. n = 4.
-
DInduction of SAβgal activity at 5 days in WI38 cells. Representative result of a single experiment (> 160 cells per condition); n = 4. Scale bar of the representative pictures: 20 μm.
-
ESAHF formation at 5 days in WI38 cells. Representative result of a single experiment (> 160 cells per condition); n = 4. Scale bar of the representative DAPI stainings: 10 μm.
-
F–HqPCR for dNTP metabolism genes (A) proliferation markers (B) and SASP markers (C) on WI38 cells plated on tissue‐culture plastic (stiff) or on fibronectin‐coated hydrogels (soft, elastic modulus E ≈ 0.7 KPa). n = 4.
-
IWI38 cells plated on tissue‐culture plastic (stiff) or on fibronectin‐coated hydrogels (soft, elastic modulus E ≈ 0.7 KPa) and stained for SAβgal activity. On the right: representative pictures of the cells. Note the rounded cell shape of cells on the soft hydrogel. n = 3. Scale bar: 40 μm.
-
JWI38 cells were plated on fibronectin‐coated glass coverslips (Unpatt.) or on fibronectin‐coated small islands of 2,025 μm2 (medium‐small) or 1,024 μm2 (small) and stained for SAβgal activity. Representative result of a single experiment (> 100 cells per condition); n = 2. On the right: representative pictures of the cells. Scale bar: 30 μm.
-
KWI38 cells were infected with control vector (−) or YAP 5SA‐encoding retrovirus and plated on 2,025‐μm2 fibronectin‐coated small islands. Cells were stained for SAβgal activity and scored for strong, weak or negative SAβgal activity. Pictures show representative SAβgal stainings. Scale bar: 30 μm.
YAP and TAZ activity can be regulated, among other inputs, by mechanical cues (Dupont et al, 2011; Dupont, 2016); we thus asked whether mechanical conditions inducing YAP/TAZ inhibition would also induce senescence phenotypes. We first addressed this hypothesis by seeding cells on soft fibronectin‐coated acrylamide hydrogels (Elastic modulus ≈ 0.7KPa); analysis of dNTP genes, of SASP and SAβgal expression, indicated that a soft ECM induces senescence (Figs 7F–I, and EV6F and G). To provide independent evidence, we monitored cells seeded on micropatterned fibronectin‐coated islands of limiting size (Dupont et al, 2011; Wada et al, 2011), and found that also a small cell geometry induces Saβgal, in addition to growth arrest, in WI38 fibroblasts (Figs 7J, and EV6H and I). Importantly, as in the case of Ras shown above, this critically depends on YAP/TAZ inhibition (Fig 7K). As a control, YAP/TAZ was unable to rescue senescent phenotypes induced by the DNA‐damaging agent doxorubicin (Fig EV6J and K). Collectively, these results indicate that YAP inhibition is instrumental to induce cell senescence downstream of mechanical cues and that senescence is a novel mechano‐regulated phenotype.
Discussion
It is well established that YAP/TAZ powerfully regulate cell proliferation; however, what is the genetic programme underlying this activity is only starting to emerge, and likely entails regulation of several processes in parallel (Zanconato et al, 2015; Jang et al, 2017). Here, we focused on the observation that YAP/TAZ sustain the expression of a series of key nucleotide metabolism genes across several actively proliferating cell lines, which results in profound regulation of dNTP steady‐state levels. A similar connection has been proposed in the zebrafish liver, although in that case YAP regulates glutamine metabolism to indirectly sustain deoxynucleotide synthesis (Cox et al, 2016). Our data instead indicate that YAP directly regulates, in combination with TEAD factors, at least some key players in dNTP metabolism. This is required for their growth‐inducing activity when cells are placed in suspension, or promoted by stiffening of the ECM microenvironment. Moreover, elevation of dNTP metabolism genes by YAP correlates with increased resistance to a chemotherapeutic acting specifically on dNTP metabolism. Thus, YAP not only regulates G1/S transition, but also directly supports a steady supply of dNTPs for DNA replication.
Prompted by these findings, and given the previously established role for dNTP metabolism in oncogene‐induced senescence, we also found that YAP, by sustaining dNTP production and likely other genetic programmes, prevents induction of growth arrest and overcomes Ras‐induced senescence in human primary cells. Furthermore, we serendipitously found that Ras activation entails the inhibition of endogenous YAP/TAZ activity, and that depletion of YAP/TAZ is sufficient to induce senescent phenotypes, indicating that regulation of YAP/TAZ is part of the chain of events leading to senescence, at least in vitro. This preferentially occurs upon activation of MEK1, which we found required and sufficient to inhibit YAP/TAZ targets during OIS. Finally, in keeping with a proximal inhibition downstream of Ras, we observed early inhibition of YAP/TAZ targets.
The link between YAP/TAZ and OIS might be relevant in the context of skin tumorigenesis, as we found that papillomas harbouring Ras activation and displaying higher levels of SASP genes, that we used as a proxy for senescence, also display lower levels of YAP/TAZ target genes. In more advanced tumours, YAP/TAZ cooperate with Ras, such that they can even substitute for Ras addiction in well‐formed tumours; in this case, YAP/TAZ and Ras converge on regulation of proliferation‐associated genes (Kapoor et al, 2014; Shao et al, 2014; Zhang et al, 2014). This suggests the interesting possibility that the opposing effects of Ras during tumorigenesis, that is, senescence (early on) and cell growth (later during tumour development), entail opposing effects of Ras on YAP/TAZ. One potential mechanism underlying the effects of Ras on YAP/TAZ might be the differential regulation of AP1 (i.e., Jun/Fos) factors: AP1 dimers containing c‐Jun promote tumorigenesis and cooperate with YAP/TAZ to support proliferation, while JunB inhibits tumorigenesis and induces p16/CDKN2A, a hallmark of senescence (Passegué & Wagner, 2000; Das et al, 2007; Jin et al, 2011; Zanconato et al, 2015). It will be thus interesting to test the possibility that JunB interferes with YAP/TAZ activity.
Further extending our results, we found that a mechanical microenvironment promoting YAP/TAZ inhibition also promotes primary cell senescence. On one side, this expands the array of mechanoresponses available to study these processes; more in general, it reinforces the notion that mechanical cues, by regulating YAP/TAZ, can set the threshold for the appearance of multiple cellular phenotypes. Given the close link between YAP/TAZ activity, in vitro stem cell renewal and reprogramming of differentiated cells into their corresponding progenitors (Ramos and Camargo, 2012; Nowell et al, 2016; Panciera et al, 2016), it is tempting to speculate that the anti‐senescence activity of YAP/TAZ (and of stiff ECM substrata) here described might be useful to more efficiently drive cell reprogramming (Utikal et al, 2009; Soria‐Valles et al, 2015; Hayashi et al, 2016). Finally, this might also contribute to the ability of YAP/TAZ and of ECM stiffness to support the growth of primary stem cells and organoids ex vivo (Gilbert et al, 2010; Gjorevski et al, 2016).
Materials and Methods
Plasmids and reagents
pBABEpuro RasG12V (HRas) was Addgene 9051 from Dr. Hahn. pBABEpuro‐YAP (wild‐type or 5SA‐mutant, siRNA resistant) were as in Aragona et al (2013). The other retroviral constructs were generated by standard subcloning of IRES‐GFP, IRES‐YAP 5SA or IRES‐YAP 5SA S94A in pBABEpuro RasG12V. pBABEpuro empty vector was used as control retroviral transduction. pBABEpuro MEK1Q56P, pBABEpuro MEK3E and pBABEpuro MEK4E were a kind gift from Peiqing Sun. Lentiviral CSII‐CMV‐Ras‐IRES‐GFP‐IRES2‐Bsd and CSII‐CMV‐Ras‐IRES‐YAP 5SA‐IRES2‐Bsd were generated by standard subcloning. CSII‐CMV‐MCS‐IRES2‐Bsd empty vector was used as control. pXJ40‐HA‐Merlin/NF2 (S518A) was Addgene 19700 from Dr. Giancotti. All plasmids were sequence‐verified prior to use.
Latrunculin A and forskolin were from Sigma; gemcitabine and U0126 were from Santa Cruz Biotechnology. All these molecules were dissolved as recommended and controlled by using equal concentrations of vehicle alone.
Cell culture, transfections and retroviral transductions
MDA‐MB‐231 (STR verified) breast cancer cells were cultured in DMEM/F12 with 10% FBS and 2 mM glutamine; MCF10AT1K (also known as MII, a gift from Dr. Santner) in DMEM/F12 with 5% horse serum, 2 mM glutamine, insulin, cholera toxin, hydrocortisone and EGF (Debnath et al, 2003); low‐passage WI38 human fibroblasts, purchased from Public Health England Culture Collections (ECACC catalog 90020107), and low‐passage IMR90 (Dr. Rampazzo) in MEM supplemented with 10% FBS and 2 mM glutamine. HPNE cells were cultured as in Chang et al (2014). WI38 and IMR90 were expanded and cultured in low oxygen conditions (5%) to avoid replicative senescence; for infection or transfection, cells were moved to a standard incubator with normal oxygen conditions until harvesting. All the experiments on WI38 fibroblasts were concluded before 30 population doublings.
siRNAs were transfected by using Lipofectamine RNAi MAX (Life Technologies). siRNAs were dsRNA oligos with overhanging dTdT (Life Technologies), based on FlexiTube GeneSolution siRNA sets (Qiagen). Targeted sense sequences of the mRNA are as follows: siYAP: CUGGUCAGAGAUACUUCUU; siTAZ: AGGUACUUCCUCAAUCACA; siRRM2 #1: GAGGAGAGAGUAAGAGAAA, siRRM2 #2: AGACAGACUUAUGCUGGAA; siDTYMK #1: CAGUUGGAAUUCUCCUAAA; siDTYMK #2: CCGGAAAGAUCAACUGAAA; siDTYMK #3: GAUGGUGGAUGCUUCCAAA; siMyc: GGUCAGAGUCUGGAUCACC. Control siRNA was Qiagen AllStars Negative Control siRNA. DNA was transfected by using Transit‐LT1 (MirusBio). For retroviral production, HEK293gp cells were transiently transfected with retroviral vector and pMD2 env (packaging vector). 48 h after transfection, virus particles were filtered (0.45 μm) and used diluted with polybrene to infect cells. Starting 48 h after infection, cells were selected by puromycin for 2 days and then released in fresh medium. Cells were collected for RNA extraction, proliferation and other OIS analyses 2 or 6 days after the beginning of the selection.
Quantitative PCR
Total RNA was isolated using RNeasy Mini Kit (Qiagen), DNase step included, according to the manufacturer's procedures. cDNA was synthesized using M‐MLV Reverse Transcriptase (Life Technologies) and oligo‐dT primers. Quantitative PCR was carried out with FastStart SYBR Green Master Mix (Roche) on a QuantStudio 6 real‐time thermal cycler. GAPDH expression levels were used as internal control to normalize gene expression data between samples. Sequences of primers are provided as Table EV1.
Chromatin immunoprecipitation
Chromatin immunoprecipitation analyses were performed as previously described (Enzo et al, 2015). Sequences of primers and of the peaks are provided in as Tables EV1 and EV2.
Soft agar and 3D cell culture
For soft agar, we embedded MDA‐MB‐231 cells in growth medium containing 0.3% low melting agarose layered on a pre‐gelled 0.6% agarose bed. When solidified, each well was filled with growth medium and the medium was renewed twice per week. Four weeks later, images were acquired to count colonies. For soft agar assay on MDA‐MB‐231 transfected with siRNA, we trypsinized cells 1 day after siRNA transfection and plated 10,000 cells for each condition in 6‐well plates in duplicates; for soft agar assay on MDA‐MB‐231 cells treated with gemcitabine, 500 cells were embedded in 96‐well in triplicates and drug treatments were serially diluted in medium. Cells were embedded in soft agar 24 h after siRNA transfection. The graphs quantify the number of colonies growing on a defined surface area, equal for all experimental conditions. To monitor gene expression in these conditions, MDA‐MB‐231 cells were plated in six wells on top of 0.3% low melting agarose and collected after 72 h for RNA extraction.
For 3D cell culture, 500 MCF10A‐MII cells were embedded in growth factor‐reduced Matrigel (BD Biosciences) (soft matrix) or 200 MCF10A‐MII cells in a mixture of growth factor‐reduced Matrigel and CollagenI (Trevigen Culturex 3D Culture Matrix Rat CollagenI; stiff matrix). CollagenI solution was neutralized on ice with 0.1 M NaOH in PBS to bring the pH to 7.5. A solution of 60% CollagenI and 40% Matrigel was then mixed on ice to obtain stiff matrix. Cells were then embedded in stiff or soft matrixes as in Aragona et al (2013). We used less cells in the stiffer matrix to compensate for increased cell growth. Seven days later, images of the 3D cell cultures were acquired.
EdU, SAβgal and SAHF detection
Cells were plated on top of 13‐mm‐diameter fibronectin‐coated glass coverslips for 48 h or 72 h before fixation. Cells were incubated for 1 h with EdU before fixation with 3.7% formaldehyde and then analysed according to manufacturer's instructions (Life Technologies). SAβgal staining was performed exactly as described in Dimri et al (1995). SAHF were visualized by DAPI staining on fixed cells at high magnification (63× objective).
Antibodies, Western blotting and immunofluorescence
Antibodies were YAP/TAZ (sc101199), Ras (Hras sc‐520), Lamin B1 (sc‐6216), p‐ERK (sc‐7383), RRM2 (sc‐10844), CCNA2 (sc‐596) and GAPDH (Millipore MAB374). Western blotting was performed as in Dupont et al (2009) and immunofluorescence as in Aragona et al (2013).
Determination of intracellular dNTP pools
dNTP pool extraction and size determination were carried out as in Ferraro et al (2010); Rampazzo et al (2010).
Microfabrications
Fibronectin‐coated micropatterned glass slides were purchased from Cytoo SA (PADO‐1 custom mask, available to all users upon request); the sizes of the square island were as in Dupont et al (2011). For each slide, 60,000 WI38 cells were plated in a 35‐mm‐diameter dish, washed after 2 h to remove unattached cells and processed for EdU or SAβgal staining after 48 h. For fibronectin‐coated hydrogels, 150,000 WI38 cells were seeded in drop on top of hydrogels and the dishes containing hydrogels were filled with medium after overnight incubation. Hydrogels were harvested for RNA extraction or fixed for Edu or SAβgal staining 48 h after plating. Fibronectin‐coated hydrogels were produced according to standard procedures as in Dupont et al, 2011).
Analysis of published microarray data
YAP/TAZ target genes in MDA‐MB‐231 cells were defined as in Enzo et al (2015), by selecting genes concordantly downregulated upon transfection of two different siRNA mixes targeting YAP and TAZ (at least twofold and with a q‐value < 0.05 for each siRNA mix), as compared to cells transfected with a non‐targeting control siRNA.
Gene list enrichment analysis was performed using ENRICHR (http://amp.pharm.mssm.edu/Enrichr/; Kuleshov et al, 2016) and the Kyoto Encyclopedia of Genes and Genomes (KEGG) 2016 Database for annotation. KEGG pathways were considered significantly enriched based on adjusted P‐value < 0.05.
For YAP/TAZ regulated nucleotide metabolism genes in other cell lines, we checked for genes significantly downregulated (in experiments entailing YAP/TAZ knockdown) or upregulated (in experiments entailing YAP overexpression) (P‐value < 0.05 after Benjamini and Hochberg adjustment) using GEO2R differential expression analysis (https://www.ncbi.nlm.nih.gov/geo/geo2r/) directly on the GEO database. The following datasets were used, by selecting the appropriate samples: GSE49384 (Mori et al, 2014), GSE56157 (Li et al, 2014), GSE65665 (Fitamant et al, 2015) and GSE55560 (Yimlamai et al, 2014).
Drug response data for breast cancer cell lines have been retrieved from the NCI60 DTP portal GI50 Data (Sept 2014). Briefly, GI50 Data file contains a matrix of GI50 values for 50,816 molecules tested on 115 cancer cell lines. For any compound, GI50 values are computed as minus the log10 of IC50, that is, the drug concentration necessary to inhibit 50% growth of treated cells relative to untreated controls. Prior to analysis, for any compound, GI50 been transformed back to IC50 and then the IC50 has been normalized dividing the IC50 of any cell line by the mean IC50 across all 115 cell lines. The normalized IC50 (in log2 scale) of a compound has been then used to define drug sensitivity of a cell line in term of (i) sensitive if the normalized log2 IC50 was lower than two standard deviations of the distribution of all log2 IC50 in the given cell line, and (ii) resistant otherwise (Taccioli et al, 2015). Gene expression data of breast cancer cell lines from the NCI‐60 panel were downloaded from GSE5720 and GSE32474.
For GSEA of YAP/TAZ target genes, we used signatures previously published in Enzo et al (2015); Zanconato et al (2015). SASP signatures were derived from Moiseeva et al (2013); Rajagopalan and Long (2012); Kansara et al (2013).
Gene expression data for OIS were as follows: GSE59522 and GSE60652 for Ras activation in IMR90 primary human fibroblasts (Young et al, 2009; Takebayashi et al, 2015); GSE2487 for MEK activation in IMR90 primary human fibroblasts (Collado et al, 2005); GSE46801 for BRAF activation in primary human melanocytes (Pawlikowski et al, 2013).
Gene expression data for TPA/DMBA‐induced mouse papillomas were from GSE63967 (McCreery et al, 2015). Mouse skin papillomas were classified as SASP signature “low” if the combined signature score, obtained summarizing the standardized expression levels of the signature genes into a score with zero mean (Adorno et al, 2009), was negative and as SASP signature “high” if the combined score was positive. SASP and YAP/TAZ signatures were converted into mouse gene symbols using the Human and Mouse Homology report file of the Mouse Genome Informatics database (http://www.informatics.jax.org/downloads/reports/HMD_HumanPhenotype.rpt).
All microarray data analyses have been performed in R version 3.3.2.
Statistical analyses
Unless otherwise indicated, data are shown as mean plus standard deviations. Analysis was performed by applying unpaired two‐tailed Student's t‐test between the indicated samples (see Figures); if not explicitly indicated, the bars with the * are compared to the respective control bars.
Every experiment was repeated independently; for each experiment, at least two biological replicates were processed.
Data availability
Data obtained during this study are available within the article and from the corresponding author upon reasonable request. All microarray data are available: GSE49384, GSE56157, GSE65665, GSE55560, GSE5720, GSE32474, GSE59522, GSE60652, GSE2487, GSE46801, GSE63967, GSE59232.
Author contributions
GS and IB performed and analysed experiments, with help from PR and AP. EF and CR performed dNTP quantifications. SB performed bioinformatics analysis. GS and SD wrote the paper.
Conflict of interest
The authors declare that they have no conflict of interest.
Supporting information
Expanded View Figures PDF
Table EV1
Table EV2
Review Process File
Acknowledgements
We thank colleagues for the generous gift of plasmids and Stefano Giulitti for synthesis of polyacrylamide hydrogels. GS is recipient of an AIRC (Associazione Italiana Ricerca per il Cancro) “Hard Rock Cafè” Fellowship. Work in the Dupont laboratory is supported by grants from AIRC IG15307, WCR 15‐1192, CARIPARO Eccellenza 2017, University of Padua BIRD to SD, AIRC Special Program Molecular Clinical Oncology “5 per mille” 10016 to SB, and AIRC IG15818 to CR.
The EMBO Journal (2018) 37: e97780
References
- Adorno M, Cordenonsi M, Montagner M, Dupont S, Wong C, Hann B, Solari A, Bobisse S, Rondina MB, Guzzardo V, Parenti AR, Rosato A, Bicciato S, Balmain A, Piccolo S (2009) A Mutant‐p53/Smad complex opposes p63 to empower TGFbeta‐induced metastasis. Cell 137: 87–98 [DOI] [PubMed] [Google Scholar]
- Aird KM, Zhang G, Li H, Tu Z, Bitler BG, Garipov A, Wu H, Wei Z, Wagner SN, Herlyn M, Zhang R (2013) Suppression of nucleotide metabolism underlies the establishment and maintenance of oncogene‐induced senescence. Cell Rep 3: 1252–1265 [DOI] [PMC free article] [PubMed] [Google Scholar]
- Aragona M, Panciera T, Manfrin A, Giulitti S, Michielin F, Elvassore N, Dupont S, Piccolo S (2013) A mechanical checkpoint controls multicellular growth through YAP/TAZ regulation by actin‐processing factors. Cell 154: 1047–1059 [DOI] [PubMed] [Google Scholar]
- Aye Y, Li M, Long MJC, Weiss RS (2015) Ribonucleotide reductase and cancer: biological mechanisms and targeted therapies. Oncogene 34: 2011–2021 [DOI] [PubMed] [Google Scholar]
- Azzolin L, Panciera T, Soligo S, Enzo E, Bicciato S, Dupont S, Bresolin S, Frasson C, Basso G, Guzzardo V, Fassina A, Cordenonsi M, Piccolo S (2014) YAP/TAZ incorporation in the β‐catenin destruction complex orchestrates the Wnt response. Cell 158: 157–170 [DOI] [PubMed] [Google Scholar]
- Camargo FD, Gokhale S, Johnnidis JB, Fu D, Bell GW, Jaenisch R, Brummelkamp TR (2007) YAP1 increases organ size and expands undifferentiated progenitor cells. Curr Biol 17: 2054–2060 [DOI] [PubMed] [Google Scholar]
- Campisi J, d'Adda di Fagagna F (2007) Cellular senescence: when bad things happen to good cells. Nat Rev Mol Cell Biol 8: 729–740 [DOI] [PubMed] [Google Scholar]
- Campisi J (2013) Aging, cellular senescence, and cancer. Annu Rev Physiol 75: 685–705 [DOI] [PMC free article] [PubMed] [Google Scholar]
- Chang Z, Ju H, Ling J, Zhuang Z, Li Z, Wang H, Fleming JB, Freeman JW, Yu D, Huang P, Chiao PJ (2014) Cooperativity of oncogenic K‐ras and downregulated p16/INK4A in human pancreatic tumorigenesis. PLoS One 9: e101452 [DOI] [PMC free article] [PubMed] [Google Scholar]
- Collado M, Gil J, Efeyan A, Guerra C, Schuhmacher AJ, Barradas M, Benguría A, Zaballos A, Flores JM, Barbacid M, Beach D, Serrano M (2005) Tumour biology: senescence in premalignant tumours. Nature 436: 642 [DOI] [PubMed] [Google Scholar]
- Cordenonsi M, Zanconato F, Azzolin L, Forcato M, Rosato A, Frasson C, Inui M, Montagner M, Parenti AR, Poletti A, Daidone MG, Dupont S, Basso G, Bicciato S, Piccolo S (2011) The Hippo transducer TAZ confers cancer stem cell‐related traits on breast cancer cells. Cell 147: 759–772 [DOI] [PubMed] [Google Scholar]
- Cox AG, Hwang KL, Brown KK, Evason KJ, Beltz S, Tsomides A, O'Connor K, Galli GG, Yimlamai D, Chhangawala S, Yuan M, Lien EC, Wucherpfennig J, Nissim S, Minami A, Cohen DE, Camargo FD, Asara JM, Houvras Y, Stainier DYR et al (2016) Yap reprograms glutamine metabolism to increase nucleotide biosynthesis and enable liver growth. Nat Cell Biol 18: 886–896 [DOI] [PMC free article] [PubMed] [Google Scholar]
- Croci O, De Fazio S, Biagioni F, Donato E, Caganova M, Curti L, Doni M, Sberna S, Aldeghi D, Biancotto C, Verrecchia A, Olivero D, Amati B, Campaner S (2017) Transcriptional integration of mitogenic and mechanical signals by Myc and YAP. Genes Dev 31: 2017–2022 [DOI] [PMC free article] [PubMed] [Google Scholar]
- Das M, Jiang F, Sluss HK, Zhang C, Shokat KM, Flavell RA, Davis RJ (2007) Suppression of p53‐dependent senescence by the JNK signal transduction pathway. Proc Natl Acad Sci USA 104: 15759–15764 [DOI] [PMC free article] [PubMed] [Google Scholar]
- Debnath J, Muthuswamy SK, Brugge JS (2003) Morphogenesis and oncogenesis of MCF‐10A mammary epithelial acini grown in three‐dimensional basement membrane cultures. Methods 30: 256–268 [DOI] [PubMed] [Google Scholar]
- Dimri GP, Lee X, Basile G, Acosta M, Scott G, Roskelley C, Medrano EE, Linskens M, Rubelj I, Pereira‐Smith O (1995) A biomarker that identifies senescent human cells in culture and in aging skin in vivo . Proc Natl Acad Sci USA 92: 9363–9367 [DOI] [PMC free article] [PubMed] [Google Scholar]
- Dupont S, Mamidi A, Cordenonsi M, Montagner M, Zacchigna L, Adorno M, Martello G, Stinchfield MJ, Soligo S, Morsut L, Inui M, Moro S, Modena N, Argenton F, Newfeld SJ, Piccolo S (2009) FAM/USP9x, a deubiquitinating enzyme essential for TGFbeta signaling, controls Smad4 monoubiquitination. Cell 136: 123–135 [DOI] [PubMed] [Google Scholar]
- Dupont S, Morsut L, Aragona M, Enzo E, Giulitti S, Cordenonsi M, Zanconato F, Le Digabel J, Forcato M, Bicciato S, Elvassore N, Piccolo S (2011) Role of YAP/TAZ in mechanotransduction. Nature 474: 179–183 [DOI] [PubMed] [Google Scholar]
- Dupont S (2016) Role of YAP/TAZ in cell‐matrix adhesion‐mediated signalling and mechanotransduction. Exp Cell Res 343: 42–53 [DOI] [PubMed] [Google Scholar]
- Enzo E, Santinon G, Pocaterra A, Aragona M, Bresolin S, Forcato M, Grifoni D, Pession A, Zanconato F, Guzzo G, Bicciato S, Dupont S (2015) Aerobic glycolysis tunes YAP/TAZ transcriptional activity. EMBO J 34: 1349–1370 [DOI] [PMC free article] [PubMed] [Google Scholar]
- Ferraro P, Franzolin E, Pontarin G, Reichard P, Bianchi V (2010) Quantitation of cellular deoxynucleoside triphosphates. Nucleic Acids Res 38: e85 [DOI] [PMC free article] [PubMed] [Google Scholar]
- Fitamant J, Kottakis F, Benhamouche S, Tian HS, Chuvin N, Parachoniak CA, Nagle JM, Perera RM, Lapouge M, Deshpande V, Zhu AX, Lai A, Min B, Hoshida Y, Avruch J, Sia D, Campreciós G, McClatchey AI, Llovet JM, Morrissey D et al (2015) YAP inhibition restores hepatocyte differentiation in advanced HCC, Leading to tumor regression. Cell Rep 10: 1692–1707 [DOI] [PMC free article] [PubMed] [Google Scholar]
- Fujiki H, Suganuma M, Yoshizawa S, Kanazawa H, Sugimura T, Manam S, Kahn SM, Jiang W, Hoshina S, Weinstein IB (1989) Codon 61 mutations in the c‐Harvey‐ras gene in mouse skin tumors induced by 7,12‐dimethylbenz[a]anthracene plus okadaic acid class tumor promoters. Mol Carcinog 2: 184–187 [DOI] [PubMed] [Google Scholar]
- Gilbert PM, Havenstrite KL, Magnusson KEG, Sacco A, Leonardi NA, Kraft P, Nguyen NK, Thrun S, Lutolf MP, Blau HM (2010) Substrate elasticity regulates skeletal muscle stem cell self‐renewal in culture. Science 329: 1078–1081 [DOI] [PMC free article] [PubMed] [Google Scholar]
- Gjorevski N, Sachs N, Manfrin A, Giger S, Bragina ME, Ordóñez‐Morán P, Clevers H, Lutolf MP (2016) Designer matrices for intestinal stem cell and organoid culture. Nature 539: 560–564 [DOI] [PubMed] [Google Scholar]
- Halder G, Johnson RL (2011) Hippo signaling: growth control and beyond. Development 138: 9–22 [DOI] [PMC free article] [PubMed] [Google Scholar]
- Hamaratoglu F, Willecke M, Kango‐Singh M, Nolo R, Hyun E, Tao C, Jafar‐Nejad H, Halder G (2006) The tumour‐suppressor genes NF2/Merlin and Expanded act through Hippo signalling to regulate cell proliferation and apoptosis. Nat Cell Biol 8: 27–36 [DOI] [PubMed] [Google Scholar]
- Hayashi Y, Hsiao EC, Sami S, Lancero M, Schlieve CR, Nguyen T, Yano K, Nagahashi A, Ikeya M, Matsumoto Y, Nishimura K, Fukuda A, Hisatake K, Tomoda K, Asaka I, Toguchida J, Conklin BR, Yamanaka S (2016) BMP‐SMAD‐ID promotes reprogramming to pluripotency by inhibiting p16/INK4A‐dependent senescence. Proc Natl Acad Sci USA 113: 13057–13062 [DOI] [PMC free article] [PubMed] [Google Scholar]
- Hsieh AL, Walton ZE, Altman BJ, Stine ZE, Dang CV (2015) MYC and metabolism on the path to cancer. Semin Cell Dev Biol 43: 11–21 [DOI] [PMC free article] [PubMed] [Google Scholar]
- Jang W, Kim T, Koo JS, Kim SK, Lim D‐S (2017) Mechanical cue‐induced YAP instructs Skp2‐dependent cell cycle exit and oncogenic signaling. EMBO J 36: 2510–2528 [DOI] [PMC free article] [PubMed] [Google Scholar]
- Jin JY, Ke H, Hall RP, Zhang JY (2011) c‐Jun promotes whereas JunB inhibits epidermal neoplasia. J Invest Dermatol 131: 1149–1158 [DOI] [PMC free article] [PubMed] [Google Scholar]
- Kansara M, Leong HS, Lin DM, Popkiss S, Pang P, Garsed DW, Walkley CR, Cullinane C, Ellul J, Haynes NM, Hicks R, Kuijjer ML, Cleton‐Jansen A‐M, Hinds PW, Smyth MJ, Thomas DM (2013) Immune response to RB1‐regulated senescence limits radiation‐induced osteosarcoma formation. J Clin Invest 123: 5351–5360 [DOI] [PMC free article] [PubMed] [Google Scholar]
- Kapoor A, Yao W, Ying H, Hua S, Liewen A, Wang Q, Zhong Y, Wu C‐J, Sadanandam A, Hu B, Chang Q, Chu GC, Al‐Khalil R, Jiang S, Xia H, Fletcher‐Sananikone E, Lim C, Horwitz GI, Viale A, Pettazzoni P et al (2014) Yap1 activation enables bypass of oncogenic Kras addiction in pancreatic cancer. Cell 158: 185–197 [DOI] [PMC free article] [PubMed] [Google Scholar]
- Kim M, Kim M, Lee S, Kuninaka S, Saya H, Lee H, Lee S, Lim D‐S (2013) cAMP/PKA signalling reinforces the LATS‐YAP pathway to fully suppress YAP in response to actin cytoskeletal changes. EMBO J 32: 1543–1555 [DOI] [PMC free article] [PubMed] [Google Scholar]
- Kim M, Kim T, Johnson RL, Lim D‐S (2015) Transcriptional co‐repressor function of the Hippo pathway transducers YAP and TAZ. Cell Rep 11: 270–282 [DOI] [PubMed] [Google Scholar]
- Kollareddy M, Dimitrova E, Vallabhaneni KC, Chan A, Le T, Chauhan KM, Carrero ZI, Ramakrishnan G, Watabe K, Haupt Y, Haupt S, Pochampally R, Boss GR, Romero DG, Radu CG, Martinez LA (2015) Regulation of nucleotide metabolism by mutant p53 contributes to its gain‐of‐function activities. Nat Commun 6: 7389 [DOI] [PMC free article] [PubMed] [Google Scholar]
- Kuleshov MV, Jones MR, Rouillard AD, Fernandez NF, Duan Q, Wang Z, Koplev S, Jenkins SL, Jagodnik KM, Lachmann A, McDermott MG, Monteiro CD, Gundersen GW, Ma'ayan A (2016) Enrichr: a comprehensive gene set enrichment analysis web server 2016 update. Nucleic Acids Res 44: W90–W97 [DOI] [PMC free article] [PubMed] [Google Scholar]
- Li W, Cooper J, Zhou L, Yang C, Erdjument‐Bromage H, Zagzag D, Snuderl M, Ladanyi M, Hanemann CO, Zhou P, Karajannis MA, Giancotti FG (2014) Merlin/NF2 loss‐driven tumorigenesis linked to CRL4DCAF1‐mediated inhibition of the hippo pathway kinases lats1 and 2 in the nucleus. Cancer Cell 26: 48–60 [DOI] [PMC free article] [PubMed] [Google Scholar]
- Lin AW, Barradas M, Stone JC, van Aelst L, Serrano M, Lowe SW (1998) Premature senescence involving p53 and p16 is activated in response to constitutive MEK/MAPK mitogenic signaling. Genes Dev 12: 3008–3019 [DOI] [PMC free article] [PubMed] [Google Scholar]
- Mannava S, Moparthy KC, Wheeler LJ, Natarajan V, Zucker SN, Fink EE, Im M, Flanagan S, Burhans WC, Zeitouni NC, Shewach DS, Mathews CK, Nikiforov MA (2013) Depletion of deoxyribonucleotide pools is an endogenous source of DNA damage in cells undergoing oncogene‐induced senescence. Am J Pathol 182: 142–151 [DOI] [PMC free article] [PubMed] [Google Scholar]
- McCreery MQ, Halliwill KD, Chin D, Delrosario R, Hirst G, Vuong P, Jen K‐Y, Hewinson J, Adams DJ, Balmain A (2015) Evolution of metastasis revealed by mutational landscapes of chemically induced skin cancers. Nat Med 21: 1514–1520 [DOI] [PMC free article] [PubMed] [Google Scholar]
- Moiseeva O, Deschênes Simard X, St Germain E, Igelmann S, Huot G, Cadar AE, Bourdeau V, Pollak MN, Ferbeyre G (2013) Metformin inhibits the senescence‐associated secretory phenotype by interfering with IKK/NF‐κB activation. Aging Cell 12: 489–498 [DOI] [PubMed] [Google Scholar]
- Mori M, Triboulet R, Mohseni M, Schlegelmilch K, Shrestha K, Camargo FD, Gregory RI (2014) Hippo signaling regulates microprocessor and links cell‐density‐dependent miRNA biogenesis to cancer. Cell 156: 893–906 [DOI] [PMC free article] [PubMed] [Google Scholar]
- Moya IM, Halder G (2016) The Hippo pathway in cellular reprogramming and regeneration of different organs. Curr Opin Cell Biol 43: 62–68 [DOI] [PubMed] [Google Scholar]
- Noguchi S, Saito A, Mikami Y, Urushiyama H, Horie M, Matsuzaki H, Takeshima H, Makita K, Miyashita N, Mitani A, Jo T, Yamauchi Y, Terasaki Y, Nagase T (2017) TAZ contributes to pulmonary fibrosis by activating profibrotic functions of lung fibroblasts. Sci Rep 7: 42595 [DOI] [PMC free article] [PubMed] [Google Scholar]
- Nowell CS, Odermatt PD, Azzolin L, Hohnel S, Wagner EF, Fantner GE, Lutolf MP, Barrandon Y, Piccolo S, Radtke F (2016) Chronic inflammation imposes aberrant cell fate in regenerating epithelia through mechanotransduction. Nat Cell Biol 18: 168–180 [DOI] [PMC free article] [PubMed] [Google Scholar]
- Panciera T, Azzolin L, Fujimura A, Di Biagio D, Frasson C, Bresolin S, Soligo S, Basso G, Bicciato S, Rosato A, Cordenonsi M, Piccolo S (2016) Induction of expandable tissue‐specific stem/progenitor cells through transient expression of YAP/TAZ. Cell Stem Cell 19: 725–737 [DOI] [PMC free article] [PubMed] [Google Scholar]
- Passegué E, Wagner EF (2000) JunB suppresses cell proliferation by transcriptional activation of p16(INK4a) expression. EMBO J 19: 2969–2979 [DOI] [PMC free article] [PubMed] [Google Scholar]
- Pawlikowski JS, McBryan T, van Tuyn J, Drotar ME, Hewitt RN, Maier AB, King A, Blyth K, Wu H, Adams PD (2013) Wnt signaling potentiates nevogenesis. Proc Natl Acad Sci USA 110: 16009–16014 [DOI] [PMC free article] [PubMed] [Google Scholar]
- Piccolo S, Dupont S, Cordenonsi M (2014) The biology of YAP/TAZ: hippo signaling and beyond. Physiol Rev 94: 1287–1312 [DOI] [PubMed] [Google Scholar]
- Prieur A, Peeper DS (2008) Cellular senescence in vivo: a barrier to tumorigenesis. Curr Opin Cell Biol 20: 150–155 [DOI] [PubMed] [Google Scholar]
- Rajagopalan S, Long EO (2012) Cellular senescence induced by CD158d reprograms natural killer cells to promote vascular remodeling. Proc Natl Acad Sci USA 109: 20596–20601 [DOI] [PMC free article] [PubMed] [Google Scholar]
- Ramos A, Camargo FD (2012) The Hippo signaling pathway and stem cell biology. Trends Cell Biol 22: 339–346 [DOI] [PMC free article] [PubMed] [Google Scholar]
- Rampazzo C, Miazzi C, Franzolin E, Pontarin G, Ferraro P, Frangini M, Reichard P, Bianchi V (2010) Regulation by degradation, a cellular defense against deoxyribonucleotide pool imbalances. Mutat Res 703: 2–10 [DOI] [PubMed] [Google Scholar]
- Sakaue‐Sawano A, Kurokawa H, Morimura T, Hanyu A, Hama H, Osawa H, Kashiwagi S, Fukami K, Miyata T, Miyoshi H, Imamura T, Ogawa M, Masai H, Miyawaki A (2008) Visualizing spatiotemporal dynamics of multicellular cell‐cycle progression. Cell 132: 487–498 [DOI] [PubMed] [Google Scholar]
- Santinon G, Pocaterra A, Dupont S (2015) Control of YAP/TAZ activity by metabolic and nutrient‐sensing pathways. Trends Cell Biol 26: 289–299 [DOI] [PubMed] [Google Scholar]
- Shao DD, Xue W, Krall EB, Bhutkar A, Piccioni F, Wang X, Schinzel AC, Sood S, Rosenbluh J, Kim JW, Zwang Y, Roberts TM, Root DE, Jacks T, Hahn WC (2014) KRAS and YAP1 converge to regulate EMT and tumor survival. Cell 158: 171–184 [DOI] [PMC free article] [PubMed] [Google Scholar]
- Soria‐Valles C, Osorio FG, Gutiérrez‐Fernández A, De Los Angeles A, Bueno C, Menéndez P, Martín‐Subero JI, Daley GQ, Freije JMP, López‐Otín C (2015) NF‐κB activation impairs somatic cell reprogramming in ageing. Nat Cell Biol 17: 1004–1013 [DOI] [PubMed] [Google Scholar]
- Taccioli C, Sorrentino G, Zannini A, Caroli J, Beneventano D, Anderlucci L, Lolli M, Bicciato S, Del Sal G (2015) MDP, a database linking drug response data to genomic information, identifies dasatinib and statins as a combinatorial strategy to inhibit YAP/TAZ in cancer cells. Oncotarget 6: 38854–38865 [DOI] [PMC free article] [PubMed] [Google Scholar]
- Takebayashi S‐I, Tanaka H, Hino S, Nakatsu Y, Igata T, Sakamoto A, Narita M, Nakao M (2015) Retinoblastoma protein promotes oxidative phosphorylation through upregulation of glycolytic genes in oncogene‐induced senescent cells. Aging Cell 14: 689–697 [DOI] [PMC free article] [PubMed] [Google Scholar]
- Utikal J, Polo JM, Stadtfeld M, Maherali N, Kulalert W, Walsh RM, Khalil A, Rheinwald JG, Hochedlinger K (2009) Immortalization eliminates a roadblock during cellular reprogramming into iPS cells. Nature 460: 1145–1148 [DOI] [PMC free article] [PubMed] [Google Scholar]
- Vander Heiden MG (2011) Targeting cancer metabolism: a therapeutic window opens. Nat Rev Drug Discov 10: 671–684 [DOI] [PubMed] [Google Scholar]
- Wada K‐I, Itoga K, Okano T, Yonemura S, Sasaki H (2011) Hippo pathway regulation by cell morphology and stress fibers. Development 138: 3907–3914 [DOI] [PubMed] [Google Scholar]
- Wang W, Chen JX, Liao R, Deng Q, Zhou JJ, Huang S, Sun P (2002) Sequential activation of the MEK‐extracellular signal‐regulated kinase and MKK3/6‐p38 mitogen‐activated protein kinase pathways mediates oncogenic ras‐induced premature senescence. Mol Cell Biol 22: 3389–3403 [DOI] [PMC free article] [PubMed] [Google Scholar]
- Wiley CD, Campisi J (2016) From ancient pathways to aging cells‐connecting metabolism and cellular senescence. Cell Metab 23: 1013–1021 [DOI] [PMC free article] [PubMed] [Google Scholar]
- Yimlamai D, Christodoulou C, Galli GG, Yanger K, Pepe‐Mooney B, Gurung B, Shrestha K, Cahan P, Stanger BZ, Camargo FD (2014) Hippo pathway activity influences liver cell fate. Cell 157: 1324–1338 [DOI] [PMC free article] [PubMed] [Google Scholar]
- Young ARJ, Narita M, Ferreira M, Kirschner K, Sadaie M, Darot JFJ, Tavare S, Arakawa S, Shimizu S, Watt FM, Narita M (2009) Autophagy mediates the mitotic senescence transition. Genes Dev 23: 798–803 [DOI] [PMC free article] [PubMed] [Google Scholar]
- Zanconato F, Forcato M, Battilana G, Azzolin L, Quaranta E, Bodega B, Rosato A, Bicciato S, Cordenonsi M, Piccolo S (2015) Genome‐wide association between YAP/TAZ/TEAD and AP‐1 at enhancers drives oncogenic growth. Nat Cell Biol 17: 1218–1227 [DOI] [PMC free article] [PubMed] [Google Scholar]
- Zanconato F, Cordenonsi M, Piccolo S (2016) YAP/TAZ at the roots of cancer. Cancer Cell 29: 783–803 [DOI] [PMC free article] [PubMed] [Google Scholar]
- Zhang W, Nandakumar N, Shi Y, Manzano M, Smith A, Graham G, Gupta S, Vietsch EE, Laughlin SZ, Wadhwa M, Chetram M, Joshi M, Wang F, Kallakury B, Toretsky J, Wellstein A, Yi C (2014) Downstream of mutant KRAS, the transcription regulator YAP is essential for neoplastic progression to pancreatic ductal adenocarcinoma. Sci Signal 7: ra42 [DOI] [PMC free article] [PubMed] [Google Scholar]
- Zhao B, Li L, Wang L, Wang C‐Y, Yu J, Guan K‐L (2012) Cell detachment activates the Hippo pathway via cytoskeleton reorganization to induce anoikis. Genes Dev 26: 54–68 [DOI] [PMC free article] [PubMed] [Google Scholar]
Associated Data
This section collects any data citations, data availability statements, or supplementary materials included in this article.
Supplementary Materials
Expanded View Figures PDF
Table EV1
Table EV2
Review Process File
Data Availability Statement
Data obtained during this study are available within the article and from the corresponding author upon reasonable request. All microarray data are available: GSE49384, GSE56157, GSE65665, GSE55560, GSE5720, GSE32474, GSE59522, GSE60652, GSE2487, GSE46801, GSE63967, GSE59232.


