

Abstract
Rodent and cell‐culture models support a role for iron‐related adipokine dysregulation and insulin resistance in the pathogenesis of nonalcoholic fatty liver disease (NAFLD); however, substantial human data are lacking. We examined the relationship between measures of iron status, adipokines, and insulin resistance in patients with NAFLD in the presence and absence of venesection. This study forms part of the Impact of Iron on Insulin Resistance and Liver Histology in Nonalcoholic Steatohepatitis (IIRON2) study, a prospective randomized controlled trial of venesection for adults with NAFLD. Paired serum samples at baseline and 6 months (end of treatment) in controls (n = 28) and patients who had venesection (n = 23) were assayed for adiponectin, leptin, resistin, retinol binding protein‐4, tumor necrosis factor α, and interleukin‐6, using a Quantibody, customized, multiplexed enzyme‐linked immunosorbent assay array. Hepatic iron concentration (HIC) was determined using MR FerriScan. Unexpectedly, analysis revealed a significant positive correlation between baseline serum adiponectin concentration and HIC, which strengthened after correction for age, sex, and body mass index (rho = 0.36; P = 0.007). In addition, there were significant inverse correlations between HIC and measures of insulin resistance (adipose tissue insulin resistance (Adipo‐IR), serum insulin, serum glucose, homeostasis model assessment of insulin resistance, hemoglobin A1c, and hepatic steatosis), whereas a positive correlation was noted with the insulin sensitivity index. Changes in serum adipokines over 6 months did not differ between the control and venesection groups. Conclusion: HIC positively correlates with serum adiponectin and insulin sensitivity in patients with NAFLD. Further study is required to establish causality and mechanistic explanations for these associations and their relevance in the pathogenesis of insulin resistance and NAFLD. (Hepatology Communications 2018;2:644‐653)
Abbreviations
- Adipo‐IR
adipose tissue insulin resistance
- BMI
body mass index
- ELISA
enzyme‐linked immunosorbent assay
- HbA1C
hemoglobin A1c
- HIC
hepatic iron concentration
- HOMA‐IR
homeostatic model assessment of insulin resistance
- IL‐6
interleukin‐6
- ISI
insulin sensitivity index
- MRI
magnetic resonance imaging
- NAFLD
nonalcoholic fatty liver disease
- RBP‐4
retinol binding protein‐4
- TNFα
tumor necrosis factor alpha
The epidemic of obesity in both the developed and developing world has led to a major rise in the prevalence of nonalcoholic fatty liver disease (NAFLD). NAFLD is estimated to be present in 20%‐30% of the adult population.1 Nonalcoholic steatohepatitis, the aggressive form of NAFLD, predisposes individuals toward liver failure and hepatocellular carcinoma.2 Furthermore, NAFLD has been shown to be an independent risk factor for cardiovascular disease and type II diabetes.3
Unfortunately, currently available treatment options for NAFLD are largely ineffective, and novel therapeutic targets are urgently needed for this disease. Iron has long been considered to have a role in the pathogenesis of NAFLD and insulin resistance, a hallmark feature of NAFLD.4, 5, 6 Therefore, iron has been considered as a potential therapeutic target in NAFLD and type 2 diabetes mellitus.5, 6
In recent years, there has been considerable interest in the role of iron in adipose tissue biology and the regulation of adipokines.5, 7 Adipokines are defined as “polypeptides that are secreted in the adipose tissue in a regulated manner.”8 Many of these adipokines have endocrine effects on the liver as well as local effects on adipose tissue.8 Altered adipose tissue biology and dysregulation of adipokine synthesis may promote liver injury by increased insulin resistance and also by other direct and indirect effects on hepatic and adipose tissue lipid metabolism.8 Studies in animals and tissue culture models have demonstrated an iron‐induced dysregulation of the synthesis of three adipokines with such roles, namely adiponectin, leptin, and resistin.9, 10, 11
Adiponectin is the most abundant adipokine in serum and has a number of hepatoprotective effects in NAFLD.7, 8 Iron has been shown to down‐regulate adiponectin in a rodent model of selective adipocyte iron loading and also in cultured 3T3‐L1 pre‐adipocytes through decreased acetylation of the transcription factor forkhead box protein O1 (FOX01).9 More recently, it has been demonstrated that iron down‐regulates the appetite‐suppressing hormone leptin in mice fed a high iron diet through iron‐dependent activation of cyclic adenosine monophosphate responsive element‐binding protein.10 Two other adipokines, resistin and retinol binding protein‐4 (RBP‐4), have been associated with insulin resistance,8 and iron has been proposed as a regulator of serum concentrations of both these hormones.11, 12 Tumor necrosis factor α (TNFα) and interleukin‐6 (IL‐6) are cytokines secreted from adipose tissue as adipokines as well as from other tissues.8 Both have important roles in the induction of insulin resistance in NAFLD and type II diabetes,8, 13, 14 and iron has been shown in cell culture studies to promote a proinflammatory phenotype in macrophages.15
To date, studies regarding iron and the regulation of adipokines in humans are relatively sparse. Recently, a randomized controlled trial of 274 adults with dysmetabolic iron overload syndrome showed that venesection did not affect serum adiponectin levels; however, other adipokines were not assessed.16 Venesection in a cohort of 6 patients with type 2 diabetes led to a reduction in serum levels of RBP‐4.12
At present, therefore, there is a clear need for more comprehensive human data to determine whether the iron–adipokine interactions observed in animal studies might translate to humans. We hypothesized that iron is a key determinant in the regulation of insulin sensitivity and a number of adipokines relevant to NAFLD pathogenesis. To investigate these relationships further, we analyzed the relationships between hepatic iron concentration and serum ferritin with markers of insulin resistance and serum concentrations of six target adipokines. We also assessed the effect of iron removal by venesection on serum levels of these adipokines.
The Impact of Iron on Insulin Resistance and Liver Histology in Nonalcoholic Steatohepatitis (IIRON2) study is a multicenter, prospective, randomized, controlled trial evaluating the effect of venesection on liver injury in adults with NAFLD.17 As a component of this larger study, this report describes the relationships between baseline iron loading and measures of insulin resistance as well as the effect of venesection plus lifestyle advice versus lifestyle advice alone on serum concentrations of adiponectin, leptin, resistin, RBP‐4, TNFα, and IL‐6.
Patients and Methods
PARTICIPANTS
Subjects were recruited from hepatology clinics at the Sir Charles Gairdner and Fremantle Hospitals in Western Australia and Greenslopes Private Hospital, Queensland, between November 2010 and December 2012 by the physicians involved in the study (L.A., J.O., D.C., and K.S.).17 Subjects were adults with hepatic steatosis evident on ultrasonography or computed tomography scan and serum ferritin >50 ng/mL. Exclusion criteria included the presence of a human factors engineering‐hemochromatosis genotype (C282Y/C282Y or C282Y/H63D), liver disease other than NAFLD, ischemic heart disease, uncontrolled diabetes (hemoglobin A1c [HbA1C] >8.0%), or evidence of decompensated liver disease. Detailed inclusion and exclusion criteria have been described.17 The current study also excluded those screened with hemochromatosis‐range hepatic iron concentration (HIC) (greater than 2 times the upper limit of normal) in order to avoid bias in parametric correlation analyses. The IIRON2 study was registered with the Australia New Zealand Clinical Trials Registry (Registration no. https://www.anzctr.org.au/Trial/Registration/TrialReview.aspx?id=335881). This registration included an a priori assessment of serum adipokine levels as a secondary endpoint (secondary endpoint 4). Written informed consent was obtained from all participants. The study protocol conforms to the ethical guidelines of the 1975 Declaration of Helsinki and was approved by the human research ethics committees of the Sir Charles Gairdner, Fremantle, and Greenslopes Private hospital.
RANDOMIZATION
Participants were randomized, using a randomization sequence generated by the study research coordinator from a computerized random number generator, to venesection with lifestyle advice (venesection group) or lifestyle advice alone (control group) at a ratio of 1:1 as described.17 Allocation concealment prior to randomization was achieved using numbered, sealed, opaque envelopes. Assignment was performed by the research coordinators. All subjects received dietary advice regarding the institution of a hypocaloric diet from an accredited dietician, and all received standardized advice regarding exercise. Participants in the venesection group underwent two to three weekly venesections targeting a serum ferritin of <45 ng/mL.
CLINICAL AND LABORATORY ASSESSMENT
A thorough clinical assessment, including history and physical examination, was performed at baseline, 3 months, and 6 months (end of study). Standard laboratory parameters were measured, including liver function tests, serum triglycerides, high‐density lipoprotein cholesterol, free (nonesterified) fatty acids, glucose, insulin, glycosylated hemoglobin (HbA1C), 75‐g oral glucose tolerance test, transferrin saturation, serum ferritin, and full blood count. Hepascore, a validated serum measure of hepatic fibrosis in NAFLD,18 was performed at the Western Australia state referral laboratory (Pathwest, Queen Elizabeth II Medical Center, Nedlands, Australia). Serum cytokeratin‐18 fragments were measured using an m30 Aptosense enzyme‐linked immunosorbent assay (ELISA) kit (Peviva, Nacka, Sweden).
Serum concentrations of adiponectin, leptin, resistin, RBP‐4, TNFα, and IL‐6 were measured using a customized, multiplexed, Quantibody, ELISA array (Human Obesity Array Q3; Raybiotech, Norcross, GA). Assays of participant serum samples at 1:2 dilution and adipokine control dilutions for a standard curve were performed in quadruplicate by Jomar Life Research, Scoresby, Australia, according to the manufacturer's instructions. Hepcidin‐25 was isolated from patient serum by solid phase extraction and measured by liquid chromatography quadrupole time‐of‐flight mass spectrometry as described.19, 20, 21 Quantitation was by reference to a synthetic hepcidin‐25 (13C18,15N3) peptide internal standard (Peptides International, Inc., Louisville, KY).
IMAGING STUDIES
Hepatic steatosis and HIC were measured using noninvasive magnetic resonance imaging (MRI) methods on a 1.5T Avanto scanner (Siemens Medical Systems, Erlagen, Germany). Hepatic steatosis was quantified as a volumetric percentage by using a validated opposed‐phase–in‐phase gradient echo protocol.22 A validated MRI method (FerriScan) was used to determine HIC.23
STATISTICAL ANALYSIS
Comparison of baseline variables between groups was performed using the two‐tailed Student t test for continuous variables and Pearson's chi‐squared or Fisher's exact test, as appropriate, for categorical variables. Baseline correlation analyses were performed using Pearson's correlation. As the dependency between adipokines and measures of iron is unknown, bivariate correlation analysis was used to detect associations. The relationships between serum adipokine concentrations, measures of insulin resistance, serum ferritin, and HIC, after correction for body mass index (BMI), age, and sex, were assessed using a partial correlation analysis. The relationships between serum hepcidin and surrogates of insulin resistance were assessed using a partial correlation analysis correcting for HIC.
For each of the six adipokines, comparisons between the venesection and control groups of the change of serum concentration were made using a two‐sided independent‐sample t test. Further analysis of these data was performed using analysis of covariance with correction for BMI, age, and sex.
Results
PARTICIPANT CHARACTERISTICS
Seventy‐four participants were randomized in the study.17 This cohort was used to analyze baseline relationships of measures of insulin resistance and serum adipokines with measures of iron status. The characteristics of this cohort are summarized in Table 1. Of these, 60 patients had serum stored at baseline available for measurement of serum adipokine concentrations, and 51 also had serum available from the end of the study; this latter cohort was used in the analysis comparing the effect of venesection (n = 23) versus control (n = 28), as shown in Fig. 1. The baseline characteristics of the participants from each randomized group with available paired sera are outlined in Table 2. Baseline characteristics, including serum adipokine concentrations, were not significantly different between groups.
Table 1.
Baseline Characteristics of Randomized Participants
| Characteristic (n = 73) | Mean (SD) |
|---|---|
| Age, years | 51.3 (10.8) |
| Male sex (%) | 43 (59%) |
| BMI, kg/m2 | 31.4 (5.0) |
| Waist circumference, cm | 105 (13) |
| Diabetes (%) | 13 (18%) |
| ALT, IU/L | 72 (56) |
| Hepascore | 0.33 (0.26) |
| Glucose, mmol/L | 6.1 (2.1) |
| Serum ferritin, ng/mL | 507 (442) |
| Transferrin saturation, % | 31.6 (13.5) |
| Hepatic iron concentration, mmol/kg | 23.0 (11.3) |
| Hepatic steatosis, % by volume | 18.1 (10.9) |
Data are presented as mean and SD except for diabetes and male sex, for which the total number of participants and percentage of participants are presented. A single randomized participant with hemochromatosis‐range HIC was excluded from the analysis.
Abbreviation: ALT, alanine aminotransferase.
Figure 1.
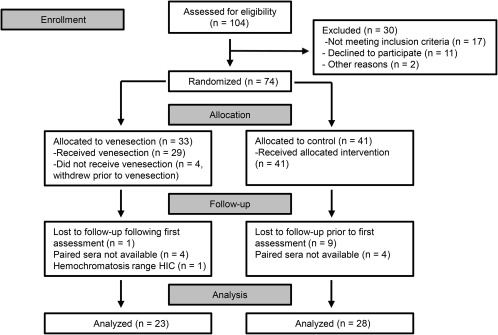
Patient flow diagram for the analysis of venesection effect on serum adipokine concentrations.
Table 2.
Baseline Characteristics of Participants With Available Paired Sera
| Characteristic |
Control Group (n = 28) |
Venesection Group (n = 23) | P Value |
|---|---|---|---|
| Age, years | 51.8 (11.3) | 54.0 (9.7) | 0.45 |
| Male sex | 18 (64%) | 14 (61%) | 0.80† |
| BMI, kg/m2 | 30.9 (5.3) | 31.8 (4.4) | 0.52 |
| Waist circumference, cm | 103.4 (13.9) | 108.5 (11.3) | 0.17 |
| Diabetes | 5 (18%) | 4 (17%) | 1.0* |
| ALT, IU/L | 65.0 (37.7) | 81.6 (74.0) | 0.31 |
| AST, IU/L | 41.8 (20.5) | 47.4 (36.6) | 0.49 |
| Bilirubin, μmol/L | 13.8 (5.5) | 14.0 (6.5) | 0.92 |
| Alkaline phosphatase, IU/L | 84.5 (19.9) | 89.2 (24.8) | 0.45 |
| Albumin, mg/dL | 45.0 (3) | 43.5 (2.6) | 0.054 |
| CK‐18, U/L | 287.2 (286.9) | 367.8 (322.5) | 0.36 |
| Hepascore | 0.29 (0.2) | 0.42 (0.3) | 0.059 |
| Triglycerides, mmol/L | 1.74 (0.9) | 1.63 (0.8) | 0.65 |
| HDL‐cholesterol, mmol/L | 1.16 (0.3) | 1.07 (0.3) | 0.26 |
| Free fatty acids, mmol/L | 0.32 (0.2) | 0.38 (0.2) | 0.28 |
| Glucose, mmol/L | 5.64 (0.8) | 6.16 (2.3) | 0.27 |
| Insulin, mU/L | 15.6 (12) | 14.1 (6.8) | 0.60 |
| HbA1C, % | 5.89 (0.7) | 6.10 (1.2) | 0.46 |
| HOMA‐IR | 4.24 (4.1) | 4.07 (2.9) | 0.86 |
| ISI | 3.44 (3.4) | 3.55 (2.9) | 0.91 |
| Hemoglobin, g/L | 152.7 (13.7) | 149.2 (12.1) | 0.34 |
| Platelet, × 109/dL | 216.7 (33.8) | 231.6 (99.2) | 0.46 |
| Ferritin, ng/mL | 448.1 (388.2) | 587.2 (353.2) | 0.19 |
| Transferrin saturation, % | 31.6 (11.1) | 33.4 (14.0) | 0.63 |
| HIC, mmol/kg | 22.1 (10.2) | 24.6 (12.7) | 0.44 |
| Hepatic steatosis, % | 17.0 (12.7) | 18.0 (8.6) | 0.76 |
| Metabolic syndrome | 17 (61%) | 16 (70%) | 0.57* |
| Adiponectin, ng/mL | 538.4 (249.8) | 471.2 (216.7) | 0.32 |
| Leptin, ng/mL | 19.5 (18.8) | 22.7 (14.2) | 0.50 |
| Resistin, ng/mL | 7.55 (2.6) | 8.01 (2.0) | 0.49 |
| RBP‐4, ng/mL | 42.8 (20.1) | 38.4 (12.7) | 0.37 |
| TNFα, pg/mL | 292.2 (395.4) | 249.2 (336.6) | 0.68 |
| IL‐6, pg/mL | 114.9 (171.4) | 114.2 (136.3) | 0.99 |
Values presented are mean values with SD in parentheses except for diabetes, male sex, and metabolic syndrome, for which the total number of participants and percentage of participants are presented. P values are the result of unpaired t tests unless indicated otherwise. *Exact P value from Fisher's exact test, †Pearson's chi‐squared test.
Abbreviations: ALT, alanine aminotransferase; AST, aspartate aminotransferase; CK‐18, cytokeratin‐18; HDL, high‐density lipoprotein.
CORRELATION OF MEASURES OF IRON LOADING WITH BASELINE SERUM ADIPOKINE CONCENTRATIONS
The 61 participants with available baseline serum were assessed to evaluate the relationships between serum adipokine concentrations with two baseline measures of iron status, serum ferritin and HIC (Table 3). All participants had serum ferritin measured, and HIC was available for 56 of the 60 participants. A single participant with hemochromatosis‐range HIC (99 mmol/kg) was excluded from the analysis. HIC was corrected for steatosis percentage volume as determined by MRI in order to provide a true comparable iron concentration in the aqueous (nonlipid) fraction of the liver. Baseline serum hepcidin data were available for 37 of the randomized participants.
Table 3.
Correlation Between Baseline Serum Ferritin, HIC, and Serum Adipokine Concentrations
| Pearson's Correlation | Partial Correlation, Corrected for Age, Sex, and BMI | ||||
|---|---|---|---|---|---|
|
Ferritin n = 60 |
HIC n = 57 |
Ferritin df = 55 |
HIC df = 52 |
||
| Adiponectin | rho | −0.06 | +0.26 | +0.02 | +0.36 |
| P | 0.67 | 0.048a | 0.90 | 0.007a | |
| Leptin | rho | −0.20 | −0.20 | −0.01 | −0.12 |
| P | 0.13 | 0.13 | 0.92 | 0.38 | |
| Resistin | rho | −0.01 | −0.04 | +0.10 | +0.05 |
| P | 0.93 | 0.77 | 0.46 | 0.73 | |
| RBP‐4 | rho | +0.05 | +0.11 | +0.07 | +0.14 |
| P | 0.68 | 0.44 | 0.60 | 0.31 | |
| TNFα | rho | +0.07 | −0.04 | +0.10 | −0.02 |
| P | 0.58 | 0.79 | 0.45 | 0.90 | |
| IL‐6 | rho | +0.07 | −0.09 | +0.06 | −0.10 |
| P | 0.59 | 0.50 | 0.65 | 0.46 | |
P < 0.05.
Abbreviation: df, degrees of freedom.
Baseline serum ferritin was not associated with serum concentrations of any of the six adipokines. HIC, however, showed a significant positive correlation with serum adiponectin (P = 0.048; rho = +0.26) (Table 2; Fig. 2A) but not with the other five adipokines. BMI correlated with serum leptin concentration (P < 0.0001; rho = 0.585) but not with other adipokines (data not shown). Baseline serum ferritin and HIC were correlated (n = 65; rho = +0.41; P = 0.001).
Figure 2.
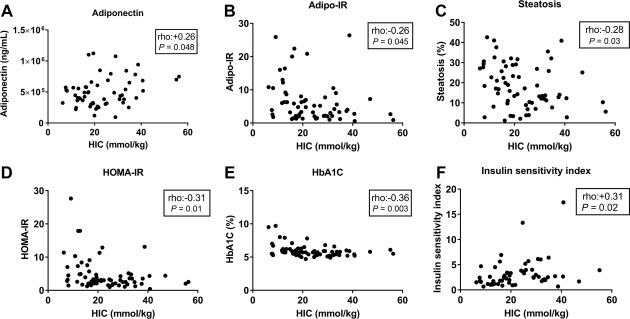
Relationships between HIC and insulin sensitivity. HIC and (A) adiponectin, (B) Adipo‐IR, (C) percentage hepatic steatosis, (D) HOMA‐IR, (E) HbA1C, (F) insulin sensitivity index. Abbreviation: Adipo‐IR, adipose tissue insulin resistance.
Correlation analysis of the baseline data was repeated for all adipokines using partial correlation adjusting for three potential confounders: baseline age, sex, and BMI (Table 3). This correction strengthened the positive relationship between serum adiponectin and HIC (P = 0.007; rho = +0.36). There remained no association between HIC and the other five adipokines. When also corrected for the same factors, there was no significant correlation between serum ferritin and the six adipokines. An analysis of the correlation between adiponectin and HIC in nondiabetics and particularly in diabetics was limited by sample size. In nondiabetics, there was no significant correlation between adiponectin and HIC (n = 49; rho = +0.21; P = 0.15); however, after correction for age, sex, and BMI, a partial correlation remained significant (degrees of freedom = 43; rho = +0.33; P = 0.0496).
CORRELATION OF HIC WITH MEASURES OF INSULIN RESISTANCE
We next sought to determine whether the association between HIC and adiponectin was an isolated finding or whether HIC is associated with measures of insulin resistance. We found that HIC negatively correlated with six surrogates of insulin resistance relating to different sites of insulin action. These were adipose tissue insulin resistance (Adipo‐IR),24 percentage hepatic steatosis, serum insulin, serum glucose, homeostatic model assessment of insulin resistance (HOMA‐IR),25 and HbA1C (Table 4; Fig. 2B‐E). Furthermore, the insulin sensitivity index (ISI)26 was significantly positively correlated with HIC (Table 4; Fig. 2F). After correction for age, sex, and BMI by partial correlation, all associations remained significant except for adipose tissue insulin resistance (Table 4).
Table 4.
Correlation Between HIC and Hepcidin With Measures of Insulin Resistance
|
HIC (Pearson's Correlation) |
HIC (Partial Correlation, Correction for Age, Sex, and BMI) |
Serum Hepcidin (Partial Correlation Corrected for HIC) |
|||||||
|---|---|---|---|---|---|---|---|---|---|
| n | rho | P | df | rho | P | df | rho | P | |
| Adipo‐IR | 62 | −0.26 | 0.045a | 57 | −0.23 | 0.08 | 29 | +0.14 | 0.46 |
| Steatosis (%) | 65 | −0.28 | 0.03a | 60 | −0.28 | 0.03a | 29 | +0.09 | 0.63 |
| Insulin | 65 | −0.26 | 0.04a | 60 | −0.28 | 0.03a | 29 | +0.37 | 0.04a |
| FFAs | 62 | −0.21 | 0.10 | 57 | −0.14 | 0.29 | 29 | −0.34 | 0.06 |
| Glucose | 65 | −0.31 | 0.01a | 60 | −0.26 | 0.04a | 29 | −0.12 | 0.53 |
| HOMA‐IR | 65 | −0.31 | 0.01a | 60 | −0.30 | 0.02a | 29 | +0.30 | 0.10 |
| HbA1C | 64 | −0.36 | 0.003a | 59 | −0.31 | 0.01a | 29 | +0.09 | 0.63 |
| ISI | 59 | +0.30 | 0.02a | 54 | +0.28 | 0.04a | 24 | +0.05 | 0.80 |
P < 0.05
Abbreviations: Adipo‐IR, adipose tissue insulin resistance; df, degrees of freedom; FFA, free fatty acid.
To determine whether insulin might mediate hepcidin response, we analyzed the relationships between hepcidin and the seven surrogates for insulin resistance, using a partial correlation analysis correcting for HIC (Table 4). We found that serum insulin and serum hepcidin levels positively correlated (degrees of freedom = 29; rho = +0.37; P = 0.04). However, there were no significant relationships between serum hepcidin and the other seven surrogates for insulin resistance.
SERUM ADIPOKINE CONCENTRATIONS IN RESPONSE TO VENESECTION
Subjects in the venesection group underwent a median of 7 venesections (range 2‐19). This is roughly equivalent to 1.58 g of iron (range 0.45‐4.28 g).27 Change in BMI during the study did not differ between groups (control group, –0.67 kg/m2 versus venesection group, +0.25 kg/m2; P = 0.08, Student t test). BMI, serum triglycerides, high‐density lipoprotein cholesterol, low‐density lipoprotein cholesterol, HOMA‐IR, and ISI were not significantly different between groups at the end of the study.
Serum adipokine concentrations did not significantly change between baseline and 6 months for each of the six adipokines in each group except for a 69 pg/mL (28%) rise in serum TNFα in the venesection group (P = 0.04). When comparing the difference in absolute change of serum concentration for each adipokine between the control and venesection groups, there were no significant differences (Fig. 3). An analysis of covariance was performed correcting for baseline BMI, age, and sex, and no significant differences between groups were observed for each of the six adipokines (data not shown).
Figure 3.
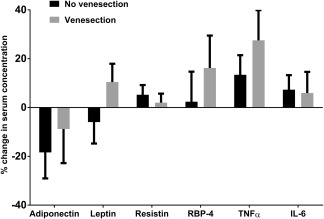
Change in serum adipokine concentrations over 6 months. Mean change is represented as a percentage of the baseline mean for each adipokine. No significant differences were observed for each adipokine between the control (n = 28) and venesection groups (n = 23). Values represented are mean absolute change in serum adipokine concentration with error bars to represent SEM. Measured serum concentrations of TNFα and IL‐6 were below the lower limit of detection of the assays in 11 (of 102) and 23 (of 102) samples, respectively. In these instances, the lower limit of detection value was used for statistical analysis. An analysis in which 0 values were used instead of the lower limit of detection values did not substantially alter the results (data not shown).
Discussion
In this prospective, randomized, controlled clinical trial, we showed that venesection does not alter the serum concentrations of six key adipokines in participants with NAFLD. To our surprise, however, we demonstrated a significant positive relationship between HIC and serum adiponectin concentration in this cohort. This observation was strengthened further after correction for age, sex, and BMI. Furthermore, we showed that HIC negatively correlated with multiple measures of insulin resistance. We looked at eight surrogate measures of insulin resistance and their relationship to iron. In all cases except for free fatty acids, a significant relationship was found associating enhanced insulin sensitivity with increasing HIC. These data suggest that HIC inversely predicts insulin resistance in the periphery (adipose tissue and skeletal muscle) as well as within the liver.
Notably, in keeping with our findings, a cross‐sectional study of 80 Italian patients with biopsy‐proven NAFLD found that the oral glucose sensitivity index increased with increasing HIC.28 Furthermore, a recently published, randomized, controlled study by Laine et al.16 of 274 participants with dysmetabolic iron overload and significantly elevated HIC (>50 mmol/kg) found that venesection was associated with significantly increased serum insulin and HOMA‐IR scores over time. We found no difference between groups in HOMA‐IR scores, ISI, or change in HOMA‐IR or ISI over time.17 This remained the case in subgroup analyses of patients with and without diabetes (data not shown). Although we did not find that venesection altered insulin resistance, the longer duration of venesection (12 months versus 6 months) and higher baseline HIC in the Laine et al. study may account for the change in insulin resistance in that study. It is therefore worth considering that there may be subgroups of patients with NAFLD that may develop altered adipokine concentrations in response to venesection, possibly over a longer duration of treatment.
Our findings add weight to the possibility of a causal relationship between iron and insulin sensitivity in individuals with NAFLD. These results suggest that hepatic iron loading below the hemochromatosis range (less than 2 times the upper limit of normal, normal range 3‐33 mmol/kg29) may actually be beneficial in terms of insulin sensitivity. In contrast, the association between excess hepatic iron seen in hemochromatosis and insulin resistance and diabetes is well established.6 Pathologic iron overload from hereditary hemochromatosis can cause diabetes through both insulin deficiency from beta cell loss in the pancreas as well as insulin resistance.6 Our data, coupled with these observed relationships between hemochromatosis and insulin resistance, suggest that a “sweet‐spot” of HIC for maximal insulin sensitivity exists, above and below which increased insulin resistance is observed.
An alternative explanation for the relationship between HIC and insulin sensitivity is that insulin or some aspect of insulin resistance might regulate iron homeostasis. To explore this possibility further, we looked at serum hepcidin concentrations and their relationship to our eight measures of insulin sensitivity. Hepcidin is the key regulator of systemic iron absorption through its effect on small bowel enterocyte iron export.30, 31 Hepcidin is predominantly produced by hepatocytes and is transcriptionally regulated by a number of factors, including hepatic iron.30, 31 As such, we examined the markers of insulin resistance in relation to hepcidin after correction for HIC. We found that serum hepcidin levels positively correlated with serum insulin. This could indicate that insulin signaling may play a role in hepcidin regulation whereby insulin resistance leads to reduced intestinal iron absorption. However, as the other measures of insulin resistance were not associated with serum hepcidin levels, a direct link would seem unlikely.
We found that serum concentrations of the insulin‐sensitizing adipokine adiponectin positively correlate with HIC. This may in part explain the relationship between iron and insulin sensitivity in this cohort. However, adipokines, by definition, are cytokines that are synthesized in adipose tissue, and therefore adipocyte (or adipose tissue) iron concentrations are likely to be most important with respect to iron–adipokine interactions.
Indeed, HIC may not be an accurate surrogate measure of adipose tissue iron. Rodent data have shown that a high‐fat diet leads to a redistribution of iron from the liver to adipose tissue with a 4‐fold increase in adipocyte iron concentration and a 2‐fold reduction in HIC.32 Human studies demonstrate that obesity is associated not only with iron deficiency but paradoxically also with increased subcutaneous and visceral adipose tissue iron.33, 34, 35 Furthermore, increased adipocyte iron leading to a reduction in adiponectin expression has been demonstrated in a variety of mouse and adipocyte culture models.9 Taken together, it may be possible in NAFLD that iron redistributes from the liver to adipose tissue, thus contributing to insulin resistance and a reduction in serum adiponectin.
In this study, we measured HIC as a well‐validated surrogate for total body iron stores.36 We corrected HIC for percentage steatosis volume in order to give a truer more physiologically relevant HIC that is reflective of iron concentration in the aqueous (nonlipid) fraction of the liver. By doing this, we demonstrated that it is not simply HIC dilution by lipid that erroneously explains the relationships among iron, steatosis, and other measures of insulin resistance. It should be noted that this HIC correction is a conservative approach to the data that weakens the associations observed compared to when uncorrected HIC is used (data not shown).
Contrary to our findings, a number of other studies have indicated a positive association between serum adiponectin and measures of human iron stores.9, 37, 38 These studies may be limited by the choice of surrogate for HIC. In those three studies, inverse correlations were noted between serum ferritin and serum adiponectin; however, this only reached statistical significance in two of the studies.9, 37 These are interesting observations that were not seen in our cohort. Although serum ferritin undoubtedly correlates with HIC, it is clearly an imprecise measure of HIC. Our data showed that despite strong statistical significance (P < 0.001), the association itself was not strong (r 2 = 0.17), indicating that only 17% of the variance in serum ferritin is attributable to HIC. Ryan et al.38 have recently reported an inverse association between liver iron and serum adiponectin. However, the MRI T2* values, used as an inverse surrogate for HIC, were not corrected for volume of hepatic steatosis. In addition, there may have been a greater degree of liver injury in the Ryan et al. cohort, with 35.3% of individuals reported as having tissue elastography measurements indicative of bridging fibrosis or cirrhosis. These factors may, in part, explain the disparity between the two cohorts.
A weakness of our study is that it presupposes that venesection mobilizes adipose tissue iron as it does for other tissues. Although it is increasingly clear that adipocytes use much of the iron metabolism apparatus that is used in other tissues, such as transferrin receptor 1, hepcidin, and ferroportin, we are not aware of any human data that have addressed the degree to which adipose tissue iron is mobilized by venesection.9, 39 Another limitation of our study is the lack of liver histology. It is likely that there was a degree of heterogeneity of liver injury among participants studied. In addition, the lack of liver histology does not allow for determination of the relative distribution of iron between hepatocytes and reticuloendothelial cells. This may be critical to iron's impact within the liver as reticuloendothelial iron has been shown to be associated with apoptosis and a greater risk of hepatocellular ballooning, steatohepatitis, and advanced fibrosis in humans with NAFLD.40, 41
A strength of this study is that it represents an a priori assessment as part of a randomized controlled trial. Our study failed to demonstrate any effect of venesection on serum concentrations of the six adipokines studied. It is possible that our study may be underpowered for some of the adipokines as these were secondary endpoints for which the study was not prospectively powered.
In conclusion, we found a lack of effect of venesection on serum concentrations of six important adipokines in patients with NAFLD. However, we demonstrated significant correlations between hepatic iron, serum adiponectin, and multiple surrogate measures of insulin sensitivity. The causality of these relationships remains uncertain. Mechanistic explanations for the relationships between iron metabolism and insulin resistance are targets for future studies.
Acknowledgment
We thank Dr. Nick Kennedy (Jomar Life Research, Scoresby, Australia) who performed the Quantibody ELISA arrays.
Potential conflict of interest: Dr. St. Pierre consults, advises, is on the speakers' bureau, received grants, owns stock, and is employed by Resonance Health. Dr. House owns stock and is employed by Resonance Health. Dr. Stuart advises AbbVie, Bristol‐Myers Squibb, Bayer, and MSD. The other authors have nothing to report.
Supported by the Gallipoli Medical Research Foundation and the Gastroenterological Society of Australia (to L.B.); National Health and Medical Research Council Senior Research Fellowship (to V.N.S.) and Practitioner Fellowship (to J.O.); Raine Medical Research Foundation and Western Australian Government Department of Health (clinical research grant); Resonance Health Ltd. (magnetic resonance scans); and Metabolomics Australia (to J.G.).
REFERENCES
- 1. Chitturi S, Farrell GC, Hashimoto E, Saibara T, Lau GK, Sollano JD; Asia‐Pacific Working Party on NAFLD . Non‐alcoholic fatty liver disease in the Asia‐Pacific region: definitions and overview of proposed guidelines. J Gastroenterol Hepatol 2007;22:778‐787. [DOI] [PubMed] [Google Scholar]
- 2. Vernon G, Baranova A, Younossi ZM. Systematic review: the epidemiology and natural history of non‐alcoholic fatty liver disease and non‐alcoholic steatohepatitis in adults. Aliment Pharmacol Ther 2011;34:274‐285. [DOI] [PubMed] [Google Scholar]
- 3. Anstee QM, Targher G, Day CP. Progression of NAFLD to diabetes mellitus, cardiovascular disease or cirrhosis. Nat Rev Gastroenterol Hepatol 2013;10:330‐344. [DOI] [PubMed] [Google Scholar]
- 4. Nelson JE, Klintworth H, Kowdley KV. Iron metabolism in nonalcoholic fatty liver disease. Curr Gastroenterol Rep 2012;14:8‐16. [DOI] [PubMed] [Google Scholar]
- 5. Dongiovanni P, Fracanzani AL, Fargion S, Valenti L. Iron in fatty liver and in the metabolic syndrome: a promising therapeutic target. J Hepatol 2011;55:920‐932. [DOI] [PubMed] [Google Scholar]
- 6. Simcox JA, McClain DA. Iron and diabetes risk. Cell Metab 2013;17:329‐341. [DOI] [PMC free article] [PubMed] [Google Scholar]
- 7. Hebbard L, George J. Animal models of nonalcoholic fatty liver disease. Nat Rev Gastroenterol Hepatol 2011;8:35‐44. [DOI] [PubMed] [Google Scholar]
- 8. Marra F, Bertolani C. Adipokines in liver diseases. Hepatology 2009;50:957‐969. [DOI] [PubMed] [Google Scholar]
- 9. Gabrielsen JS, Gao Y, Simcox JA, Huang J, Thorup D, Jones D, et al. Adipocyte iron regulates adiponectin and insulin sensitivity. J Clin Invest 2012;122:3529‐3540. [DOI] [PMC free article] [PubMed] [Google Scholar]
- 10. Gao Y, Li Z, Gabrielsen JS, Simcox JA, Lee SH, Jones D, et al. Adipocyte iron regulates leptin and food intake. J Clin Invest 2015;125:3681‐3691. [DOI] [PMC free article] [PubMed] [Google Scholar]
- 11. Dongiovanni P, Ruscica M, Rametta R, Recalcati S, Steffani L, Gatti S, et al. Dietary iron overload induces visceral adipose tissue insulin resistance. Am J Pathol 2013;182:2254‐2263. [DOI] [PubMed] [Google Scholar]
- 12. Fernandez‐Real JM, Moreno JM, Ricart W. Circulating retinol‐binding protein‐4 concentration might reflect insulin resistance‐associated iron overload. Diabetes 2008;57:1918‐1925. [DOI] [PMC free article] [PubMed] [Google Scholar]
- 13. Hotamisligil GS. Mechanisms of TNF‐alpha‐induced insulin resistance. Exp Clin Endocrinol Diabetes 1999;107:119‐125. [DOI] [PubMed] [Google Scholar]
- 14. Kristiansen OP, Mandrup‐Poulsen T. Interleukin‐6 and diabetes: the good, the bad, or the indifferent? Diabetes 2005;54(Suppl. 2):S114‐S124. [DOI] [PubMed] [Google Scholar]
- 15. Chen L, Xiong S, She H, Lin SW, Wang J, Tsukamoto H. Iron causes interactions of TAK1, p21ras, and phosphatidylinositol 3‐kinase in caveolae to activate IkappaB kinase in hepatic macrophages. J Biol Chem 2007;282:5582‐5588. [DOI] [PubMed] [Google Scholar]
- 16. Laine F, Ruivard M, Loustaud‐Ratti V, Bonnet F, Cales P, Bardou‐Jacquet E, et al.; Study Group . Metabolic and hepatic effects of bloodletting in dysmetabolic iron overload syndrome: a randomized controlled study in 274 patients. Hepatology 2017;65:465‐474. [DOI] [PubMed] [Google Scholar]
- 17. Adams LA, Crawford DH, Stuart K, House MJ, St Pierre TG, Webb M, et al. The impact of phlebotomy in nonalcoholic fatty liver disease: a prospective, randomized, controlled trial. Hepatology 2015;61:1555‐1564. [DOI] [PubMed] [Google Scholar]
- 18. Adams LA, George J, Bugianesi E, Rossi E, De Boer WB, van der Poorten D, et al. Complex non‐invasive fibrosis models are more accurate than simple models in non‐alcoholic fatty liver disease. J Gastroenterol Hepatol 2011;26:1536‐1543. [DOI] [PubMed] [Google Scholar]
- 19. van Rijnsoever M, Galhenage S, Mollison L, Gummer J, Trengove R, Olynyk JK. Dysregulated erythropoietin, hepcidin, and bone marrow iron metabolism contribute to interferon‐induced anemia in hepatitis C. J Interferon Cytokine Res 2016;36:630‐634. [DOI] [PubMed] [Google Scholar]
- 20. Gummer J, Trengove R, Pascoe EM, Badve SV, Cass A, Clarke P, et al.; HERO Study Collaborative Group . Association between serum hepcidin‐25 and primary resistance to erythropoiesis stimulating agents in chronic kidney disease: a secondary analysis of the HERO trial. Nephrology (Carlton) 2017;22:548‐554. [DOI] [PubMed] [Google Scholar]
- 21. Litton E, Baker S, Erber WN, Farmer S, Ferrier J, French C, et al.; Australian and New Zealand Intensive Care Society Clinical Trials Group . Intravenous iron or placebo for anaemia in intensive care: the IRONMAN multicentre randomized blinded trial: a randomized trial of IV iron in critical illness. Intensive Care Med 2016;42:1715‐1722. [DOI] [PubMed] [Google Scholar]
- 22. House MJ, Gan EK, Adams LA, Ayonrinde OT, Bangma SJ, Bhathal PS, et al. Diagnostic performance of a rapid magnetic resonance imaging method of measuring hepatic steatosis. PLoS One 2013;8:e59287. [DOI] [PMC free article] [PubMed] [Google Scholar]
- 23. St Pierre TG, Clark PR, Chua‐anusorn W, Fleming AJ, Jeffrey GP, Olynyk JK, et al. Noninvasive measurement and imaging of liver iron concentrations using proton magnetic resonance. Blood 2005;105:855‐861. [DOI] [PubMed] [Google Scholar]
- 24. Lomonaco R, Ortiz‐Lopez C, Orsak B, Webb A, Hardies J, Darland C, et al. Effect of adipose tissue insulin resistance on metabolic parameters and liver histology in obese patients with nonalcoholic fatty liver disease. Hepatology 2012;55:1389‐1397. [DOI] [PubMed] [Google Scholar]
- 25. Matthews DR, Hosker JP, Rudenski AS, Naylor BA, Treacher DF, Turner RC. Homeostasis model assessment: insulin resistance and beta‐cell function from fasting plasma glucose and insulin concentrations in man. Diabetologia 1985;28:412‐419. [DOI] [PubMed] [Google Scholar]
- 26. Matsuda M, DeFronzo RA. Insulin sensitivity indices obtained from oral glucose tolerance testing: comparison with the euglycemic insulin clamp. Diabetes Care 1999;22:1462‐1470. [DOI] [PubMed] [Google Scholar]
- 27. Bacon BR, Adams PC, Kowdley KV, Powell LW, Tavill AS; American Association for the Study of Liver Diseases . Diagnosis and management of hemochromatosis: 2011 practice guideline by the American Association for the Study of Liver Diseases. Hepatology 2011;54:328‐343. [DOI] [PMC free article] [PubMed] [Google Scholar]
- 28. Bugianesi E, Manzini P, D'Antico S, Vanni E, Longo F, Leone N, et al. Relative contribution of iron burden, HFE mutations, and insulin resistance to fibrosis in nonalcoholic fatty liver. Hepatology 2004;39:179‐187. [DOI] [PubMed] [Google Scholar]
- 29. Bassett ML, Halliday JW, Powell LW. Value of hepatic iron measurements in early hemochromatosis and determination of the critical iron level associated with fibrosis. Hepatology 1986;6:24‐29. [DOI] [PubMed] [Google Scholar]
- 30. Anderson GJ, Vulpe CD. Mammalian iron transport. Cell Mol Life Sci 2009;66:3241‐3261. [DOI] [PMC free article] [PubMed] [Google Scholar]
- 31. Fleming RE, Ponka P. Iron overload in human disease. N Engl J Med 2012;366:348‐359. [DOI] [PubMed] [Google Scholar]
- 32. Orr JS, Kennedy A, Anderson‐Baucum EK, Webb CD, Fordahl SC, Erikson KM, et al. Obesity alters adipose tissue macrophage iron content and tissue iron distribution. Diabetes 2014;63:421‐432. [DOI] [PMC free article] [PubMed] [Google Scholar]
- 33. Coimbra S, Catarino C, Santos‐Silva A. The role of adipocytes in the modulation of iron metabolism in obesity. Obes Rev 2013;14:771‐779. [DOI] [PubMed] [Google Scholar]
- 34. Siddique A, Nelson JE, Aouizerat B, Yeh MM, Kowdley KV; NASH Clinical Research Network . Iron deficiency in patients with nonalcoholic fatty liver disease is associated with obesity, female gender, and low serum hepcidin. Clin Gastroenterol Hepatol 2014;12:1170‐1178. [DOI] [PMC free article] [PubMed] [Google Scholar]
- 35. Pihan‐Le Bars F, Bonnet F, Loreal O, Le Loupp AG, Ropert M, Letessier E, et al. Indicators of iron status are correlated with adiponectin expression in adipose tissue of patients with morbid obesity. Diabetes Metab 2016;42:105‐111. [DOI] [PubMed] [Google Scholar]
- 36. Pippard MJ. Measurement of iron status. Prog Clin Biol Res 1989;309:85‐92. [PubMed] [Google Scholar]
- 37. Wlazlo N, van Greevenbroek MM, Ferreira I, Jansen EH, Feskens EJ, van der Kallen CJ, et al. Iron metabolism is associated with adipocyte insulin resistance and plasma adiponectin: the Cohort on Diabetes and Atherosclerosis Maastricht (CODAM) study. Diabetes Care 2013;36:309‐315. [DOI] [PMC free article] [PubMed] [Google Scholar]
- 38. Ryan JD, Armitage AE, Cobbold JF, Banerjee R, Borsani O, Dongiovanni P, et al. Hepatic iron is the major determinant of serum ferritin in patients with NAFLD. Liver Int 2018;38:164‐173. [DOI] [PubMed] [Google Scholar]
- 39. Bekri S, Gual P, Anty R, Luciani N, Dahman M, Ramesh B, et al. Increased adipose tissue expression of hepcidin in severe obesity is independent from diabetes and NASH. Gastroenterology 2006;131:788‐796. [DOI] [PubMed] [Google Scholar]
- 40. Maliken BD, Nelson JE, Klintworth HM, Beauchamp M, Yeh MM, Kowdley KV. Hepatic reticuloendothelial system cell iron deposition is associated with increased apoptosis in nonalcoholic fatty liver disease. Hepatology 2013;57:1806‐1813. [DOI] [PMC free article] [PubMed] [Google Scholar]
- 41. Nelson JE, Wilson L, Brunt EM, Yeh MM, Kleiner DE, Unalp‐Arida A, et al.; Nonalcoholic Steatohepatitis Clinical Research Network . Relationship between the pattern of hepatic iron deposition and histological severity in nonalcoholic fatty liver disease. Hepatology 2011;53:448‐457. [DOI] [PMC free article] [PubMed] [Google Scholar]