Abstract
In the brain, the ventral hypothalamus (VHT) regulates energy and bone metabolism. Whether this regulation uses the same or different neuronal circuits is unknown. Alteration of AP1 signaling in the VHT increases energy expenditure, glucose utilization, and bone density, yet the specific neurons responsible for each or all of these phenotypes are not identified. Using neuron-specific, genetically targeted AP1 alterations as a tool in adult mice, we found that agouti-related peptide–expressing (AgRP-expressing) or proopiomelanocortin-expressing (POMC-expressing) neurons, predominantly present in the arcuate nucleus (ARC) within the VHT, stimulate whole-body energy expenditure, glucose utilization, and bone formation and density, although their effects on bone resorption differed. In contrast, AP1 alterations in steroidogenic factor 1–expressing (SF1-expressing) neurons, present in the ventromedial hypothalamus (VMH), increase energy but decrease bone density, suggesting that these effects are independent. Altered AP1 signaling also increased the level of the neuromediator galanin in the hypothalamus. Global galanin deletion (VHT galanin silencing using shRNA) or pharmacological galanin receptor blockade counteracted the observed effects on energy and bone. Thus, AP1 antagonism reveals that AgRP- and POMC-expressing neurons can stimulate body metabolism and increase bone density, with galanin acting as a central downstream effector. The results obtained with SF1-expressing neurons, however, indicate that bone homeostasis is not always dictated by the global energy status, and vice versa.
Keywords: Bone Biology, Metabolism
Keywords: Osteoporosis
Introduction
The hypothalamus plays a central role in the systemic regulation of energy homeostasis (1). Several hypothalamic sites sense nutrient (e.g., glucose, lipids) and endocrine (e.g., leptin, insulin, ghrelin) cues and coordinate metabolic responses (2). Within the arcuate nucleus (ARC), 2 types of neurons coexist: neurons expressing the anorexigenic α-melanocyte–stimulating hormone derived from proopiomelanocortin (POMC) and neurons expressing the orexigenic agouti-related peptide (AgRP). Genetic ablation (3) and optogenetic activation of AgRP neurons established their prominent role in feeding (4) and foraging behavior (5), whereas POMC neurons were shown to exert opposite effects (6). Beyond the ARC, the ventromedial hypothalamus (VMH) area, harboring the steroidogenic factor 1 (SF1) neurons, is also implicated in the control of adiposity, energy expenditure, and thermogenesis (7). The inhibitory neuropeptide galanin, abundantly expressed within the ARC but at low levels in the VMH (8), is also known to modulate the consumption of food, drugs, and alcohol (9, 10).
ΔFosB, a splice isoform of the AP1 transcription factor FosB, acts as a central regulator of both energy metabolism and bone (11–15). ΔFosB, which lacks the C-terminal transactivation domain, is an AP1 antagonist (16). Mice overexpressing ΔFosB driven by the enolase 2 (ENO2) promoter exhibit a lean phenotype with improved glucose metabolism and insulin sensitivity, elevated energy expenditure, and high bone mass due to increased bone formation (12, 14, 15). Moreover, mice in which ΔFosB or the artificial AP1 antagonist dominant-negative JunD (DNJunD) are stereotactically targeted to the ventral hypothalamus (VHT) phenocopy the ENO2-ΔFosB mice (13). Whereas AP1 is thought to be central to energy regulation and inflammation (17) and c-Fos expression is commonly used a marker of neuronal activation (18), the mechanisms by which VHT AP1 antagonism increases energy expenditure, glucose utilization, and bone formation still remain obscure.
VHT neuropeptides regulate not only metabolism but also bone remodeling and homeostasis (19). While energy-conserving AgRP and energy-expending POMC neurons conform to the metabolic polarity, their roles in the regulation of the skeleton appear less uniform. For instance, studies involving hypothalamic overexpression of NPY, a neurotransmitter that is colocalized with AgRP (20), and hypothalamic Y2R receptor deletion (21) suggested that NPY is a negative regulator of bone formation. In contrast, activation of AgRP neurons has a positive influence on bone mass (22). Additional coregulators of bone and metabolism include the adipokine leptin, which acts as a master switch of fat balance (23) and appears to control bone via 2 antagonistic mechanisms: negatively affecting bone mass via central activation of the sympathetic tone (24) and the serotonergic system (25), and positively affecting bone mass via CART, a neurotransmitter colocalized with POMC (26). The skeletal effects of leptin are mediated both centrally and peripherally, whereas CART was reported to have the strongest influence as a circulating hormone (27). Unlike AgRP/NPY and CART, so far no link has been established between central galanin signaling and bone.
Here we used AP1 antagonism as a tool to elucidate the role of AgRP, POMC, and SF1 neurons in the control of energy and bone in adult mice and understand whether the same or different hypothalamic neuronal circuits regulate bone and energy. Combining genetically and stereotactically restricted delivery of several AP1 antagonists to adult mice, including ΔFosB, Δ2ΔFosB (a further truncated form of FosB) and DNJunD, or the AP1 agonist FosB, to individual AgRP-, POMC-, or SF1-producing neurons, we demonstrate the ability of the neuronal AP1 machinery to consistently induce whole-body energy metabolism in either neuron type. Furthermore, we show that neurons predominantly present in the ARC are responsible for the increase in bone mass, although via different and neuron-specific effects on bone formation and resorption, whereas the VMH SF1 neurons have the opposite effect on bone. Finally, we have identified galanin as a central neuromediator in the VHT, essential for transducing both the metabolic and skeletal effects from these neurons to their target organs.
Results
Generation of CRE-inducible AP1 lentiviruses and validation of stereotactic injection.
To determine which neurons are responsible for the metabolic and skeletal responses, we used a Cre recombinase–based (CRE-based) genetic model in combination with the anatomical targeting approach to target AP1 antagonists to specific neurons within the VHT. We designed CRE-inducible constructs, where FLAG-tagged AP1 antagonists ΔFosB, Δ2ΔFosB, DNJunD, or the AP1 agonist FosB, were subcloned into the pTomo backbone vector carrying red fluorescent protein (RFP) and a stop codon positioned between 2 loxP sites. Recognition of loxP by CRE excises the RFP and stop codon and allows translation of the downstream AP1 factors and GFP. We packaged these constructs into lentiviruses (LVs) for stereotactic delivery into the VHT of mice expressing CRE under the control of neuron-specific promoters, specifically AgRP-CRE, POMC-CRE, and SF1-CRE (Supplemental Figure 1A; supplemental material available online with this article; https://doi.org/10.1172/JCI99350DS1). To test the efficiency and CRE specificity of the cloned constructs, they were transfected into 293T HEK cells in the presence or absence of CAG-CRE. Western blots show that all 4 vectors exhibit detectable expression of FLAG and of their respective proteins, which are “silent” in the absence of CRE (Supplemental Figure 1B), confirming their CRE inducibility. As expected, CRE led to a reduction in the RFP signal intensity with an unchanged GFP signal after transduction of AP1 LVs into either 293T HEK cells (Supplemental Figure 1C) or primary neurons isolated from the hypothalami of AgRP-CRE or POMC-CRE mice (Supplemental Figure 1D). Quantitative PCR (qPCR) analysis further confirmed the expression of specific AP1 factors in LV-infected primary hypothalamic neurons (Supplemental Figure 1E). Having demonstrated the CRE-specific inducibility of our vectors, we then optimized the stereotactic injection protocols and validated the specific anatomical region of the brain where our AP1 antagonists are expressed. For this purpose, the neuron-specific CRE mice were crossed with the reporter R26R-Brainbow2.1 mice, to allow individual neurons to be distinguished by fluorescent labels. The VHTs of these mice were then stereotactically injected with CRE-inducible AP1 LVs (Supplemental Figure 1F) and subjected to histological examination. Supporting previous findings, red fluorescence showed that AgRP and POMC neurons were present mostly in the ARC region, whereas SF1 neurons were detected mostly in the VMH area. Bilateral lentiviral vector injection was shown to be delivered in the vicinity of neuronal cells of interest (Supplemental Figure 1G, yellow label with a proportion of green). Examination of several sections anterior and posterior to the injection site showed no fluorescence, confirming that the viral particles do not spread to large and undefined areas and remain restricted to the injection site. To show neuron-specific expression of our constructs, we performed immunostaining of brain sections in mice injected with FLAG-tagged ΔFosB LV. FLAG was colocalized with AgRP or POMC in AgRP-CRE or POMC-CRE mice, respectively, and we did not observe FLAG staining in nontargeted neuronal cells (we found no green signal in the absence of red), demonstrating, as expected, neuron-specific ΔFosB protein expression (Supplemental Figure 2A). Furthermore, ΔFosB signal was colocalized with AgRP or POMC in primary hypothalamic neurons isolated from AgRP-CRE or POMC-CRE mice, respectively (Supplemental Figure 2B). Finally, to exclude a potential promoter “escape” in vivo, we injected AP1 LV to the VHT of C57BL (lacking CRE) mice and found no effect on energy expenditure, glucose metabolism, or bone density (Supplemental Figure 3). Taken together, these data supported the ability of our tools to selectively target individual populations of VHT neurons, allowing their further evaluation in the AgRP- and POMC-CRE mice models.
AP1 antagonism in AgRP neurons increases energy metabolism and bone density.
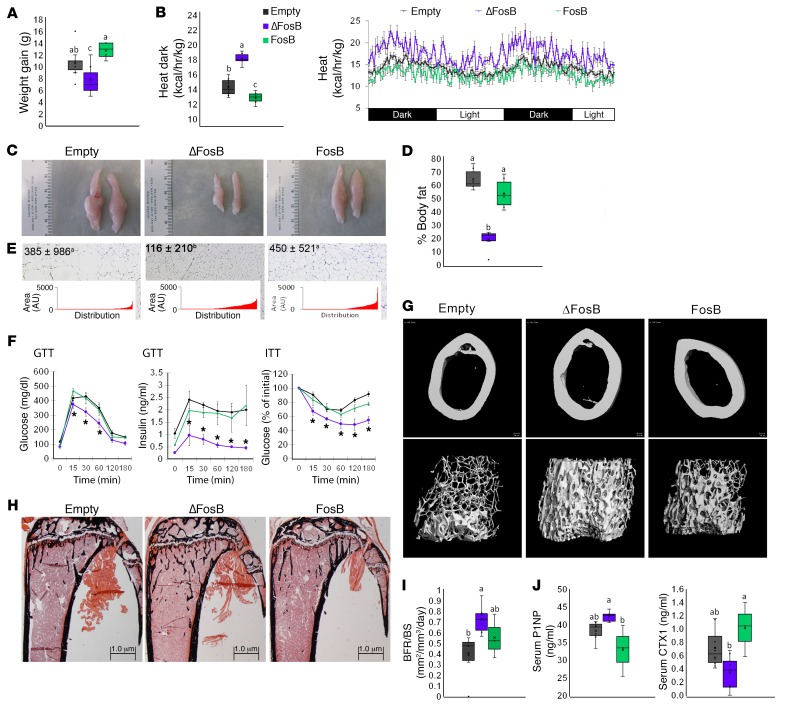
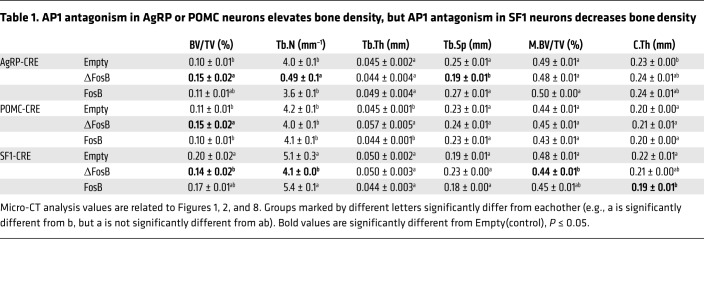
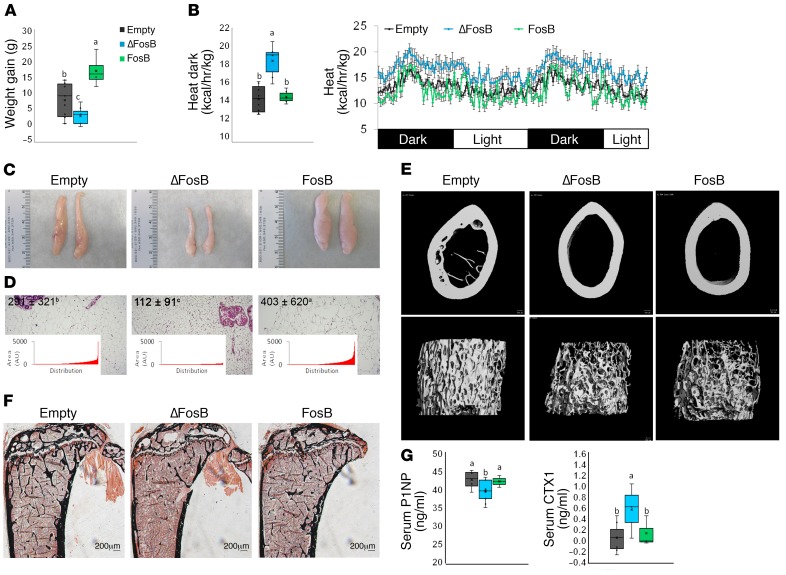
The CRE-inducible AP1 LVs were first delivered into the VHT of AgRP-CRE mice, ensuring the expression of ΔFosB, Δ2ΔFosB, or DNJunD, all AP1 antagonists in AgRP-producing neurons. Empty vector LV and the AP1 agonist FosB LV were used as negative controls. Selective AP1 antagonism in AgRP neurons suppressed weight gain and enhanced energy expenditure, as measured by heat production (Figure 1, A and B), recapitulating the phenotype observed with non–neuron-specific VHT AP1 blockade (13). Abdominal fat pads were smaller (Figure 1, C and D) and with reduced adipocyte size (Figure 1E), suggesting an altered energy balance in favor of energy utilization. Dual-energy x-ray absorptiometry (DXA) analysis showed a reduction in fat mass, whereas lean mass remained unchanged (Supplemental Figure 8). In addition to lower weight, we observed an increased glucose clearance and insulin sensitivity, as measured by the glucose tolerance test (GTT) and insulin tolerance test (ITT) (Figure 1F), as well as smaller insulin-positive islets of Langerhans (Supplemental Figure 4). Expression of the AP1 agonist FosB, used here as a control, failed to induce an increase in energy expenditure or to affect glucose metabolism (Figure 1, A–F). In line with recapitulating the metabolic phenotype of ENO2-ΔFosB overexpression (13), AP1 antagonism in AgRP neurons also resulted in increased trabecular bone volume (Figure 1, G and H, and Supplemental Figure 5). ΔFosB expression induced a 50% increase in bone mass (bone volume over total volume [BV/TV]) over the respective empty vector control (Figure 1G and Table 1). Expression of Δ2ΔFosB and DNJunD followed similar trends (Supplemental Figure 6). Mechanistically, while the measured bone formation rate (bone formation rate over bone surface [BFR/BS]) as well as the level of bone formation marker serum procollagen I intact N-terminal (P1NP) were increased (Figure 1, I and J), the level of bone resorption marker serum carboxy-terminal collagen type I crosslinks (CTX) was reduced (Figure 1J). In contrast, FosB decreased P1NP, increased CTX, and had no effect on BV/TV (Figure 1, G–J, and Table 1). Overall, these data suggest that inhibition of AP1 in AgRP-expressing neurons is sufficient to enhance systemic energy metabolism and bone formation in mice. Of note, although FosB expression had the expected opposite effects on several of the measured parameters, it sometimes had no measurable effects, possibly due to the fact that FosB is further truncated to long-acting ΔFosB isoform (28), masking FosB effects by increasing antagonism over the course of the study.
Figure 1. AP1 antagonism in AgRP neurons increases energy expenditure and bone density.
The VHTs of male 6- to 7-week-old AgRP-CRE mice were stereotactically injected with CRE-inducible AP1 (ΔFosB, Δ2ΔFosB, DNJunD, or FosB) LVs, and metabolic and bone profiles were assessed 6 weeks after surgery. (A) Weight gain at 3 and 6 weeks. (B) Calorimetric analysis of energy expenditure. (C) Representative images of epididymal white adipose tissue (eWAT). (D) Percentage of body fat calculated from abdominal fat pad weight in relation to total body weight. (E) H&E-stained sections of eWAT. Values and graphs correspond to adipocyte size mean and distribution. (F) Glucose tolerance test and insulin tolerance test. *P < 0.05.(G) Micro-CT analysis of femurs (see Table 1 for values). (H) von Kossa staining of tibiae. (I) BFR/BS histomorphometry. (J) Serum P1NP and CTX. Statistical analysis included ANOVA followed by Tukey-Kramer HSD test, P < 0.05, comparing 5 groups (n = 6–9). Groups marked by different letters significantly differ from each other (e.g., a is significantly different from b, but a is not significantly different from ab). The Empty, ΔFosB, and FosB groups are shown. The expanded data set, including the Δ2ΔFosB and DNJunD groups, is in Supplemental Figure 6.
Table 1. AP1 antagonism in AgRP or POMC neurons elevates bone density, but AP1 antagonism in SF1 neurons decreases bone density.
AP1 antagonism in POMC neurons also increases energy metabolism and bone density.
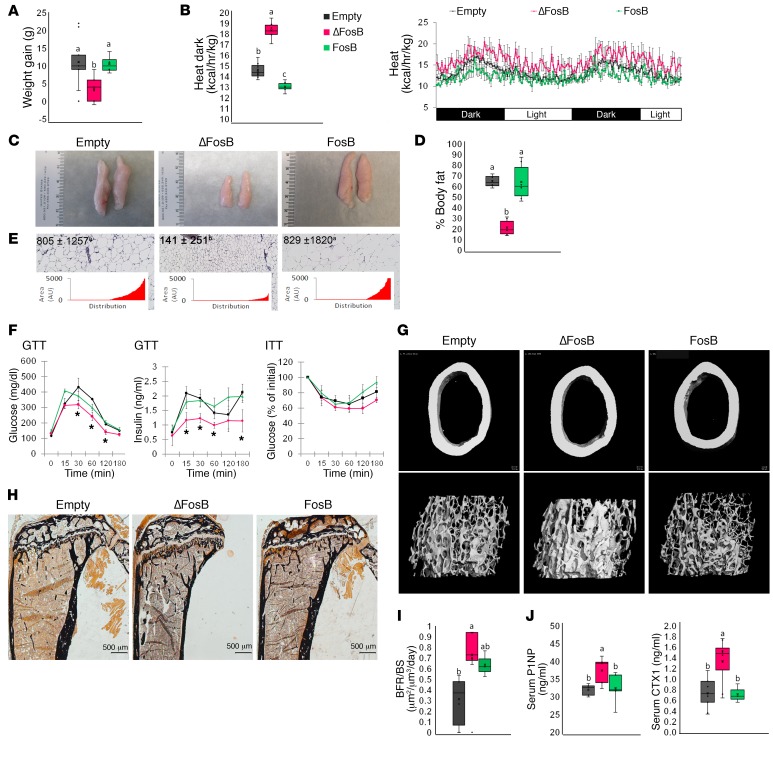
AgRP and POMC neurons exert opposite actions on feeding and metabolic balance (3, 4). POMC neurons could therefore have opposite effects to those of the AgRP neurons on energy and bone metabolism. Surprisingly, the delivery of CRE-inducible LVs expressing ΔFosB into the VHT of POMC-CRE mice also resulted in an enhanced metabolic profile with lower body weight, decreased fat mass, increased energy expenditure, smaller abdominal fat pads with smaller adipocytes, and improved glucose metabolism with smaller pancreatic islets and higher insulin sensitivity (Figure 2, A–F, and Supplemental Figures 4 and 7). Furthermore, this metabolic enhancement was also associated with an increase in trabecular BV/TV (Figure 2, G and H, and Table 1). The mechanism leading to the increase in bone mass was, however, different from AgRP-expressing neurons: BFR/BS and both P1NP and CTX were increased (Figure 2, I and J). These changes were confirmed by histomorphometry (Supplemental Figure 5). The other AP1 antagonists, Δ2ΔFosB and DNJunD, exhibited similar increases in metabolism and bone parameters, and FosB had no effect (Figure 2 and Supplemental Figure 7). Interestingly, the AP1 blockade-dependent induction of energy metabolism in both POMC and AgRP neurons is not the consequence of altered feeding, as it remained unchanged in both groups of mice (Supplemental Figure 8). Collectively, these data suggest that in contrast to the classically divergent roles of AgRP and POMC neurons, inhibition of AP1 in neurons expressing one or the other of these neuromediators stimulates whole-body energy and improves glucose metabolism. Moreover, AP1 blockade in any of these neurons promotes a positive regulation of bone mass, yet the effects on osteoclast function appear to differ between AgRP and POMC.
Figure 2. AP1 antagonism in POMC neurons increases energy expenditure and elevates bone density.
The VHTs of male 6- to 7-week-old POMC-CRE mice were stereotactically injected with CRE-inducible AP1 (ΔFosB, Δ2ΔFosB, DNJunD, or FosB) LVs, and metabolic and bone profiles were assessed 6 weeks after surgery. (A) Weight gain at 3 and 6 weeks. (B) Calorimetric analysis of energy expenditure. (C) Representative images of eWAT. (D) Percentage of body fat calculated from abdominal fat pad weight in relation to total body weight. (E) H&E-stained sections of eWAT. Values and graphs correspond to adipocyte size mean and distribution. (F) Glucose (GTT) and insulin (ITT) tolerance tests. (G) Micro-CT analysis of femurs (see Table 1 for values). (H) von Kossa staining of tibiae. (I) BFR/BS histomorphometry. (J) Serum P1NP and CTX. Statistical analysis included ANOVA followed by Tukey-Kramer HSD test, P < 0.05, comparing 5 groups (n = 6–9). Groups marked by different letters significantly differ from each other (e.g., a is significantly different from b, but a is not significantly different from ab). The Empty, ΔFosB, and FosB groups are shown. The expanded data set, including the Δ2ΔFosB and DNJunD groups, is found in Supplemental Figure 7.
AP1 antagonism upregulates galanin expression and signaling in the hypothalamus.
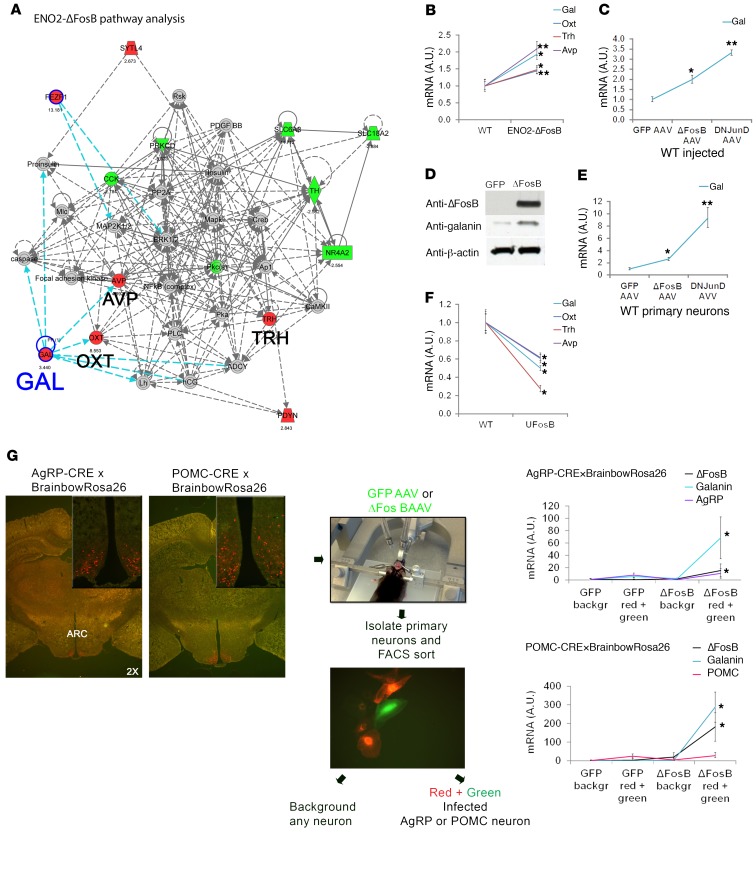
Given that both types of neurons generated similar energy phenotypes, we searched for a common neuromediator rather than the neuron-restricted AgRP and POMC. To identify the neuromediator alterations by which AP1 blockade in the VHT mediates these effects, we performed a microarray and differential gene expression analysis of hypothalami from ENO2-ΔFosB transgenic mice (which showed the same phenotype as observed here) or WT mice in which the VHT was injected with ΔFosB AAV or DNJunD AAV, using littermates and GFP AAV as controls, respectively. Whereas no significant changes were observed in other neuropeptides, our data revealed a 3.5-fold increase in the expression of galanin in the hypothalami of ENO2-ΔFosB mice and ΔFosB AAV mice. Interestingly, we also observed a parallel increase in 3 of the galanin-regulated hypothalamic-born neurohormones — oxytocin, arginine vasopressin (AVP), and thyrotropin-releasing hormone (TRH) (Supplemental Figure 9 and Figure 3A) — further confirming activation of the galanin signaling pathway. These findings were validated by qPCR in several AP1 antagonist–overexpressing models. Interestingly, hypothalami from ENO2-ΔFosB mice (Figure 3B), WT mice in which the VHT was injected with ΔFosB AAV and DNJunD AAV (Figure 3, C and D), and primary hypothalamic neurons isolated from WT mice and transduced with ΔFosB AAV and DNJunD AAV (Figure 3E) all demonstrated an upregulation of galanin expression. In contrast, hypothalami from UFosB transgenic mice, in which a mutation prevents the generation of the ΔFosB splice variant from the full-length FosB (29), showed a lower galanin expression level compared with littermate controls (Figure 3F). To assess the site of galanin upregulation, and given the lack of information regarding galanin expression in our specific neurons of interest, we crossed AgRP-CRE (or POMC-CRE) mice with reporter R26R-Brainbow2.1 mice, marking all AgRP- or POMC-expressing neurons one unique color (predominantly red). We then injected the recombined animals with GFP-AAV or ΔFosB-AAV (green) and isolated and FACS-sorted primary hypothalamic neurons. As expected under our experimental conditions combining genetic and stereotactic targeting, qPCR analysis revealed that ΔFosB overexpression increased galanin levels specifically in AgRP- or POMC-expressing neurons (red and green) (Figure 3G and Supplemental Figure 10). Collectively, these observations suggested a mechanistic link between galanin signaling and the central regulation of energy, glucose, and/or bone metabolism in response to AP1 blockade.
Figure 3. AP1 antagonism increases galanin expression.
(A) Microarray and differential gene expression with pathway analysis of ENO2-ΔFosB and control hypothalami (n = 2). (B) Real-time PCR analysis of ENO2-ΔFosB mice hypothalami showing elevated galanin mRNA (n = 3). (C) Real-time PCR analysis of hypothalami from mice in which the VHT was injected with ΔFosB AAV, DNJunD AAV, or GFP AAV, showing elevated galanin mRNA (n = 6) 6 weeks after surgery. (D) Western blot of hypothalami (6 weeks after surgery) from mice in which the VHT was injected with ΔFosB AAV or GFP AAV (n = 3). (E) Real-time PCR analysis of primary hypothalamic neuronal cells isolated from WT C57BL mice and transduced with AP1 AAV (n = 4). (F) Real-time PCR analysis of hypothalami from UFosB mice (no ΔFosB or Δ2ΔFosB splices) showing suppressed galanin mRNA (n = 4). (G) AgRP-CRE (or POMC-CRE) mice were crossed with reporter R26R-Brainbow2.1 mice marking all AgRP neurons with a single, unique color (predominantly red). Recombined mice were then injected in the VHT with GFP-AAV or ΔFosB-AAV (green), and primary hypothalamic neurons were isolated and subjected to FACS sorting using PE-A filter for red fluorescence and FITC-A for green fluorescence. A population displaying both red and green represents AgRP (or POMC) neurons infected with AAV. qPCR analysis showing increased galanin expression by ΔFosB in AgRP and POMC neurons (n = 4). Statistical analysis included 1-tailed t test. *P < 0.05, **P < 0.001.
Expression of AP1 antagonists is associated with galanin promoter activation.
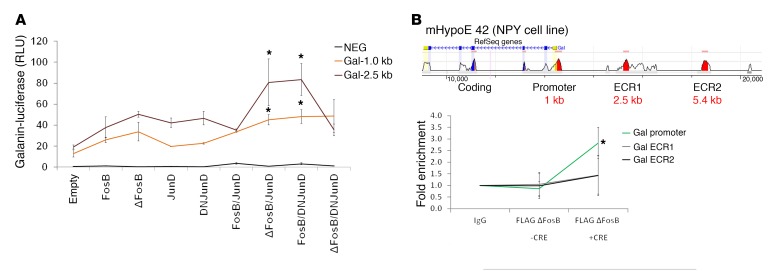
To determine whether ΔFosB associates directly with the galanin gene, we performed a ChIP assay on galanin-producing mHypoE 42 cells transfected with CRE-inducible FLAG ΔFosB constructs in the presence or absence of cotransfected CRE. The ChIP results demonstrated more than 2.5-fold enrichment of ΔFosB at the level of the promoter, but not at the level of other evolutionary conserved regions (ECRs), suggesting physical interaction between ΔFosB and the galanin promoter region (Figure 4A). In galanin promoter luciferase assays, FosB, ΔFosB, and DNJunD alone, as well as the pure agonists JunD, FosB/JunD, and the pure antagonist ΔFosB/DNJunD combinations, failed to activate the galanin promoter. In contrast, antagonist-agonist heterodimers, including ΔFosB/JunD and DNJunD/FosB, stimulated galanin promoter activity (Figure 4B), possibly because FosB or JunD provide efficient DNA binding and transactivating domains. Although the presence of an AP1 12-O-tetradecanoylphorbol-13-acetate (phorbol-12-myristate-13-acetate) response element (GTRE) octamer sequence (TGACGCGG) has been reported in the galanin promoter (30), neither ΔFosB/JunD nor DNJunD/FosB activated this region in the Gal GTRE-pEZX-PG04 construct (Supplemental Figure 11), suggesting that these AP1 factors dock at sites other than this GTRE. These results suggest that AP1 antagonists, possibly as heterodimers with AP1 components, are capable of binding and stimulating galanin promoter activity. We did not find direct binding of the other antagonists tested. Thus, because we did not find AP1 or DNJunD binding on the galanin promoter sequence that we tested, we cannot exclude the possibility that the regulation of galanin expression can be direct, via ΔFosB binding, or through AP1 binding on other promoters, affecting galanin expression indirectly.
Figure 4. AP1 antagonists bind to the galanin promoter and increase galanin transcription.
(A) ChIP assay was performed in the mHypoE 42 hypothalamic cell line and transfected with FLAG-tagged ΔFosB in the absence or presence of CRE using anti-FLAG antibodies for DNA fragment pull-down (n = 3). (B) Galanin luciferase assay performed on 239A cells using various combinations of AP1 constructs alone or as heterodimers. Statistical analysis included 1-tailed t test. *P < 0.05.
Temporal and spatial silencing of galanin in the VHT prevents ΔFosB-induced increases in energy, glucose metabolism, and bone density in AgRP and POMC neurons.
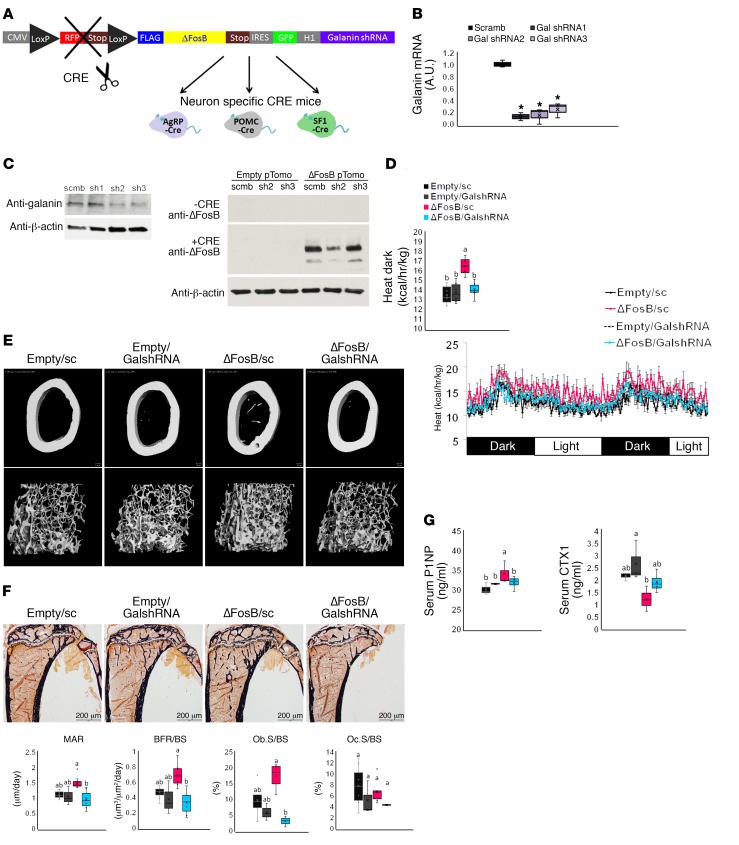
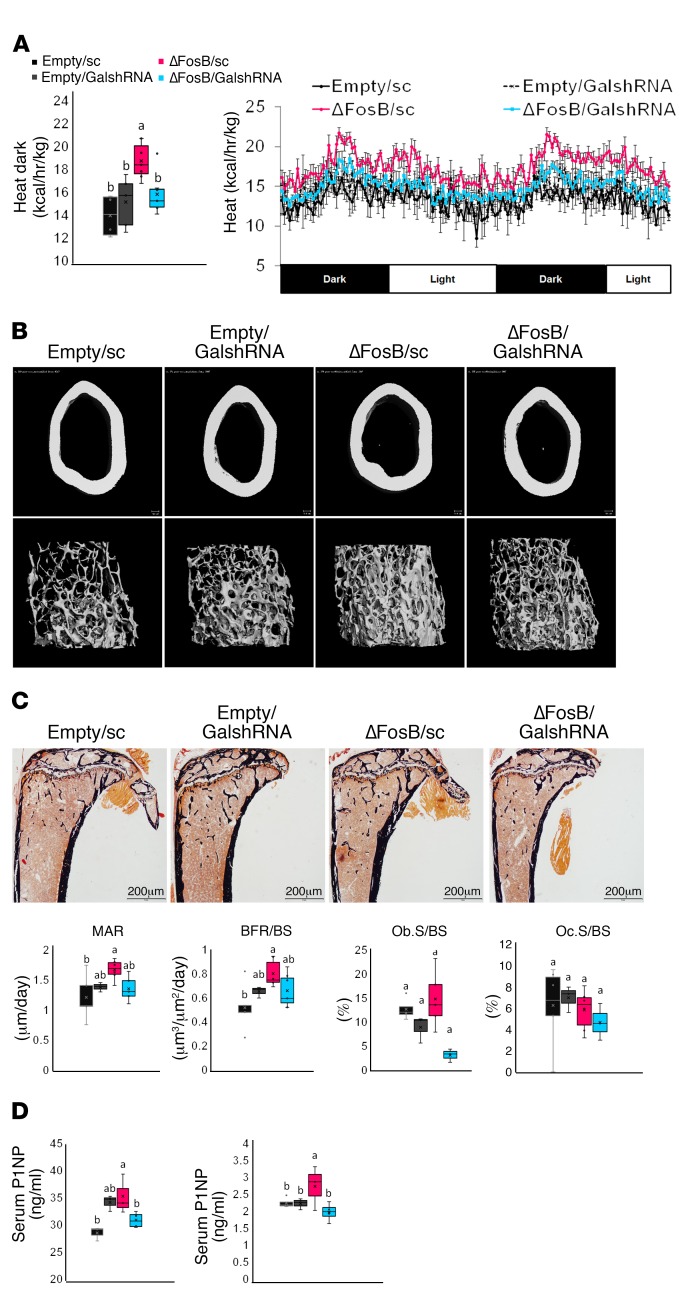
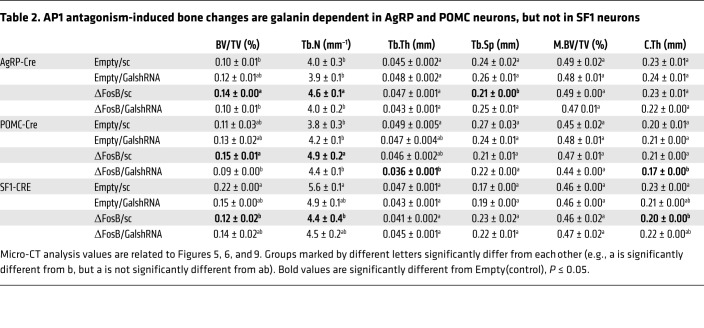
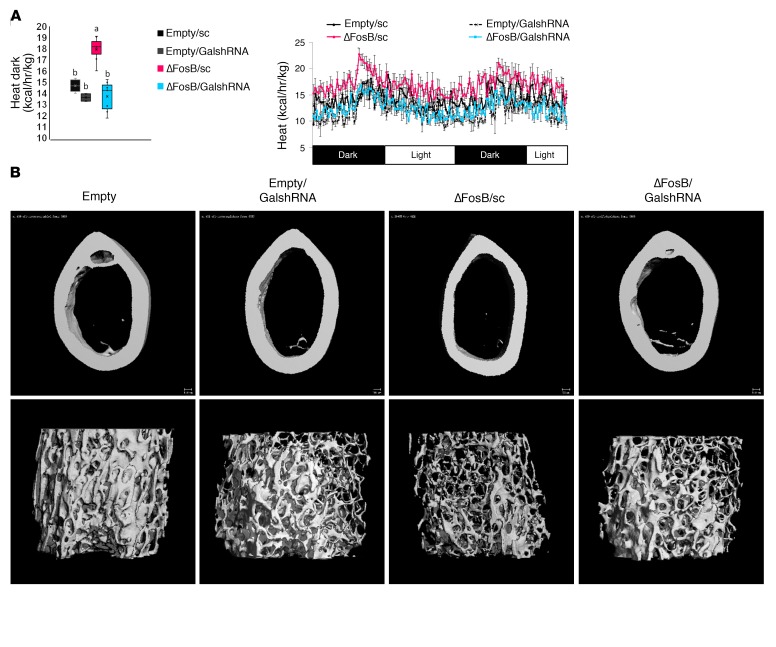
To assess the functional significance of hypothalamic galanin upregulation in response to ΔFosB we used 2 different models: (a) silencing of galanin with shRNA inserted in the same vectors that induce ΔFosB and (b) pharmacological blockade of galanin signaling. We used the same conditions as in the neuron-specific experiments, combining temporally and spatially targeted deletion of galanin in the CRE-expressing mice in the same LV vectors expressing ΔFosB. Since we did not find binding to the classical AP1 site on the galanin promoter, we positioned galanin shRNA under the non–CRE-inducible H1 promoter to restrict ΔFosB overexpression in only 1 CRE-selected neuron type but allow galanin silencing in any infected cell in the immediate environment of these specific neurons within the injected area, effectively preventing galanin-dependent communication between neurons within the VHT (Figure 5A). Three galanin shRNA sequences were tested for suppression efficiency and the most potent, galanin shRNA2 and shRNA3, were pooled for subsequent experiments (Figure 5, B and C). A scrambled shRNA (sc) sequence was incorporated into the empty vector (Empty/sc) or the ΔFosB vector (ΔFosB/sc), packaged into LVs, and used as a control. Testing these LVs in vivo using neuron-specific CRE mice revealed a comparable overexpression of ΔFosB and greater than 50% reduction in galanin mRNA levels (Supplemental Figure 12). Silencing of galanin at the site of ΔFosB overexpression (ΔFosB/GalshRNA compared with ΔFosB/sc) abolished the increase in energy expenditure in both AgRP (Figure 5D) and POMC (Figure 6A) neurons. GalshRNA prevented the decrease in glucose levels in the GTT and ITT seen with ΔFosB alone. Galanin silencing had opposing effects on insulin secretion, however, actually increasing insulin levels markedly beyond control levels in AgRP-CRE mice (Supplemental Figure 13A) while reducing insulin levels in POMC-CRE mice (Supplemental Figure 13B), confirming that ΔFosB-induced reduction in glucose stems from galanin effects on insulin sensitivity rather than on insulin levels. Most importantly, analysis of bone revealed that silencing of galanin concomitant with ΔFosB overexpression prevented the ΔFosB-driven increase in trabecular BV/TV in both AgRP and POMC neurons (Figure 5E, Figure 6B, and Table 2). Serum P1NP and CTX (Figure 5G and Figure 6D) showed that the effects of ΔFosB on bone formation and resorption were galanin sensitive in both AgRP and POMC neurons, despite the fact that these 2 parameters were affected in opposite directions by these 2 neurons. Histomorphometric measurements showed similar trends (Figure 5F and Figure 6C).
Figure 5. Silencing of galanin in the VHT of AgRP-CRE mice prevents ΔFosB-induced elevation of energy metabolism and bone density in AgRP neurons.
(A) CRE-inducible FLAG-tagged ΔFosB pTomo or empty pTomo constructs were modified to incorporate the H1 promoter and scrambled or galanin shRNA. These constructs were packaged into LVs and stereotactically delivered to VHT of 6- to 7-week-old male neuronal promoter AgRP-CRE mice for simultaneous ΔFosB expression and galanin silencing in selected neurons. Energy metabolism and bone were analyzed 6 weeks after surgery. (B) Real-time PCR and Western blot validation of galanin mRNA and protein suppression in the mHypoE 42 hypothalamic cell line transfected and selected with G418 for stable expression of modified constructs (n = 4). (C) Western blot validation of ΔFosB protein overexpression in the presence of CRE using the mHypoE 42 cell line transfected with modified constructs (n = 3). (D) Calorimetric analysis of metabolism. (E) Micro-CT analysis of femurs (see Table 2 for values). (F) Histomorphometric analysis of tibiae. (G) Serum P1NP and CTX. Statistical analysis included ANOVA followed by Tukey-Kramer HSD test comparing 4 groups (n = 6–9), *P < 0.05. Groups marked by different letters significantly differ from each other (e.g., a is significantly different from b, but a is not significantly different from ab).
Figure 6. Silencing of galanin in the VHT of POMC-CRE mice prevents ΔFosB-induced elevation of energy metabolism and bone density in POMC neurons.
CRE-inducible FLAG-tagged ΔFosB pTomo or empty pTomo constructs were modified to incorporate the H1 promoter and scrambled or galanin shRNA. These constructs were packaged into LVs and stereotactically delivered to VHTs of 6- to 7-week-old male neuronal promoter POMC-CRE mice for simultaneous ΔFosB expression and galanin silencing in selected neurons. Energy metabolism and bone were analyzed 6 weeks after surgery. (A) Calorimetric analysis of metabolism. (B) Micro-CT analysis of femurs (see Table 2 for values). (C) Histomorphometric analysis of tibiae. (D) Serum P1NP and CTX. Statistical analysis included ANOVA followed by Tukey-Kramer HSD test comparing 4 groups (n = 6–9), P < 0.05. Groups marked by different letters significantly differ from each other (e.g., a is significantly different from b, but a is not significantly different from ab).
Table 2. AP1 antagonism-induced bone changes are galanin dependent in AgRP and POMC neurons, but not in SF1 neurons.
Blockade of galanin receptors prevents a ΔFosB-induced increase in energy.
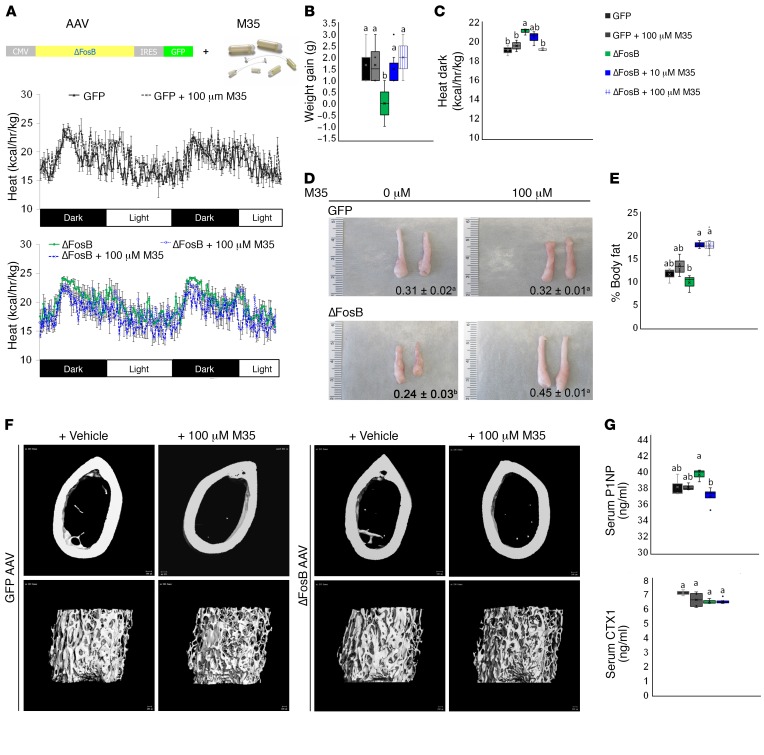
To mediate its effects, the neuropeptide galanin binds to postsynaptic receptors within the VHT. To confirm the role of galanin in mediating the metabolic and bone effects of ΔFosB, we pharmacologically blocked galanin receptors in the VHT. The pan-galanin receptor blocker M35 or vehicle were delivered i.c.v. into the third ventricle via osmotic pumps. The animals were simultaneously injected with ΔFosB AAV or GFP AAV, following our standard VHT stereotactic viral delivery protocol (Figure 7A). Based on the literature (31), the effects of M35 were assessed 2 weeks instead of 6 weeks later. Remarkably, blocking galanin receptors prevented a ΔFosB-induced increase in energy expenditure and reduction in weight gain and fat pad size (Figure 7, B–E). In contrast, control animals receiving 10 μM or 100 μM M35 in combination with GFP AAV showed no change in energy expenditure (Figure 7C) or in abdominal fat pad size (Figure 7, D and E). Of note, although the metabolic effects of AP1 antagonism can be observed as early as 2 weeks after LV injection (Supplemental Figure 8), the bone effects take longer (4–6 weeks) to be measurable. Accordingly, and given the young age and short time frame of the minipump i.c.v. protocol, the ΔFosB AAV–injected animals did not develop a high bone density. Although galanin receptor blockade downregulated BV/TV independent of ΔFosB, as shown by micro-CT analysis (Figure 7F and Table 3), the level of P1NP was significantly higher in ΔFosB mice than in ΔFosB mice treated with M35 (Figure 7G), suggesting that galanin receptor blockade prevents the effects of ΔFosB in the VHT on bone formation. Similarly, CTXs were not altered in this context (Figure 7G) although their values were elevated because younger mice have higher bone turnover (32). Overall, these studies provide support for the essential role of galanin in the central neuronal pathway responsible for the stimulation of energy metabolism and bone by AP1 antagonists.
Figure 7. Blockade of galanin receptors in the VHT of WT C57BL mice prevents ΔFosB-mediated increase in energy and reduces bone density.
(A) WT C57BL mice in which the VHTs were stereotactically injected with ΔFosB AAV or GFP AAV, and nonselective galanin receptor blocker M35 was delivered for a period of 2 weeks via intrascapularly positioned osmotic pump connected to third ventricle–implanted cannula. (B) Weight gain at 2 weeks after surgery. (C) Calorimetric analysis of energy expenditure. (D) Representative images of eWAT with average weight (grams). (E) Weight gain and percentage of body fat calculated from eWAT weight in relation to body weight. (F) Micro-CT analysis of femurs (see Table 3 for values). (G) Serum P1NP and CTX. Statistical analysis included ANOVA followed by Tukey-Kramer HSD test (n = 5–6), P < 0.05. Groups marked by different letters significantly differ from each other (e.g., a is significantly different from b, but a is not significantly different from ab).
Table 3. Blockade of galanin receptor signaling in VHT reduces bone mass.
AP1 antagonism in SF1 neurons increases energy and glucose metabolism but decreases bone density.
In contrast with the parallel increase in metabolic activity and bone density triggered by the overexpression of AP1 antagonists in either AgRP or POMC neurons, delivery of the same factors to SF1-expressing neurons in the VMH led to a complete dissociation of the metabolic and skeletal phenotypes. Whereas the energy metabolic profile was increased to a similar extent as with the other 4 neurons (Figure 8, A–D, and Supplemental Figure 4), ΔFosB expression in SF1-expressing neurons induced a marked reduction of trabecular bone mass driven by suppressed formation (P1NP) and elevated bone resorption (CTX) (Figure 8, E–G, and Table 1). Interestingly, although galanin silencing in these mice prevented the increase in metabolic activity (Figure 9A), it did not prevent the negative effects of ΔFosB on bone mass (Figure 9B).
Figure 8. ΔFosB in VMH SF-1 neurons elevates energy expenditure but reduces bone density.
The VHTs of male 6- to 7-week-old SF1-CRE mice were stereotactically injected with CRE-inducible ΔFosB or FosB LV, and metabolic and bone profiles were assessed 6 weeks after surgery. (A) Weight gain at 3 and 6 weeks. (B) Calorimetric analysis of energy expenditure. (C) Representative images of abdominal fat pads. (D) H&E-stained sections of abdominal fat pads. Values and graphs correspond to mean adipocyte area mean and distribution. (E) Micro-CT analysis of femurs (see Table 1 for values). (F) von Kossa staining of tibiae. (G) Serum P1NP and CTX. Statistical analysis included ANOVA followed by Tukey-Kramer HSD test (n = 6–9), P < 0.05. Groups marked by different letters significantly differ from each other (e.g., a is significantly different from b, but a is not significantly different from ab).
Figure 9. Silencing of galanin in the VHT of SF1-CRE mice prevents ΔFosB-induced elevation of energy metabolism in SF1 neurons, but does not prevent bone density reduction.
CRE-inducible FLAG-tagged ΔFosB pTomo or empty pTomo constructs were modified to incorporate the H1 promoter and scrambled or galanin shRNA, and delivered to the VHTs of male 6- to 7-week-old neuronal promoter SF1-CRE mice for simultaneous ΔFosB expression and galanin silencing. Energy metabolism and bone were analyzed 6 weeks after surgery. (A) Feeding and calorimetric analysis of energy expenditure. (B) Micro-CT analysis of bone (see Table 2 for values). Statistical analysis included ANOVA followed by Tukey-Kramer HSD test (n = 6–9), P < 0.05. Groups marked by different letters (a, b) significantly differ from each other.
Discussion
In this study, we used AP1 antagonism as a tool to identify the specific VHT neurons that regulate energy and bone in adult mice and determine whether (a) these neurons share the same or distinct functions, (b) energy, glucose, and bone controlling pathways are common at the level of VHT, and (c) the regulation of these functions is interrelated. We found that AP1 antagonism in either AgRP- or POMC-expressing neurons drives utilization of energy, with a calorimetric increase in heat production, glucose utilization, and a corresponding reduction in adiposity. Furthermore, AP1 antagonism in both neuron types also increased bone density, but the mechanisms leading to bone accrual differed. Bone formation was increased by both neuron types, whereas bone resorption was suppressed by AgRP-expressing neurons and enhanced by POMC-expressing neurons (Supplemental Figure 14). Although the expression of FosB often led to effects opposite to those of the AP1 antagonists, it sometimes had no effect, possibly due in part to the fact that FosB is further truncated to ΔFosB (28). Nevertheless, FosB never had effects similar to ΔFosB and the conclusion that the observed effects are due to AP1 antagonism is further supported by the consistent effects of Δ2ΔFosB and DNJunD, pure AP1 antagonists. Altogether, these results demonstrate that both neurons, predominantly expressed in the ARC, can regulate energy, glucose metabolism, and bone homeostasis in a coordinated manner in response to AP1 antagonists.
It has been suggested that changes in energy can influence glucose metabolism and bone homeostasis (24, 26, 33) and reciprocally, that bone remodeling can affect energy and glucose metabolism (34, 35). In contradiction to this concept, AP1 antagonists targeted to SF1-expressing neurons, predominantly present in the anatomically distinct VMH, demonstrated that in adult mice the changes in bone are not due to global changes in metabolism, since the same high metabolic state can be observed concurrently with either high bone mass, as seen with AgRP- or POMC-expressing neurons, or low bone mass, as seen with SF1 neurons. This important finding demonstrates that (a) within the VHT, VMH neurons regulate bone differently from ARC neurons and (b) the energy, glucose, and bone phenotypes are not ineluctably linked, either centrally or peripherally (i.e., the changes in bone remodeling and homeostasis are neither the cause nor the consequence of the changes in energy and/or glucose metabolism and vice versa). It should be pointed out that, as opposed to commonly used tools such as transgenic or knockout mice, which exhibit developmental adaptations, or optogenetics and chemogenetics, which exert short-term modulation of neuronal activity (seconds to hours) (36), we modulated AP1 signaling in adult mice over a period of 8 weeks, a time frame sufficient for the establishment of a new metabolic and bone steady state. It should also be noted that our approach, combining CRE-dependent genetics with anatomical targeting, resulted in a consistently reproducible phenotype in which AP1 LV VHT delivery was sufficient to drive both metabolism and bone formation, circumventing the variability often seen with purely anatomical targeting.
Given that AgRP- and POMC-expressing neurons were able to induce similar energy, glucose, and bone formation phenotypes, we searched for a common neuromediator and identified galanin as a mediator of the central effects of AP1 antagonists responsible for the shift toward catabolic energy and anabolic bone homeostasis. Although the changes in bone resorption differed between AgRP and POMC neurons, galanin silencing blocked these effects. In contrast, galanin silencing did not affect the bone effects of SF1 neurons, but it still was responsible for the increased energy and glucose metabolism.
One of the surprising findings of the present study is the fact that all of the 3 neurons we tested can exert similar effects on energy expenditure and glucose metabolism. However, the deviation from the seemingly opposite roles ascribed to orexigenic AgRP and anorexigenic POMC neurons has been noted before. For example, a recent study demonstrated a promoting (as opposed to a suppressing) effect of POMC neurons on feeding and energy conservation through the involvement of cannabinoids (37), an observation that may be relevant to ΔFosB, given its known effects on drug addiction (38). Likewise, a discrepancy exists between hypothalamic administration of CART peptide, shown to induce feeding behavior (39), and gene ablation and overexpression studies, confirming its anorexigenic role (40). In our models, AP1 antagonists exerted a common induction of energy catabolism. Thus, our data suggest that under certain conditions both AgRP-expressing and POMC-expressing neurons can be triggered to orchestrate an energy-burning state. It should also be noted that recent findings suggest that there is more overlap in the expression of these different neuromediators by individual neurons than previously thought (40). The possibility therefore exists that our neuromediator-CRE approach induced ΔFosB expression in more than 1 neuron type at the same time. Our immuno-cytochemistry and FACS and qPCR analysis (Figure 3G and Supplemental Figure 2), however, suggested that this would be a relatively limited rather than predominant situation.
The high energy metabolism was associated with high bone mass with AP1 antagonism in AgRP and POMC neurons but not in VMH neurons, suggesting that the bone controlling pathways differ at the level of hypothalamic nuclei. Our observations confirm the recently highlighted role of AgRP as a positive regulator of bone, increasing formation and suppressing resorption when activated, in part via the sympathetic nervous system (SNS) (22). Coresiding with AgRP is NPY, which acts as a negative regulator of bone mass based on the observation that germline deletion increased bone volume (41). Given the apparently divergent roles of AgRP and NPY, it should be noted that the effect of neuropeptides often differs from the effect of intact neurons. Global deletion of either AgRP or NPY neuropeptides has negligible effects on feeding and weight (42), whereas full ablation of AgRP or NPY neurons leads to starvation (43), indicating that neuronal activity rather than neuropeptide expression is important for feeding regulation.
The melanocortin 4 receptor (MC4R), which binds a product of POMC cleavage, α-melanocortin stimulating hormone (α-MSH), was shown to exert a contrastingly negative regulation of bone mass in mice and humans (26, 44). On the other hand, CART, which coresides with POMC, was shown to act as a positive regulator of bone, mediating the central action of fat-derived leptin via suppression of osteoclastogenesis (26). Unlike AgRP and NPY, CART was shown to mediate leptin’s action on bone in an SNS-independent manner (23). Deletion of CART alleles in MC4R-null mice corrected the bone but not the metabolic phenotype (43), supporting our conclusion that these 2 phenotypes are not always linked.
An important finding in the present study is the identification of the role of central galanin in the regulation of bone. While the involvement of galanin in metabolic regulation has been addressed before, the present study is to our knowledge the first to show that galanin can act centrally to regulate bone mass. Independent from our demonstration of a role of galanin expression within the VHT in bone homeostasis, some studies have suggested a peripheral role of galanin in bone. Galanin was observed in neurons and in the bone of mouse embryos, suggesting that it is involved in bone development (44). Galanin and GalR1 were also detected in normal bone, and higher galanin plasma levels were seen during bone repair (45). Galanin, GalR2, and GalR3 were also shown in bone marrow mesenchymal cells (46). Finally, administration of the galanin agonist galnon improved cortical bone in healthy mice but unexpectedly exacerbated bone loss in the ovariectomized model of osteoporosis (47). Thus, galanin appears to play a role in the bone micro-environment, possibly explaining the mild bone phenotype we observed in the M35-treated mice. In contrast to these studies, we demonstrate here that central galanin-mediated signals originating from the brain are required to mediate the increase in energy expenditure, improved glucose metabolism, and bone accrual following AP1 antagonism in the VHT. Interestingly, while ΔFosB-induced bone gain is galanin dependent in both AgRP and POMC neurons, the mechanisms appear to differ, suggesting that central galanin can modulate both bone resorption and bone formation in favor of a net bone gain, depending on the neuron involved.
Beyond neuronal control, galanin also regulates the activity of the anterior and posterior (48) pituitary, where it affects the secretion of oxytocin and AVP. Both anterior and posterior pituitary hormones can regulate energy homeostasis and bone (49). Intriguingly, oxytocin- or oxytocin receptor–deficient mice exhibit severe obesity and osteopenia (50), and our microarray analysis identified galanin and its downstream pituitary hormones as the most enhanced mRNAs in hypothalami from AP1 antagonized mice. Further studies will be required to distinguish the neuronal versus endocrine function of galanin in the control of energy metabolism and bone.
From a translational perspective, research into the underpinnings of the obesity epidemic highlighted the pivotal role played by the CNS in the regulation of energy and glucose homeostasis in humans. This has become evident from work demonstrating that neuronal populations within the hypothalamus are not uniform and consist of clustered cells that may have opposing properties (51). Our studies provide further support for that tenet and underline the importance of galanin as a putative mediator of energy-regulating processes. The CNS has also been experimentally tied to the bidirectional regulation of skeletal remodeling and substrate utilization. Here we show that subpopulations of hypothalamic neurons may also have distinct functions in regard to skeletal metabolism in mice. Human studies, primarily epidemiologic in nature, have shown conflicting results in terms of the relative importance of the CNS or the SNS in bone acquisition or maintenance, although use of some centrally acting drugs has been associated with low bone mass and fractures (52–54). This could be related in part to the relative complexity of regulatory circuits, the pharmacology of centrally acting agents, and as noted here, the heterogeneity in distinct neuronal subpopulations that ultimately mediate these effects. Our studies underline the fact that if the CNS regulates both energy and skeletal homeostasis, the 2 are not ineluctably linked. Galanin is also thought to be involved in several chronic diseases associated with aging yet no link has been previously established with osteoporosis. Since galanin receptor blockers are currently tested for a variety of indications, including addiction, pain, and epilepsy (9, 55), the information provided here that they may also affect bone metabolism is of potential clinical importance and may shed some light on these medically relevant questions.
Methods
An expanded Methods section is in the supplemental material.
Stereotactic viral transfer of AP1 factors into VHT of mice and calorimetric assessment.
C57BL, AgRP-CRE (56), POMC-CRE (57), SF1-CRE (7), and R26R-Brainbow2.1 (58) mice were purchased from The Jackson Laboratories. For all studies, 6- to 7-week-old males were anesthetized and positioned into stereotactic frame (David Kopf Instruments). Bilateral holes were drilled in the scull using the following coordinates: AP, 2.0; DV, from –5.7 to 6.0; LAT, 1.2 at 10° angle. A viral volume of 0.5 μL AVV or 0.75 μL LV (virus titer 1 × 10⁸ IFU/ml) was delivered on each side using a Hamilton syringe at a rate of 0.5 μL/min. Animals were allowed to recover and analyzed 6 weeks after surgery, unless stated otherwise. Metabolic parameters were assessed using the paramagnetic oxygen sensor–equipped Comprehensive Lab Animal Monitoring System (CLAMS, Columbus Instruments) for the measurement of energy expenditure and locomotion. Mice were allowed ad libitum access to food and water, with simultaneous monitoring of up to 8 animals. DXA was measured with In Vivo MS FX PRO (Bruker).
Evaluation of bone density by micro-CT, histomorphometry, and serum P1NP and CTX.
For micro-CT, femurs were removed and placed in 70% ethanol until scanning by SCANCO μ-CT35 (outsourced to Harvard School of Dental Medicine). Scans were conducted with an isotropic voxel size of 7 mm, x-ray tube potential of 70 kVP, an x-ray intensity of 0.145 mA, and an integration time of 600 ms per tomographic projection. From the scans, a region starting 280 μm proximal to the distal femoral growth plate and extending trabecular bone 2.1 mm was selected for trabecular bone analysis. A Gaussian filter using a fixed threshold at 26% of maximal grayscale value was applied to the femur images. Three-dimensional images were reconstructed from the 2-dimensional images from the contoured regions. For bone density, tibiae were removed, fixed in 4% formaldehyde, then infiltrated with a mixture of 90% methyl methacrylate (Sigma-Aldrich), 10% dibutyl phthalate (Sigma-Aldrich), and 0.15% benzoyl peroxide (Polyscience) at 4°C. Tibiae were then embedded in a mixture composed of 85% methyl methacrylate (Sigma-Aldrich), 15% dibutyl phthalate (Sigma-Aldrich), and 0.05% benzoyl peroxide (Polyscience). Polymerization was performed at 37°C. Standard undecalcified sections (4 μm) were prepared using a Reichert-Jung microtome (Cambridge Scientific) and were stained with von Kossa. Quantitative bone histomorphometric measurements were performed according to standardized protocols using the OsteoMeasure system (OsteoMetrics). Serum P1NP and CTX were measured using commercial kits according to the manufacturer’s instructions (Immunodiagnostic Systems).
Microarray and molecular pathway analysis.
Hypothalami from transgenic ENO2-ΔFosB (littermate WT control) and C57BL mice injected with ΔFosB AAV or GFP AVV control were dissected 2 weeks after injection, snap frozen in liquid nitrogen, and subjected to RNA extraction (n = 2 each group). Analysis was performed by the Dana Farber Microarray Core Facility using the Affymetrix Mouse Genome 430 2.0 platform (ThermoFisher Scientific). Quality control, normalization, and expression values were analyzed by Affymetrix Expression Console (ThermoFisher Scientific). Ingenuity Pathway Analysis (IPA) software (Qiagen) was used to analyze molecular pathways from the established fold-change values. Heatmap was generated using Gene-E software (Broad Institute). All original microarray data were deposited in the NCBI’s Gene Expression Omnibus database (GEO GSE111028).
Statistics.
All data are expressed as mean ± SD. Due to larger inter-animal variability, feeding and locomotion are expressed as mean ± SEM. The significance of differences between groups was determined using JMP 8.0 Statistical Discovery Software (SAS Institute 2000) by 1-way ANOVA, followed by Tukey-Kramer honest significant difference (HSD) test. Differences were considered significant at P < 0.05. Groups marked by different letters significantly differ from each other (e.g., a is significantly different from b, but a is not significantly different from ab). Student t test (1-tailed) was used only when 2 groups were compared (treatment vs. control) in GTT, ITT, qPCR, ChIP, and galanin-luciferase assays, as denoted by *P < 0.05 and **P < 0.01.
Study approval.
All animal studies were approved by the Harvard University IACUC.
Author contributions
AI designed the study, conducted stereotactic experiments, built constructs, and wrote the manuscript. KS designed and conducted glucose studies. KN performed bone histomorphometry. FG and GR acted as scientific advisers and helped write the manuscript. RB acted as principal investigator and created the overall design of the study, gave scientific guidance, interpreted data, and wrote the manuscript.
Supplementary Material
Acknowledgments
This work was funded by a grant (AG-040222) from the NIH National Institute on Aging to RB. AI was the recipient of a Dean Scholarship from the Harvard School of Dental Medicine. The authors are grateful to Eric Nestler (Mount Sinai Icahn School of Medicine) for his advice and help with stereotactic experiments, Yoshinori Onishi (Fukuoka University) and Yusaku Nakabbepu (Kyushu University) for their help and for providing the UFosB mouse, and to Cliff Rosen (Maine Medical Research Center) for critically reading the manuscript.
Version 1. 03/29/2018
In-Press Preview
Version 2. 05/14/2018
Electronic publication
Version 3. 05/15/2018
Corrected error in supplemental data.
Version 4. 05/23/2018
Corrected figure 6B.
Version 5. 06/01/2018
Print issue publication
Footnotes
Conflict of interest: The authors have declared that no conflict of interest exists.
Reference information: J Clin Invest. 2018;128(6):2626–2641.https://doi.org/10.1172/JCI99350.
Contributor Information
Anna Idelevich, Email: anna_idelevich@hsdm.harvard.edu.
Kazusa Sato, Email: mutokazusa@gmail.com.
Kenichi Nagano, Email: kenichi_nagano@hsdm.harvard.edu.
Glenn Rowe, Email: gcrowe@uab.edu.
Francesca Gori, Email: francesca_gori@hsdm.harvard.edu.
Roland Baron, Email: roland_baron@hsdm.harvard.edu.
References
- 1.Waterson MJ, Horvath TL. Neuronal regulation of energy homeostasis: beyond the hypothalamus and feeding. Cell Metab. 2015;22(6):962–970. doi: 10.1016/j.cmet.2015.09.026. [DOI] [PubMed] [Google Scholar]
- 2.Dietrich MO, Horvath TL. Hypothalamic control of energy balance: insights into the role of synaptic plasticity. Trends Neurosci. 2013;36(2):65–73. doi: 10.1016/j.tins.2012.12.005. [DOI] [PubMed] [Google Scholar]
- 3.Luquet S, Perez FA, Hnasko TS, Palmiter RD. NPY/AgRP neurons are essential for feeding in adult mice but can be ablated in neonates. Science. 2005;310(5748):683–685. doi: 10.1126/science.1115524. [DOI] [PubMed] [Google Scholar]
- 4.Aponte Y, Atasoy D, Sternson SM. AGRP neurons are sufficient to orchestrate feeding behavior rapidly and without training. Nat Neurosci. 2011;14(3):351–355. doi: 10.1038/nn.2739. [DOI] [PMC free article] [PubMed] [Google Scholar]
- 5.Betley JN, et al. Neurons for hunger and thirst transmit a negative-valence teaching signal. Nature. 2015;521(7551):180–185. doi: 10.1038/nature14416. [DOI] [PMC free article] [PubMed] [Google Scholar]
- 6.Chen Y, Lin YC, Kuo TW, Knight ZA. Sensory detection of food rapidly modulates arcuate feeding circuits. Cell. 2015;160(5):829–841. doi: 10.1016/j.cell.2015.01.033. [DOI] [PMC free article] [PubMed] [Google Scholar]
- 7.Dhillon H, et al. Leptin directly activates SF1 neurons in the VMH, and this action by leptin is required for normal body-weight homeostasis. Neuron. 2006;49(2):191–203. doi: 10.1016/j.neuron.2005.12.021. [DOI] [PubMed] [Google Scholar]
- 8.Wu Z, Autry AE, Bergan JF, Watabe-Uchida M, Dulac CG. Galanin neurons in the medial preoptic area govern parental behaviour. Nature. 2014;509(7500):325–330. doi: 10.1038/nature13307. [DOI] [PMC free article] [PubMed] [Google Scholar]
- 9.Lang R, et al. Physiology, signaling, and pharmacology of galanin peptides and receptors: three decades of emerging diversity. Pharmacol Rev. 2015;67(1):118–175. doi: 10.1124/pr.112.006536. [DOI] [PubMed] [Google Scholar]
- 10.Barson JR, Morganstern I, Leibowitz SF. Similarities in hypothalamic and mesocorticolimbic circuits regulating the overconsumption of food and alcohol. Physiol Behav. 2011;104(1):128–137. doi: 10.1016/j.physbeh.2011.04.054. [DOI] [PMC free article] [PubMed] [Google Scholar]
- 11.Sabatakos G, et al. Overexpression of ΔFosB transcription factor(s) increases bone formation and inhibits adipogenesis. Nat Med. 2000;6(9):985–990. doi: 10.1038/79683. [DOI] [PubMed] [Google Scholar]
- 12.Kveiborg M, et al. DeltaFosB induces osteosclerosis and decreases adipogenesis by two independent cell-autonomous mechanisms. Mol Cell Biol. 2004;24(7):2820–2830. doi: 10.1128/MCB.24.7.2820-2830.2004. [DOI] [PMC free article] [PubMed] [Google Scholar]
- 13.Rowe GC, et al. Energy expenditure and bone formation share a common sensitivity to AP-1 transcription in the hypothalamus. J Bone Miner Res. 2012;27(8):1649–1658. doi: 10.1002/jbmr.1618. [DOI] [PMC free article] [PubMed] [Google Scholar]
- 14.Rowe GC, Choi CS, Neff L, Horne WC, Shulman GI, Baron R. Increased energy expenditure and insulin sensitivity in the high bone mass ΔFosB transgenic mice. Endocrinology. 2009;150(1):135–143. doi: 10.1210/en.2008-0678. [DOI] [PMC free article] [PubMed] [Google Scholar]
- 15.Sabatakos G, et al. Doubly truncated FosB isoform (Δ2ΔFosB) induces osteosclerosis in transgenic mice and modulates expression and phosphorylation of Smads in osteoblasts independent of intrinsic AP-1 activity. J Bone Miner Res. 2008;23(5):584–595. doi: 10.1359/jbmr.080110. [DOI] [PMC free article] [PubMed] [Google Scholar]
- 16.McClung CA, Nestler EJ. Regulation of gene expression and cocaine reward by CREB and ΔFosB. Nat Neurosci. 2003;6(11):1208–1215. doi: 10.1038/nn1143. [DOI] [PubMed] [Google Scholar]
- 17.Wellen KE, Hotamisligil GS. Inflammation, stress, and diabetes. J Clin Invest. 2005;115(5):1111–1119. doi: 10.1172/JCI25102. [DOI] [PMC free article] [PubMed] [Google Scholar]
- 18.Joo JY, Schaukowitch K, Farbiak L, Kilaru G, Kim TK. Stimulus-specific combinatorial functionality of neuronal c-fos enhancers. Nat Neurosci. 2016;19(1):75–83. doi: 10.1038/nn.4170. [DOI] [PMC free article] [PubMed] [Google Scholar]
- 19.Karsenty G, Olson EN. Bone and muscle endocrine functions: unexpected paradigms of inter-organ communication. Cell. 2016;164(6):1248–1256. doi: 10.1016/j.cell.2016.02.043. [DOI] [PMC free article] [PubMed] [Google Scholar]
- 20.Baldock PA, et al. Hypothalamic control of bone formation: distinct actions of leptin and y2 receptor pathways. J Bone Miner Res. 2005;20(10):1851–1857. doi: 10.1359/JBMR.050523. [DOI] [PubMed] [Google Scholar]
- 21.Allison SJ, et al. Conditional deletion of hypothalamic Y2 receptors reverts gonadectomy-induced bone loss in adult mice. J Biol Chem. 2006;281(33):23436–23444. doi: 10.1074/jbc.M604839200. [DOI] [PubMed] [Google Scholar]
- 22.Kim JG, et al. AgRP neurons regulate bone mass. Cell Rep. 2015;13(1):8–14. doi: 10.1016/j.celrep.2015.08.070. [DOI] [PMC free article] [PubMed] [Google Scholar]
- 23.Karsenty G. Convergence between bone and energy homeostases: leptin regulation of bone mass. Cell Metab. 2006;4(5):341–348. doi: 10.1016/j.cmet.2006.10.008. [DOI] [PubMed] [Google Scholar]
- 24.Takeda S, et al. Leptin regulates bone formation via the sympathetic nervous system. Cell. 2002;111(3):305–317. doi: 10.1016/S0092-8674(02)01049-8. [DOI] [PubMed] [Google Scholar]
- 25.Yadav VK, et al. A serotonin-dependent mechanism explains the leptin regulation of bone mass, appetite, and energy expenditure. Cell. 2009;138(5):976–989. doi: 10.1016/j.cell.2009.06.051. [DOI] [PMC free article] [PubMed] [Google Scholar]
- 26.Elefteriou F, et al. Leptin regulation of bone resorption by the sympathetic nervous system and CART. Nature. 2005;434(7032):514–520. doi: 10.1038/nature03398. [DOI] [PubMed] [Google Scholar]
- 27.Singh MK, Elefteriou F, Karsenty G. Cocaine and amphetamine-regulated transcript may regulate bone remodeling as a circulating molecule. Endocrinology. 2008;149(8):3933–3941. doi: 10.1210/en.2008-0109. [DOI] [PMC free article] [PubMed] [Google Scholar]
- 28.Alibhai IN, Green TA, Potashkin JA, Nestler EJ. Regulation of fosB and DeltafosB mRNA expression: in vivo and in vitro studies. Brain Res. 2007;1143:22–33. doi: 10.1016/j.brainres.2007.01.069. [DOI] [PMC free article] [PubMed] [Google Scholar]
- 29.Ohnishi YN, et al. FosB is essential for the enhancement of stress tolerance and antagonizes locomotor sensitization by ΔFosB. Biol Psychiatry. 2011;70(5):487–495. doi: 10.1016/j.biopsych.2011.04.021. [DOI] [PMC free article] [PubMed] [Google Scholar]
- 30.Anouar Y, Lee HW, Eiden LE. Both inducible and constitutive activator protein-1-like transcription factors are used for transcriptional activation of the galanin gene by different first and second messenger pathways. Mol Pharmacol. 1999;56(1):162–169. doi: 10.1124/mol.56.1.162. [DOI] [PubMed] [Google Scholar]
- 31.Liu HX, et al. Receptor subtype-specific pronociceptive and analgesic actions of galanin in the spinal cord: selective actions via GalR1 and GalR2 receptors. Proc Natl Acad Sci U S A. 2001;98(17):9960–9964. doi: 10.1073/pnas.161293598. [DOI] [PMC free article] [PubMed] [Google Scholar]
- 32.Boskey AL, Coleman R. Aging and bone. J Dent Res. 2010;89(12):1333–1348. doi: 10.1177/0022034510377791. [DOI] [PMC free article] [PubMed] [Google Scholar]
- 33.Fulzele K, et al. Insulin receptor signaling in osteoblasts regulates postnatal bone acquisition and body composition. Cell. 2010;142(2):309–319. doi: 10.1016/j.cell.2010.06.002. [DOI] [PMC free article] [PubMed] [Google Scholar]
- 34.Lee NK, et al. Endocrine regulation of energy metabolism by the skeleton. Cell. 2007;130(3):456–469. doi: 10.1016/j.cell.2007.05.047. [DOI] [PMC free article] [PubMed] [Google Scholar]
- 35.Ferron M, et al. Insulin signaling in osteoblasts integrates bone remodeling and energy metabolism. Cell. 2010;142(2):296–308. doi: 10.1016/j.cell.2010.06.003. [DOI] [PMC free article] [PubMed] [Google Scholar]
- 36.Sternson SM, Atasoy D, Betley JN, Henry FE, Xu S. An Emerging Technology Framework for the Neurobiology of Appetite. Cell Metab. 2016;23(2):234–253. doi: 10.1016/j.cmet.2015.12.002. [DOI] [PubMed] [Google Scholar]
- 37.Koch M, et al. Hypothalamic POMC neurons promote cannabinoid-induced feeding. Nature. 2015;519(7541):45–50. doi: 10.1038/nature14260. [DOI] [PMC free article] [PubMed] [Google Scholar]
- 38.Nestler EJ. ΔFosB: a transcriptional regulator of stress and antidepressant responses. Eur J Pharmacol. 2015;753:66–72. doi: 10.1016/j.ejphar.2014.10.034. [DOI] [PMC free article] [PubMed] [Google Scholar]
- 39.Smith KL, et al. Overexpression of CART in the PVN increases food intake and weight gain in rats. Obesity (Silver Spring) 2008;16(10):2239–2244. doi: 10.1038/oby.2008.366. [DOI] [PubMed] [Google Scholar]
- 40.Lau J, Herzog H. CART in the regulation of appetite and energy homeostasis. Front Neurosci. 2014;8:313. doi: 10.3389/fnins.2014.00313. [DOI] [PMC free article] [PubMed] [Google Scholar]
- 41.Baldock PA, et al. Neuropeptide Y knockout mice reveal a central role of NPY in the coordination of bone mass to body weight. PLoS One. 2009;4(12):e8415. doi: 10.1371/journal.pone.0008415. [DOI] [PMC free article] [PubMed] [Google Scholar]
- 42.Qian S, et al. Neither agouti-related protein nor neuropeptide Y is critically required for the regulation of energy homeostasis in mice. Mol Cell Biol. 2002;22(14):5027–5035. doi: 10.1128/MCB.22.14.5027-5035.2002. [DOI] [PMC free article] [PubMed] [Google Scholar]
- 43.Ahn JD, Dubern B, Lubrano-Berthelier C, Clement K, Karsenty G. Cart overexpression is the only identifiable cause of high bone mass in melanocortin 4 receptor deficiency. Endocrinology. 2006;147(7):3196–3202. doi: 10.1210/en.2006-0281. [DOI] [PubMed] [Google Scholar]
- 44.Xu ZQ, Shi TJ, Hökfelt T. Expression of galanin and a galanin receptor in several sensory systems and bone anlage of rat embryos. Proc Natl Acad Sci U S A. 1996;93(25):14901–14905. doi: 10.1073/pnas.93.25.14901. [DOI] [PMC free article] [PubMed] [Google Scholar]
- 45.McDonald AC, Schuijers JA, Gundlach AL, Grills BL. Galanin treatment offsets the inhibition of bone formation and downregulates the increase in mouse calvarial expression of TNF-α and GalR2 mRNA induced by chronic daily injections of an injurious vehicle. Bone. 2007;40(4):895–903. doi: 10.1016/j.bone.2006.10.018. [DOI] [PubMed] [Google Scholar]
- 46.Louridas M, Letourneau S, Lautatzis ME, Vrontakis M. Galanin is highly expressed in bone marrow mesenchymal stem cells and facilitates migration of cells both in vitro and in vivo. Biochem Biophys Res Commun. 2009;390(3):867–871. doi: 10.1016/j.bbrc.2009.10.064. [DOI] [PubMed] [Google Scholar]
- 47.McGowan HW, Schuijers JA, Grills BL, McDonald SJ, McDonald AC. Galnon, a galanin receptor agonist, improves intrinsic cortical bone tissue properties but exacerbates bone loss in an ovariectomised rat model. J Musculoskelet Neuronal Interact. 2014;14(2):162–172. [PubMed] [Google Scholar]
- 48.Wodowska J, Ciosek J. Galanin and galanin-like peptide modulate vasopressin and oxytocin release in vitro: the role of galanin receptors. Neuropeptides. 2014;48(6):387–397. doi: 10.1016/j.npep.2014.10.005. [DOI] [PubMed] [Google Scholar]
- 49.Doherty AH, Florant GL, Donahue SW. Endocrine regulation of bone and energy metabolism in hibernating mammals. Integr Comp Biol. 2014;54(3):463–483. doi: 10.1093/icb/icu001. [DOI] [PMC free article] [PubMed] [Google Scholar]
- 50.Tamma R, et al. Oxytocin is an anabolic bone hormone. Proc Natl Acad Sci U S A. 2009;106(17):7149–7154. doi: 10.1073/pnas.0901890106. [DOI] [PMC free article] [PubMed] [Google Scholar]
- 51.Timper K, Brüning JC. Hypothalamic circuits regulating appetite and energy homeostasis: pathways to obesity. Dis Model Mech. 2017;10(6):679–689. doi: 10.1242/dmm.026609. [DOI] [PMC free article] [PubMed] [Google Scholar]
- 52.Warden SJ, Fuchs RK. Do selective serotonin reuptake inhibitors (SSRIs) cause fractures? Curr Osteoporos Rep. 2016;14(5):211–218. doi: 10.1007/s11914-016-0322-3. [DOI] [PubMed] [Google Scholar]
- 53.Yang S, Nguyen ND, Center JR, Eisman JA, Nguyen TV. Association between beta-blocker use and fracture risk: the Dubbo Osteoporosis Epidemiology Study. Bone. 2011;48(3):451–455. doi: 10.1016/j.bone.2010.10.170. [DOI] [PubMed] [Google Scholar]
- 54.Veldhuis-Vlug AG, et al. The effects of beta-2 adrenergic agonist and antagonist on human bone metabolism: a randomized controlled trial. Bone. 2015;71:196–200. doi: 10.1016/j.bone.2014.10.024. [DOI] [PubMed] [Google Scholar]
- 55.Freimann K, Kurrikoff K, Langel Ü. Galanin receptors as a potential target for neurological disease. Expert Opin Ther Targets. 2015;19(12):1665–1676. doi: 10.1517/14728222.2015.1072513. [DOI] [PubMed] [Google Scholar]
- 56.Tong Q, Ye CP, Jones JE, Elmquist JK, Lowell BB. Synaptic release of GABA by AgRP neurons is required for normal regulation of energy balance. Nat Neurosci. 2008;11(9):998–1000. doi: 10.1038/nn.2167. [DOI] [PMC free article] [PubMed] [Google Scholar]
- 57.Balthasar N, et al. Leptin receptor signaling in POMC neurons is required for normal body weight homeostasis. Neuron. 2004;42(6):983–991. doi: 10.1016/j.neuron.2004.06.004. [DOI] [PubMed] [Google Scholar]
- 58.Livet J, et al. Transgenic strategies for combinatorial expression of fluorescent proteins in the nervous system. Nature. 2007;450(7166):56–62. doi: 10.1038/nature06293. [DOI] [PubMed] [Google Scholar]
Associated Data
This section collects any data citations, data availability statements, or supplementary materials included in this article.


