

Abstract
Increasing evidence suggests the presence of minor cell subpopulations in prostate cancer that are androgen independent and poised for selection as dominant clones after androgen-deprivation therapy. In this study, we investigated this phenomenon by stratifying cell subpopulations based on transcriptome profiling of 144 single LNCaP prostate cancer cells treated or untreated with androgen after cell cycle synchronization. Model-based clustering of 397 differentially expressed genes identified eight potential subpopulations of LNCaP cells, revealing a previously unappreciable level of cellular heterogeneity to androgen stimulation. One subpopulation displayed stem-like features with a slower cell doubling rate, increased sphere formation capability, and resistance to G2/M arrest induced by a mitosis inhibitor. Advanced growth of this subpopulation was associated with enhanced expression of 10 cell cycle-related genes (CCNB2, DLGAP5, CENPF, CENPE, MKI67, PTTG1, CDC20, PLK1, HMMR, and CCNB1) and decreased dependence upon androgen receptor signaling. In silico analysis of RNA-seq data from The Cancer Genome Atlas (TCGA) further demonstrated that concordant upregulation of these genes was linked to recurrent prostate cancers. Analysis of receiver-operating characteristic curves implicates aberrant expression of these genes and could be useful for early identification of tumors that subsequently develop biochemical recurrence. Moreover, this single-cell approach provides a better understanding of how prostate cancer cells respond heterogeneously to androgen-deprivation therapies and reveals characteristics of subpopulations resistant to this treatment.
Keywords: Prostate cancer, tumor heterogeneity, single-cell analysis and biochemical recurrence
Introduction
A major clinical challenge in the management of prostate cancer is overcoming resistance to androgen-deprivation therapy (ADT) (1, 2). Although ADT can initially achieve a biochemical response in recurrent prostate cancer, ~30% of patients eventually develop castration resistance and succumb to the disease (3). Intensive studies have focused on understanding the mechanisms involved in the transition of prostate cancer from an androgen-dependent to an -independent state. At the molecular level, castration resistance is linked to mutations or amplification of the androgen receptor (AR) gene, augmented intracellular AR signaling, and activation of other growth factor-signaling pathways (4). These findings provide the rationale for the development of novel agents that target AR and non-AR signaling in recurrent prostate cancer. At the cellular level, however, it is less clear how androgen-responsive prostate cancer cells evolve through ADT selection into androgen-independent tumors.
Prostate cancer cell evolution may fit the following two models - stepwise and punctuated selection (5). The stepwise selection indicates that a single cell (or clone) that acquires an AR mutation initially has a proliferative advantage under androgen deprivation conditions. Subsequently, a new derivative subline accumulates additional intracellular AR or other oncogenic activating pathways that prevails in overtaking the original cancer cell population (6, 7). The selective outgrowth occurs each time when a new subline arises with proliferative advantages over the previous one, leading to advanced cancer development. This stepwise expansion model was used to explain the acquisition of an androgen-independent subline through the androgen-sensitive LNCaP parental line under a prolonged androgen-deprivation condition (8–10). However, increasing evidence supports the punctuated model for the development of androgen-independent prostate cancer. In the latter model, the phylogeny of cancer cells is not strictly linear, and numerous subgroups stochastically arise and coexist within a population at the same time, to different degrees of magnitude, each with its own set of molecular alterations (11). If indeed the punctuated model is further supported, the androgen-dependent parental line could contain multiple pre-existing subpopulations of cells that exhibit a wide range of androgen sensitivity. Through ADT selection and clonal expansion, a subgroup of androgen-insensitive cells may eventually develop to overtake the entire population. Therefore, subpopulation stratification of different prostate cancer cells is critical not only for predicting early development of castration-resistant cancer, but also for providing valuable information for the design of targeted inhibitors to treat this disease.
In previous in vitro experimental models, the androgen-deprivation strategy has been used to select for androgen-insensitive cell types as a way to reveal heterogeneous populations of prostate cancer cells (8, 9). The limitation of this approach is that it does not take into consideration the spectrum of differential androgen sensitivity in the original cell population prior to androgen-deprivation treatment. In this study, we used a novel approach to determine whether multiple subpopulations are present in the LNCaP cell line by analyzing the cells’ differential sensitivity to androgen stimulation. First, we compared single-cell transcriptome profiles of androgen-stimulated and -unstimulated LNCaP cells following cell-cycle synchronization. In addition to stratifying different subpopulations that vary in their dependence upon androgens, we identified a stem-like subpopulation that has the potential to develop androgen-independence. The growth of this previously uncharacterized subpopulation of cells appeared to depend more on a cell-cycle transcription network and less on androgen signaling. Our findings underscore the importance of analyzing dynamic single-cell transcriptome profiles that can lead to the identification of hidden subpopulations intrinsic to androgen-independence in an androgen-responsive prostate tumor.
Materials and Methods
Cell lines
LNCaP cells obtained from ATCC along with their derived subclone (i.e., 8.1) were cultured in RPMI 1640 (Life Technologies) with 10% charcoal-stripped fetal bovine serum (CS-FBS; Sigma) and 1% penicillin/streptomycin (GIBCO) aired with 5% CO2 at 37°C. The cells were not authenticated. The absence of mycoplasma contamination was validated using DAPI staining.
Single-cell expression analysis of candidate genes
To investigate heterogeneous responses of LNCaP cells to androgen, these cells were androgen-deprived and cultured in phenol free medium (GIBCO), 10% CS-FBS (Sigma, F6765) and 1% Penicillin/Streptomycin ~24 hr prior to androgen treatment. The cells were treated with 1 nM R1881 (R0908, Sigma-Aldrich) for 0, 6, 12, 24, 48, and 72 hr. The single cells were isolated and subjected to qRT-PCR carried out as described previously (12). Single cells from another prostate cancer line PC3 were similarly isolated for qRT-PCR analysis. Primers of candidate genes are shown in Supplementary Table S1.
Single-cell and bulk RNA-seq
LNCaP cells were synchronized in the G1/S-phase by double thymidine block (13). Approximately 4×10⁵ cells were seeded in full medium for 12 hr and then 2 mM thymidine was added for 18 hr. The medium was replaced again with CS-FBS for 9 hr and then 2 mM thymidine was added for 17 hr. The cells were then subjected to 1 nM R1881 treatment for 12 hr. The cells were trypsinized and washed once in PBS and suspended in 1:1 CS-FBS medium/1× PBS. The cells were isolated manually for SMART-seq2 (14). The expected DNA fragment sizes for quality control were one normal distribution of cDNA centered at ~1.8-kb post-reverse-transcription and -cDNA-amplification and the other normal distribution of DNA between 300 to 900-bp post-tagmentation and -index-PCR. We analyzed the single-cell transcriptomes of 3 groups of LNCaP cells after cell-cycle synchronization: 1) untreated at 0 hr, 2) untreated at 12 hr and 3) androgen treated for 12 hr. Bulk-cell RNA was harvested with TRIzol Reagent (15596026, Thermo Fisher) then isolated with the Direct-zol RNA MiniPrep Kit (R2052, Zymo Research). The RNA was diluted to 1 ng/μl and 1 ng was amplified using the same amplification and quality control steps as for single cells (described above).
Cell cycle analysis
After double thymidine block, LNCaP cells were cultured in CS-FBS or subjected to androgen treatment (as described above). Cells were washed with 1× PBS, centrifuged, fixed with 70% ethanol, and then stained with propidium iodide according to an established protocol (15). Then the cells cell cycle was analyzed on a BD FACS Calibur.
Gene expression profiling and pathway analysis
The sequence reads were aligned with TopHat and the read counts were calculated with HTSeq (16–18). The low expressed genes (reads <10), cells with only a few genes detected (genes <180), and insufficiently represented genes (genes found in <5 cells) were removed from the read count data. Then, the batch effect was adjusted and the differentially expressed genes were identified using the SCDE package from R (19). The probabilities of the observed overlaps occurring by chance were calculated using the hypergeometric distributions in R (R: The Hypergeometric Distribution). To determine the likelihood that each 48-cell group was representative of the bulk cell population, the reads from the bulk sample(s) were correlated to the same number of randomly selected reads from the cells of the same treatment group. To validate our scRNA-seq findings, we compared the differential expression genes with a previous similar bulk cell microarray experiment data (GSE18684) (20, 21).
Hierarchical clustering was performed with the Multi-Experiment Viewer (MeV) with Pearson correlation. To perform principal component analysis, the variance of the RNA-seq read counts per gene was normalized using the regularized logarithm transformation (rlog, DESeq2 R package) (22). For the subpopulation (or subcluster) identification, the normal mixture modeling algorithm, mclust (Mclust, mclust R package) was applied using the first 4 principal components (≥5% of the variance) (23).
The average principal component (PCA) values for each subcluster were correlated (Pearson correlation, r value) with the principal component values of each gene used in the previous PCA. This produced a list of genes based on which subcluster each gene correlated with most strongly (highest r value). Ontoloigcal annotation of genes in each subcluster was queried using The Database for Annotation, Visualization and Integrated Discovery (DAVID)(p <0.05).
To assess the clinical relevance of the gene signatures, the prostate adenocarcinoma RNA-seq data from The Cancer Genome Atlas (TCGA) was analyzed by creating hierarchical clustering heatmaps. Receiver operating characteristic analysis (ROC, R package) was conducted to assess each gene’s predictive power for biochemical recurrent prostate cancer. Kaplan-Meier curves were created to determine the disease-free survival outcomes of the TCGA patient cohort using cbioportal.org.
Flow sorting of LNCaP subpopulations
The two cell surface markers from the Subcluster E gene profile, HMMR and CD81, were used to isolate the stem-like and androgen-insensitive subpopulation (LNCaP 8.1) from LNCaP cell line. After DTB and R1881 treatment of LNCaP cells, the cells were incubated with anti-CD81 PE-conjugated (ab81436, AbCam) and anti-HMMR APC-conjugated (ab170527 & ab201807, AbCam). The HMMRhi (8.1) cells were sorted using Beckman Coulter Moflow Astrios.
In vitro phenotypic assays of a stem-like subpopulation
To access the proliferation capability of LNCaP 8.1 and LNCaP, the cells (1×10⁴) were seeded in 96-well plates and cell confluence was quantified using the imaging of Incucyte ZOOM (Essen BioScience). Images were acquired every 3 hr for up to 72 hr. Each assay treatment was run in triplicate with 4 images acquired per well. Image processing analyses were applied to derive normalized confluence calculated by normalizing confluence at each time point. The cells were cultured at very diluted concentrations (2×10⁶ cells/150 mm plate or 500 cells/well of 6-well plates) and subjected to colony formation assay. After 10 days with 2 media refreshes, the cells were fixed with 4% paraformaldehyde for 60 min, stained with 0.01% crystal violet (diluted in dH2O) and washed with dH2O two times before drying and imaging.
qRT-PCR
To validate the SMART-seq2 data of the 10 genes predicting biochemcial recurrence, bulk RNA from LNCaP and 8.1 cultured with and without R1881 were isolated using TRizol and reverse transcribed using the SuperScript VILO Master Mix kit (11755050, Thermo Fisher) as described above. The cDNA was diluted in nuclease-free water either 1:10 or 1:100. The 10-μl reactions were prepared in triplicate for each of the 10 genes: CCNB1, CCNB2, CDC20, CENPE, CENPF, DLGAP5, HMMR, MKI67, PLK1, and PTTG1. The primer sequences of the genes were listed in Supplementary Table S2. EEF1G was used as an internal control/reference gene. LightCycler 480 SYBR Green Master mix (04887352001, Roche) was used to prepare the assays and samples to be read in a 384-well plate in the LightCycler 480 II machine.
Statistical analysis
For biomark analyses, low quality cells and genes were not analyzed if less than 40% of the reactions per cell or per gene, respectively, passed quality control (specific melt curves and detectable levels of amplification product). Statistically significant differences between hour treatment groups were calculated by analysis of variance and Tukey’s multiple comparison honest significance difference post-hoc two-tailed t-test. Biomark analysis comparing LNCaP and 8.1 used the unpaired t-test. P values <0.05 were considered significant.
For qRT-PCR, data from one experiment with at least 3 technical replicates are presented as mean ± SD. Analysis was performed with unpaired two-tailed t-test or analysis of variance followed by Sidak’s post-hoc t-test with correction for multiple comparisons. P values <0.05 were considered significant.
For the proliferation assays, data from one experiment with 3 biological replicates and three technical replicates each was presented as mean ± SD. Only the 72-hr time point was analyzed for significant statistical difference using unpaired two-tailed t-test. For the viability assay, two independent experiments were performed with 5 to 12 technical replicates each and one representative experiment is presented. The data was analyzed with analysis of variance followed by Dunnett’s post hoc t-test with correction for multiple comparisons. P values <0.05 were considered significant.
Statistical analyses were performed with R and GraphPad Prism 6. All the experiments were performed without methods of randomization or blinding and the sample size was not predetermined.
Data availability
Data generated for this study are available through the Gene Expression Omnibus (GEO) under accession number GSE 99795.
Results
Subpopulation profiling of gene expression in single prostate cancer cells
To determine whether cell subpopulations exist in the LNCaP line, androgen-deprived cells were treated with 1 nM R1881, a non-metabolizable androgen (24), for 0, 6, 12, 24, 36, and 72 hr. Individual cells were picked at different time points and subjected to single-cell expression analysis of 16 known androgen-responsive genes based on a 40% passing reaction rate threshold (Supplementary Table S1). Violin plot analysis showed a wide range of gene expression levels in individual cells at different time points of androgen stimulation (Supplementary Fig. S1A, and Supplementary Table S3). For example, the expression of ABCC4 and TPD52 slowly increased over time though BCLXL and MYC appeared to be relatively stable in two cell subpopulations across the time points (upper panels). Despite a high degree of heterogeneity, the reproducibility of single-cell expression levels was confirmed in NKX3A and PPAP2A using the same primer pairs in two different gene panels for reverse-transcription, site-targeted amplification and qPCR (lower panels). Hierarchical clustering and principal component analysis of these androgen-responsive genes showed that the 0-hr group of cells was mostly clustered together, indicating a limited degree of expression heterogeneity (Supplementary Fig. S1B and C). Interestingly, cells treated with androgen for 6 and 12 hr were either clustered with or apart from the 0-hr group. The effect appeared more pronounced at later time points - 24, 36 and 72 hr. Because not all of the cells were immediately responsive to androgen, our result suggests that multiple subpopulations are present in the LNCaP cell line with unequal sensitivity to androgen stimulation. As a result, the same androgen-responsive genes may have diverse expression levels in different cells and at different time points of stimulation. The finding also suggests that a panel of known androgen-regulated genes can display the dynamic characteristics of the androgen response in LNCaP cells as early as 6 to 12 hr. However, taking a de novo approach with single-cell RNA-seq (scRNA-seq) would likely provide a more detailed and unbiased report of which genes are associated with the differential sensitivity to androgen.
To further investigate this heterogeneous response, cells were first arrested in G1/S phases using a double thymidine block and simultaneously cultured in a medium containing charcoal-stripped serum for 24 hr (Fig. 1A and Supplementary Fig. S2). As a result, cells in the G2 phase were greatly reduced to 1.6% from 17.5% in the control without thymidine block. Following the incubation, LNCaP cells were immediately released from the cell-cycle block and treated with or without 1 nM R1881 for 12 hr (Supplementary Fig. S2). Although the majority (~81-84%) of cells remained in G1/S, we observed a modest increase (~6-8%) in the number of cells progressing to G2 after the treatment. This result indicates that the cell cycle in the LNCaP line is not complete yet at 12 hr. A previous report suggests that an obvious effect of androgen on gene expression in LNCaP cells occurs more often at this transition period (25). Therefore, we chose this time point for our single-cell RNA-seq analysis. Forty-eight single cells per treatment/control group were picked and subjected to SMART-seq2 amplification, Nextera XT tagmentation, library preparation, and high-throughput sequencing (14). As an additional control for comparing basal expression changes, 48 single cells were picked immediately after the release of thymidine block.
Figure 1.
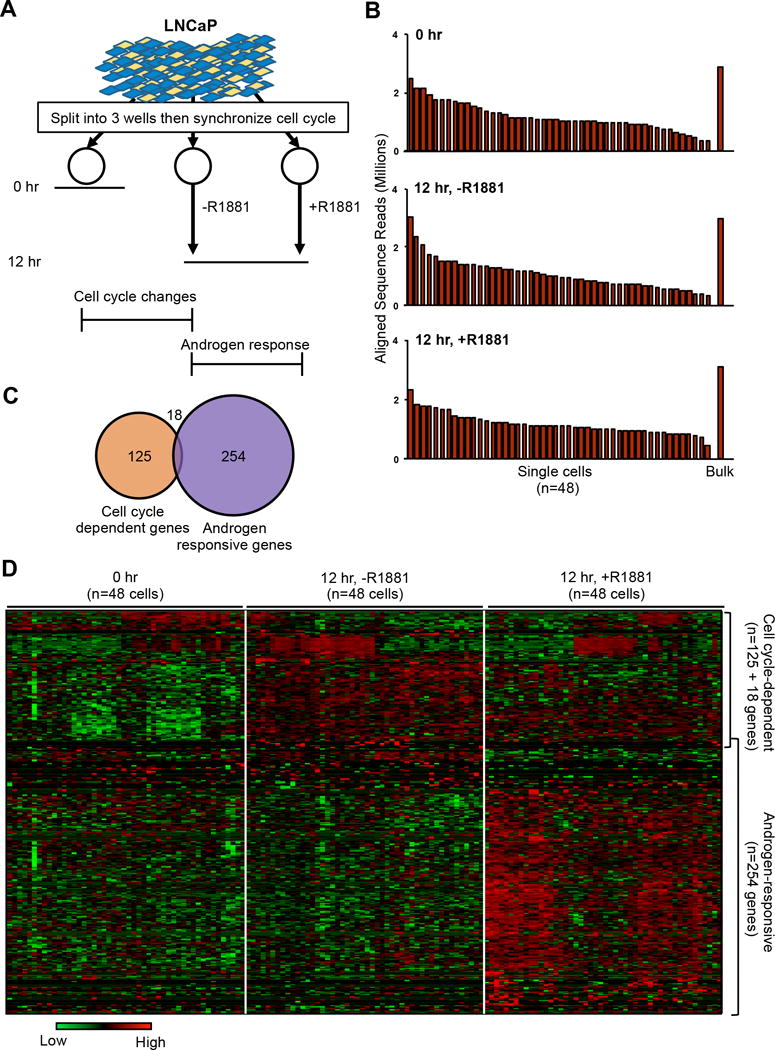
Single-cell analysis of 144 androgen-treated, -untreated, and control LNCaP cells reveals 397 differentially expressed genes. A, Schematic for isolating 48 single cells per treatment group in preparation for single cell transcriptome amplification. B, Number of aligned reads (millions) per single cells and bulk sample per treatment group. C, Number of significantly differentially expressed genes (adjusted P value < 0.05). D, Hierarchical clustering heatmap of gene expression (Z score of log2 normalized RPKM) for each of the 397 genes (horizontal axis) and each of the single cells (vertical axis) within each treatment group. Of these, 125+18 genes were identified as cell cycle-dependent while 254 genes were categorized as androgen-responsive. Note: 18 genes assigned in the cell cycle-dependent group depicted here were also androgen-responsive.
On average, 3 × 10⁶ sequencing reads per cell were processed through a sequencing pipeline. Of these, an average of 1.13 × 10⁶ reads per cell were mapped to human exomes (Fig. 1B and Supplementary Fig. S3). Approximately 50,000 transcript IDs representing about 25,000 different genes were detected among all the cells. Furthermore, because of the significant correlations between the single-cell ensemble and bulk reads (Spearman 0.82≤rs≤0.95, p<0.01), the 48 single cells represented a significant portion of the variation observed in reads from the bulk population (Supplementary Fig. S4).
Of the total 23,980 genes detected in scRNA-seq, the Bayesian-based single-cell differential expression (SCDE) algorithm (19) identified 397 differentially expressed genes among the three groups: 1) the expression of 125 genes solely affected by time and cell-cycle progression (comparison between 0- and 12-hr untreated groups); 2) the expression of 254 genes affected by androgen stimulation (comparison between 12-hr androgen-treated and untreated cells); and 3) 18 genes, the expression of which were affected by both cell-cycle progression and androgen treatment (7.13×10⁻¹⁰≤P≤0.05; Fig. 1C and Supplementary Fig. S5A). The number of Group 3 genes might be underestimated at the 12-hr time period since previous studies suggest that prostate cancer cells in active cell-cycle progression are more responsive to androgen stimulation (26, 27). If we investigate expression profiles of single cells beyond this time point, we may find more Group 3 genes. Interestingly, 119 of these genes were also identified in 12-hr R1881 stimulated LNCaP cells using bulk-cell microarray (Supplementary Fig. S5B and C). Hierarchical clustering confirmed expression level changes across three treatment groups of single cells in response to cell-cycle progression and/or androgen stimulation (Fig. 1D).
Subpopulation stratification of prostate cancer cells with differential responses to cell- cycle progression and androgen stimulation
To robustly identify cell subpopulations differentially responding to androgen stimulation and/or cell-cycle progression, principal component analysis (PCA) was used to create a scatter plot of these 144 cells based on their expression profiles of the aforementioned 397 genes. As shown in a 3-dimension (3D) PCA plot (Fig. 2A), cells from the 0- and 12-hr untreated groups appeared to be clustered together in two regions on the bottom-right and bottom-left areas of the plot. Interestingly, the majority of the 12-hr treated cells were spread out into large areas located above and mostly separated from the untreated cells. Therefore, principal component 2 accounted for gene expression responses to androgen. However, 14 (29%) of these treated cells fell into the 0- and the 12-hr untreated groups, again suggesting that not all of the LNCaP cells respond to androgen the same way.
Figure 2.
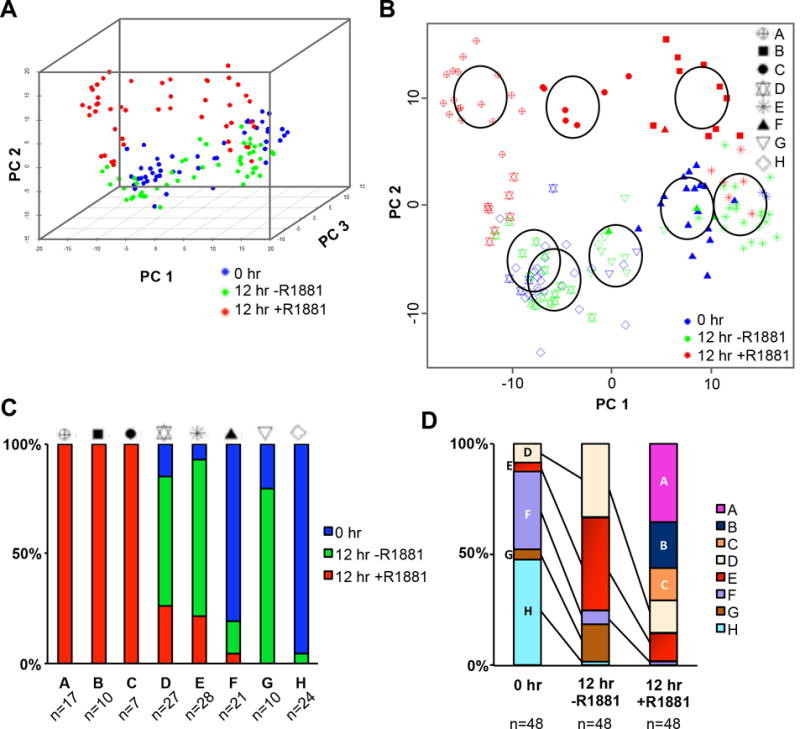
Subpopulations of LNCaP cells exhibit distinct transcription responses to androgen stimulation. A, Principal component analysis (PCA) plot representing each cell as a dot localized based on its 397-gene expression profile. B, Alternative view of the first four principal components along with results of the mixed model-based clustering algorithm showing the likely subpopulations of cells. C, Overlapping view of the original principal component analysis plot with each of the eight subpopulations identified by specific symbols. D, Percentage of the fraction of cells from each treatment group represented in each subgroup.
Based on the first 4 principal components, which accounted for approximately ≥5% of the variance in the PCA each, the Mclust algorithm determined that there were most likely eight subpopulations of these 144 cells (Fig. 2B and Supplementary Fig. S6A and B). Subpopulations A-C were made up of androgen-treated cells, D and E were both androgen-treated and -untreated cells, and F-H composed almost entirely of androgen-untreated cells (Fig. 2C). One androgen-treated cell in subpopulation F made up less than 10% of the androgen-treated cells therefore it was likely an outlier (Fig. 2C). Furthermore, there appeared to be a dynamic shift of subpopulation sizes (e.g., D, E, F, G and H) in androgen-untreated cells at 12 hr, compared to cells at 0 hr (Fig. 2D). However, androgen treatment resulted in the arising of three new subpopulations (i.e., A, B, and C) and the shrinking of three subpopulations (i.e., D, E, and F) and the loss of subpopulations G and H that were originally observed in untreated cells. Interestingly, the rest of androgen-treated cells were clustered with subpopulations D, E, and F. This suggests that subpopulations D, E and F contain cells that were less sensitive to androgen stimulation.
To determine which genes associated most strongly with each subpopulation, the average location of each group on the 3D PCA plot was correlated with each of the principal component values for the genes (Fig. 3A and Supplementary Fig. S7). Each of the 397 genes was assigned to a specific subpopulation (Supplementary Table S4). Genes correlated with a specific subpopulation were also highly expressed in each of the cells within that group (Supplementary Fig. S7). The Database for Annotation and Visualization and Integrated Discovery (DAVID) was used to determine which molecular pathways were associated with each of the subgroup gene lists (Fig. 3B and Supplementary Table S4). Each of the androgen-dependent subpopulations A, B and C exhibited increased expression of different molecular pathways: A was cell-motility-related, B showed serine-peptidase activity, and C showed peroxisome and fatty-acid metabolism activity. In contrast, subpopulation E showed significant upregulation of mitosis and cell cycle pathways, which are commonly associated with aggressive and androgen-independent prostate cancers (28–30). Subpopulation D showed upregulation of mitochondrial membrane proteins. Subpopulations F, G and H, all made up of androgen-untreated cells, showed significant upregulation of DNA organization and replication, protein modification and ribonucleoprotein complex pathways, respectively. Altogether, the results suggest that each of the subpopulations examined may be responsible for separate functions within a larger population of cells. In this case, the androgen responsiveness may be split up into five subpopulations of cells, with A, B, and C being highly sensitive to androgen stimulation, and D and F less sensitive to the stimulation but dependent on other cell cycle-driven events.
Figure 3.
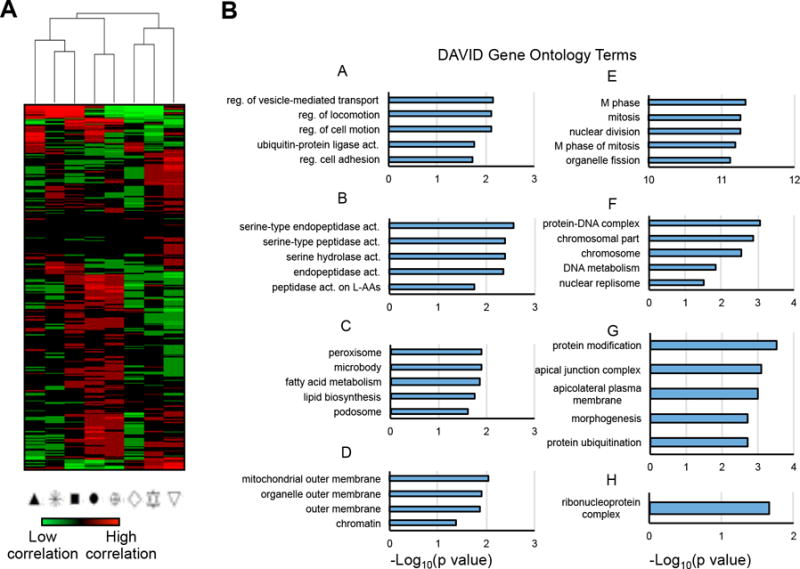
Distinct gene signatures characterize the individual androgen-treated and -untreated LNCaP subpopulations. A, Hierarchical clustering heatmap showing the correlation (Pearson r value) of the gene expression values for each of the 397 significant genes with the average/central location for each subpopulation of cells on the PCA plot in Fig. 2A. This figure is the basis for the “positively correlated” gene expression profiles created for each subpopulation. B, Bar charts indicating the level of significance that each gene ontology term from DAVID is associated with each subpopulation based on the “positively correlated” gene expression profiles. Statistically significant gene ontology term associations are indicated by bars ≥1.3.
Identification of a cell cycle-driven subpopulation linked to advanced cancer development
Although statistically defined, some of these subpopulations might be drivers for prostate cancer progression. It is possible that castration-resistant cancer cells can arise through selection in treatment-naïve tumors. Therefore, we postulated that one (or some) of the subpopulations could represent an aggressive stage of prostate cancer. To verify this hypothesis, hierarchical clustering was conducted in a TCGA prostate cancer cohort (n=497 tumors and control samples) based on expression profiles of the 8 subpopulations described above (Supplementary Fig. S8). Interestingly, the gene expression profile of subpopulation E was the only one that appeared to distinguish biochemical recurrent prostate cancer from non-recurrent tumor types (i.e., Gleason score 6, 7, and >7; Fig. 4A). Specifically, ten (CCNB2, DLGAP5, CENPF, CENPE, MKI67, PTTG1, CDC20, PLK1, HMMR, and CCNB1) of the 22 genes in the subpopulation E had expression patterns that could distinguish biochemical recurrent from non-recurrent prostate cancer with ≥0.60 area under the curve (AUC), or overall predictive ability, in receiver operating characteristic (ROC) curves (Fig. 4B and Supplementary Table S5). Moreover, when any one of the genes of the 10-gene set was upregulated in tumors ≥2-fold, the gene set was significantly predictive for recurrence in patients (p=0.005; Fig. 4C).
Figure 4.
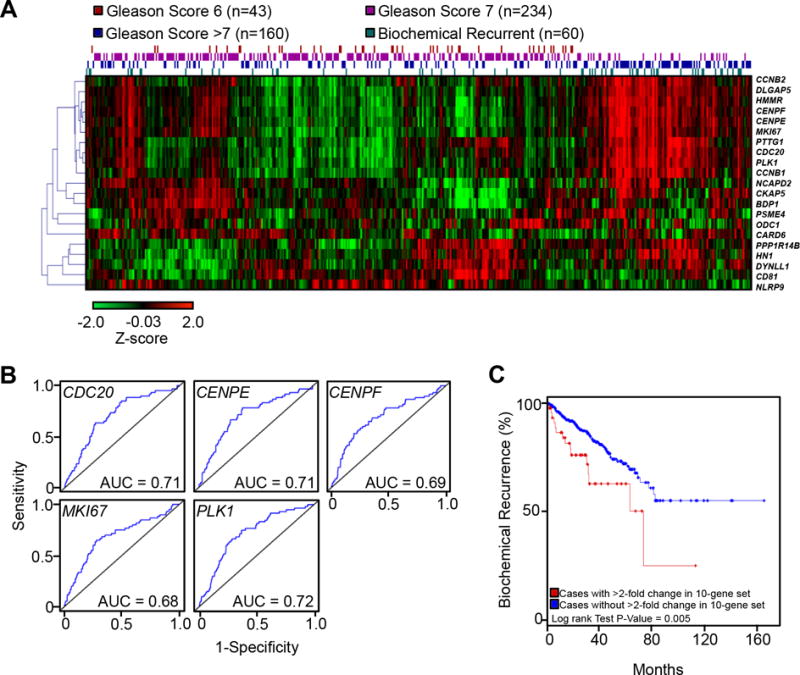
Increased expression of the subpopulation E gene profile predicts biochemical recurrent prostate cancer. A, Hierarchical clustering heatmap of prostate cancer tissue disease status and the subpopulation E gene expression profile from TCGA (Z score of log2-normalized RPKM). B, Receiver operating characteristic (ROC) curves for genes related to subpopulation E cells. The blue line indicates the false and true positive rates for predicting biochemical recurrence at each point throughout the range of gene expression for each gene. C, Kaplan-Meier plot predicting disease-free status of patients based on ≥2-fold gene expression changes of any of the genes in the 10-gene set.
Seven of these 10 aforementioned genes encode cell cycle-related functions (Fig. 4A and Supplementary Table S4). CCNB1 and CCNB2 are essential cyclin components of the cell cycle regulatory machinery while CENPF and CENPE are centromere proteins important for cell division (31–35). Both CDC20 and PLK1 regulate activation of anaphase complex and PTTG1 is a (36–39)known transcription factor that specifically modulates the G1/S-phase transition. As shown by these previous studies, the expression of these cell cycle-related genes is not primarily driven by androgen signaling in prostate cancer cells. Taken together, these results provide the first evidence that a hidden subpopulation in an androgen-sensitive cell line may contribute to advanced development of prostate cancer.
Characterization of the cell cycle-driven subpopulation with androgen-insensitive and stem-like features
Both single-cell and in silico analyses indicate that higher expression levels of these 10 cell cycle-related genes may render subpopulation E cells with aggressive phenotypes. To validate this in vitro, synchronized and androgen-stimulated LNCaP cells were flow-sorted based on two surface markers, HMMR and CD81, which were both highly expressed in subpopulation E cells regardless of androgen treatment (Fig. 5A). As a result, one minor subgroup (0.7%) of cells, termed 8.1, were sorted on the basis of high HMMR expression while the majority showed relatively low expression of the surface marker (Fig. 5B). Significantly higher expression of six (i.e., PLK1, CDC20, MKI67, CENPF, and PTTG1) of the 10 genes were detected in 8.1 cells relative to those of LNCaP cells, suggesting that 8.1 cells are indeed representative of the original subpopulation E (P<0.05; Fig. 5C). In addition, the expression of some of these 10 cell cycle-related genes appeared to be differentially regulated in response to androgen stimulation (Supplementary Fig. S9). A cell viability assay showed that 8.1 cells were less responsive than LNCaP cells to inhibition by enzalutamide, which is known to block androgen from binding to androgen receptors, suggesting that 8.1 cells exhibit androgen-independent characteristics (Fig. 5D)(40). The result was consistent with single-cell expression analysis of the 10 genes that were highly expressed in more aggressive androgen-independent PC3 cells (Supplementary Fig. S10A and B). Taken together, the findings initially imply that this minor subgroup likely possesses stem-cell characteristics because prostate cancer-stem (or -initiating) cells are known to exhibit self-renewal ability in the absence of androgen (7, 41).
Figure 5.
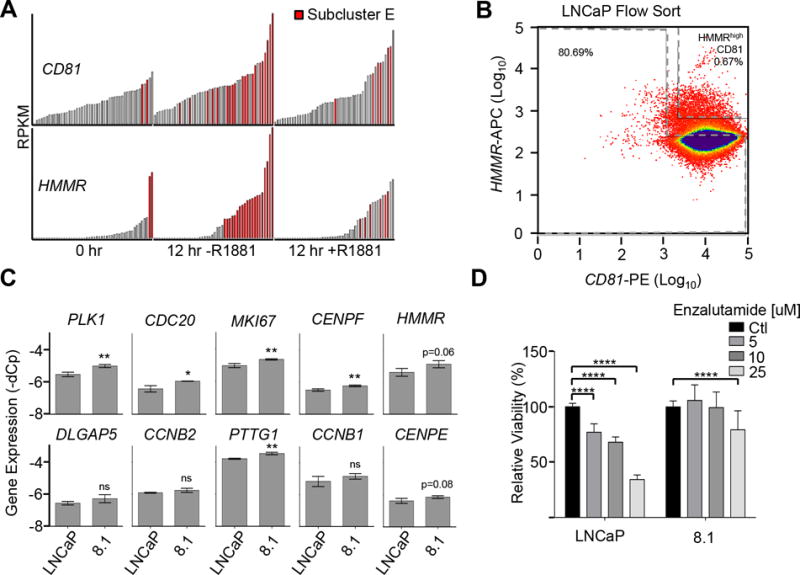
The HMMRhi subpopulation of androgen-treated LNCaP cells is less responsive to androgen stimulation. A, Bar chart of RPKM values of CD81 and HMMR for each cell within each original treatment group. Bars representing gene expression for subcluster E cells are colored red. B, Flow cytometry plot of androgen-treated LNCaP cells stained with anti-HMMR and anti-CD81 antibodies conjugated to APC and PE, respectively. The HMMRhi sorted subpopulation is LNCaP 8.1. C, Gene expression of subpopulation E-related genes in LNCaP and 8.1 cells. D, Cell viability assay of LNCaP and 8.1 cells treated with enzalutamide. Results are shown as means ± SD from triplicates and analyzed for statistical significance using ANOVA then Sidak’s multiple comparison post-hoc test to compare within cell lines. *, p<0.05; **, p<0.01; ***, p<0.001. No asterisk indicates no significant difference.
Three additional lines of experimental evidence further support the presence of stem-like features in 8.1 cells. First, this subpopulation of cells showed a slower growth rate than the parental LNCaP line when culturing these cells in media supplemented with fetal bovine serum, which contains low levels of androgen (Fig. 6A)(42); the relatively slow-cycling 8.1 cells were also less sensitive to inhibition (i.e., BI2536) of PLK1 that preferentially induced G2/M arrest in LNCaP cells (Fig. 6B and C)(43). Second, 8.1 cells tended to form spherical colonies as a property of cancer stem cells in vitro (Fig. 6D). Third, single-cell expression analysis of gene marks confirmed that compared to 8.1 cells, LNCaP cells exhibit significantly higher levels of epithelial features (KRT8, CDH1, and EPCAM) and two well-known androgen-responsive genes, IGFBP2 and KLK3 (p<0.05; Fig. 6E and F). Therefore, these in vitro studies recapitulate our single-cell findings that a previously uncharacterized side-population of cells, the growth of which depends more on a well-functioning cell cycle network and less on androgen signaling, is present in the androgen-dependent LNCaP cell line.
Figure 6.
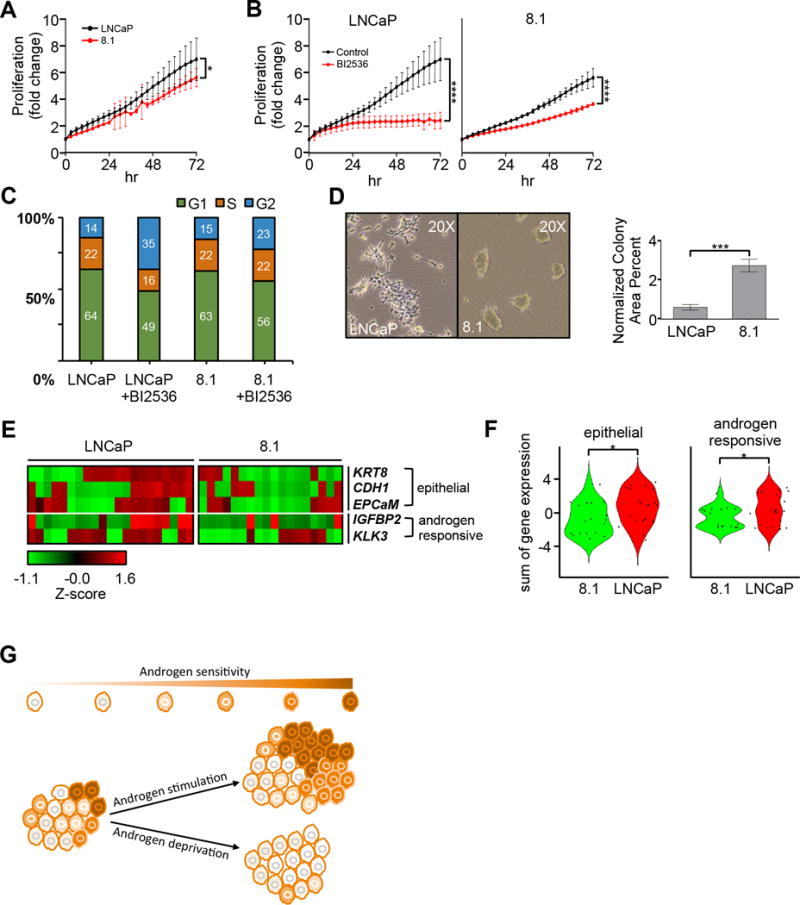
The HMMRhi subpopulation of androgen-treated LNCaP cells has stem cell-like features. A, Live-cell imaging quantification showing the normalized proliferation fold changes of LNCaP and 8.1 (n=4 images per every biological triplicate). B, Live-cell imaging quantification of LNCaP and 8.1 treated with and without the PLK1 inhibitor, BI2536 (2 nM)(n=4 images per every biological triplicate). C, Cell cycle analysis of LNCaP and 8.1 in the presence and absence of BI2536 (2 nM). D, Colony formation photos of representative regions within the culture dish. Also, colony formation area analysis of paraformaldehyde fixed and crystal violet stained images of another colony formation assay of the LNCaP subpopulations performed with technical triplicates (500 cells per well in a 6-well dish cultured for 10 days before fixing). E, Single hand-picked LNCaP and 8.1 cells analyzed using a biomark gene panel and presented as a Z-score normalized heatmap. F, Violin plots quantifying the epithelial characteristics gene expression from panel E. G, Schematic illustration for the development of LNCaP subpopulations to androgen-dependence and -independence. The model depicts the majority of pre-existing cell subpopulations that are sensitive to androgen-driven proliferation. The model also shows cell-cycle progression and expansion of stem-like cell subpopulations (i.e., less sensitive to androgen) under an androgen-deprivation condition.
Discussion
Previous studies have isolated and characterized androgen-independent clones from the androgen-dependent LNCaP parental line after prolonged androgen deprivation (8, 9). These initial findings seem to favor the stepwise model that successive acquisition of molecular alterations in LNCaP cells, enabling clonal expansion of androgen-independent cells. This classical approach on a bulk-cell scale, however, cannot rule out the possibility that pre-existing subpopulations with various androgen sensitivity cells are already present in the parental line prior to androgen-deprivation selection (see a proposed model in Fig. 6G). Indeed, our preliminary single-cell whole-genome sequencing implicates the presence of clonally-related subpopulations carrying multiple genetic alterations in the LNCaP line (Lin et al., unpublished data). The present single-cell expression study corroborates this genomic finding that multiple subpopulations are present in the cell line. Although the majority (~81-84%) of LNCaP cells remain in G1/S phase after the release of thymidine block, these pre-existing subpopulations appear to exhibit a wide range of androgen sensitivity, resulting in rapid and diverse changes of gene expression after the R1881 treatment.
To further determine which subpopulations are sensitive or insensitive to androgen stimulation, we compared single-cell transcriptome profiles between androgen-stimulated and -unstimulated LNCaP cells after cell-cycle synchronization. The result identified at least eight subpopulations of LNCaP cells, revealing a previously unappreciable level of heterogeneity to androgen sensitivity in this commonly studied cell line. Subpopulation A and C cells are androgen-responsive, the growth of which can be predominately driven by signaling networks associated with cellular migration/invasion and lipid metabolism (Fig. 3B). Subpopulation B cells appear to have high peptidase activities, which represent a previously uncharacterized androgen-responsive mechanism uncovered in this present study. Subpopulation D and E cells are partially androgen-responsive and in the absence of androgen-stimulation, these cells may turn on backup signaling networks of mitochondrial membrane or cell cycle functions for survival. Subpopulation F and G cells were androgen-unresponsive, their growth of which may depend on pathways independent of androgen signaling.
Although definitive proof of the latter three subpopulations (F-H) as less- or non-responsive groups will need to come from a single-cell study of long-term androgen-deprived LNCaP cells, our in silico analysis of the TCGA cohort supports that subpopulation E cells are likely an originator population that develops an aggressive phenotype. Interestingly, the link between increased expression levels of cell cycle-related genes associated with biochemical recurrence has been observed before (30). The “cell-cycle progression” (CCP) profile of a 31-gene panel was preferentially found in patients’ tumor biopsies that subsequently progressed to recurrence (28, 29). Of note, we observed concordant up-regulation of five (CDC20, CENPF, DLGAP5, PLK1 and PTTG1) of these 31 CCP-related genes in subpopulation E cells. This further supports our finding that high activities of mitotic gene networks are linked to advanced development of prostate cancer (26). To validate our findings in vitro, we successfully isolated and characterized a side population of LNCaP cells, implicating the stem-cell features of subpopulation E cells. For future studies, serial propagation of these cells can be performed in xenografts to convincingly prove their self-renewal property and androgen-independent characteristics.
In summary, we demonstrate that scRNA-seq analysis provides a more in-depth understanding of the underlying biology of the heterogeneous androgen-sensitivity in prostate cancer cell subpopulations. Although our present investigation is limited to few cell line models, this single-cell expression profiling can be applied to primary tumors using the aforementioned 10-gene panel for subpopulation stratification. Positive identification of subpopulation E cells in a patient will imply the propensity of future recurrence of his prostate tumor. If proven in a large-scale study, concordant expression of these 10 candidate genes in single cells may be useful markers for early detection of high-risk tumors that subsequently develop androgen independence. Moreover, this approach could also be used to better understand how cancer cells respond heterogeneously to anti-androgen therapies and to reveal which subpopulations are resistant to this treatment.
Supplementary Material
Acknowledgments
The authors wish to thank the staff of the Bioanlaytics and Single-Cell Core (BASiC) that is supported by the Cancer Prevention and Research Institute of Texas (CPRIT) grant RP150600 and the Next-Generation Sequencing Shared Resource at the University of Texas Health Science Center-San Antonio for providing their technical support of single-cell expression analysis.
Grant Support
This work was supported by NIH grants U54CA217297 and P30CA054174 (to T.H.-M. Huang). T.H.-M. Huang is a recipient of the CPRIT grant RP150600, gift of the Cancer Therapy and Research Center Foundation, the Max and Minnie Tomerlin Voelcker Fund and the Alice P. McDermott Endowment. A.M. Hornings is a recipient of the predoctoral fellowship from the Cancer Biology Training Program T32CA148724. Z. Liu is a CPRIT Scholar in Cancer Research (RR160017).
Footnotes
Disclosure of potential conflict of interest: No potential conflicts of interest were disclosed
References
- 1.Diaz M, Patterson SG. Management of androgen-independent prostate cancer. Cancer Control. 2004;11:364–73. doi: 10.1177/107327480401100604. [DOI] [PubMed] [Google Scholar]
- 2.Cornford P, Bellmunt J, Bolla M, Briers E, De Santis M, Gross T, et al. EAU-ESTRO-SIOG Guidelines on Prostate Cancer. Part II: Treatment of Relapsing, Metastatic, and Castration-Resistant Prostate Cancer. Eur Urol. 2017;71:630–42. doi: 10.1016/j.eururo.2016.08.002. [DOI] [PubMed] [Google Scholar]
- 3.Paller CJ, Antonarakis ES. Management of biochemically recurrent prostate cancer after local therapy: evolving standards of care and new directions. Clin Adv Hematol Oncol. 2013;11:14–23. [PMC free article] [PubMed] [Google Scholar]
- 4.Watson PA, Arora VK, Sawyers CL. Emerging mechanisms of resistance to androgen receptor inhibitors in prostate cancer. Nat Rev Cancer. 2015;15:701–11. doi: 10.1038/nrc4016. [DOI] [PMC free article] [PubMed] [Google Scholar]
- 5.Greaves M, Maley CC. Clonal evolution in cancer. Nature. 2012;481:306–13. doi: 10.1038/nature10762. [DOI] [PMC free article] [PubMed] [Google Scholar]
- 6.Saraon P, Drabovich AP, Jarvi KA, Diamandis EP. Mechanisms of Androgen-Independent Prostate Cancer. EJIFCC. 2014;25:42–54. [PMC free article] [PubMed] [Google Scholar]
- 7.Feldman BJ, Feldman D. The development of androgen-independent prostate cancer. Nat Rev Cancer. 2001;1:34–45. doi: 10.1038/35094009. [DOI] [PubMed] [Google Scholar]
- 8.Rycaj K, Cho EJ, Liu X, Chao HP, Liu B, Li Q, et al. Longitudinal tracking of subpopulation dynamics and molecular changes during LNCaP cell castration and identification of inhibitors that could target the PSA-/lo castration-resistant cells. Oncotarget. 2016;7:14220–40. doi: 10.18632/oncotarget.7303. [DOI] [PMC free article] [PubMed] [Google Scholar]
- 9.Thalmann GN, Sikes RA, Wu TT, Degeorges A, Chang SM, Ozen M, et al. LNCaP progression model of human prostate cancer: androgen-independence and osseous metastasis. Prostate. 2000 Jul 1;44:91–103. doi: 10.1002/1097-0045(20000701)44:2<91::aid-pros1>3.0.co;2-l. 44(2) [DOI] [PubMed] [Google Scholar]
- 10.Iguchi K, Ishii K, Nakano T, Otsuka T, Usui S, Sugimura Y, et al. Isolation and characterization of LNCaP sublines differing in hormone sensitivity. J Androl. 2007;28:670–8. doi: 10.2164/jandrol.107.002675. [DOI] [PubMed] [Google Scholar]
- 11.Sottoriva A, Kang H, Ma Z, Graham TA, Salomon MP, Zhao J, et al. A Big Bang model of human colorectal tumor growth. Nat Genet. 2015;47:209–16. doi: 10.1038/ng.3214. [DOI] [PMC free article] [PubMed] [Google Scholar]
- 12.Chen C-L, Mahalingam D, Osmulski P, Jadhav R, Wang C-M, Leach R, et al. Single-cell analysis of circulating tumor cells identifies cumulative expression patterns of EMT-related genes in metastatic prostate cancer. Prostate. 2013;73:813–26. doi: 10.1002/pros.22625. [DOI] [PMC free article] [PubMed] [Google Scholar]
- 13.Ma HT, Poon RY. Synchronization of HeLa cells. Methods Mol Biol. 2011;761:151–61. doi: 10.1007/978-1-61779-182-6_10. [DOI] [PubMed] [Google Scholar]
- 14.Picelli S, Faridani OR, Bjorklund AK, Winberg G, Sagasser S, Sandberg R. Full-length RNA-seq from single cells using Smart-seq2. Nat Protoc. 2014;9:171–81. doi: 10.1038/nprot.2014.006. [DOI] [PubMed] [Google Scholar]
- 15.Crissman HA, Steinkamp JA. Rapid, simultaneous measurement of DNA, protein, and cell volume in single cells from large mammalian cell populations. J Cell Biol. 1973;59:766–71. doi: 10.1083/jcb.59.3.766. [DOI] [PMC free article] [PubMed] [Google Scholar]
- 16.Anders S, Pyl PT, Huber W. HTSeq–a Python framework to work with high-throughput sequencing data. Bioinformatics. 2015;31:166–9. doi: 10.1093/bioinformatics/btu638. [DOI] [PMC free article] [PubMed] [Google Scholar]
- 17.Langmead B, Trapnell C, Pop M, Salzberg SL. Ultrafast and memory-efficient alignment of short DNA sequences to the human genome. Genome Biol. 2009;10:R25. doi: 10.1186/gb-2009-10-3-r25. [DOI] [PMC free article] [PubMed] [Google Scholar]
- 18.Trapnell C, Pachter L, Salzberg SL. TopHat: discovering splice junctions with RNA-Seq. Bioinformatics. 2009;25:1105–11. doi: 10.1093/bioinformatics/btp120. [DOI] [PMC free article] [PubMed] [Google Scholar]
- 19.Kharchenko PV, Silberstein L, Scadden DT. Bayesian approach to single-cell differential expression analysis. Nat Methods. 2014;11:740–2. doi: 10.1038/nmeth.2967. [DOI] [PMC free article] [PubMed] [Google Scholar]
- 20.Massie CE, Lynch A, Ramos-Montoya A, Boren J, Stark R, Fazli L, et al. The androgen receptor fuels prostate cancer by regulating central metabolism and biosynthesis. EMBO J. 2011;30:2719–33. doi: 10.1038/emboj.2011.158. [DOI] [PMC free article] [PubMed] [Google Scholar]
- 21.Choudhary V, Kaddour-Djebbar I, Lakshmikanthan V, Ghazaly T, Thangjam GS, Sreekumar A, et al. Novel role of androgens in mitochondrial fission and apoptosis. Mol Cancer Res. 2011;9:1067–77. doi: 10.1158/1541-7786.MCR-10-0445. [DOI] [PMC free article] [PubMed] [Google Scholar]
- 22.Love MI, Huber W, Anders S. Moderated estimation of fold change and dispersion for RNA-seq data with DESeq2. Genome Biol. 2014;15:550. doi: 10.1186/s13059-014-0550-8. [DOI] [PMC free article] [PubMed] [Google Scholar]
- 23.Scrucca L, Fop M, Murphy TB, Raftery AE. mclust 5: Clustering, Classification and Density Estimation Using Gaussian Finite Mixture Models. R J. 2016;8:289–317. [PMC free article] [PubMed] [Google Scholar]
- 24.Lin AL, Shain SA. Androgen modulation of prostate cancer cell androgen receptor content is cell line specific. Mol Cell Endocrinol. 1989;63:75–83. doi: 10.1016/0303-7207(89)90083-x. [DOI] [PubMed] [Google Scholar]
- 25.Nelson PS, Clegg N, Arnold H, Ferguson C, Bonham M, White J, et al. The program of androgen-responsive genes in neoplastic prostate epithelium. Proc Natl Acad Sci U S A. 2002;99:11890–5. doi: 10.1073/pnas.182376299. [DOI] [PMC free article] [PubMed] [Google Scholar]
- 26.Balk SP, Knudsen KE. AR, the cell cycle, and prostate cancer. Nucl Recept Signal. 2008;6:e001. doi: 10.1621/nrs.06001. [DOI] [PMC free article] [PubMed] [Google Scholar]
- 27.McNair C, Urbanucci A, Comstock CE, Augello MA, Goodwin JF, Launchbury R, et al. Cell cycle-coupled expansion of AR activity promotes cancer progression. Oncogene. 2017;36:1655–68. doi: 10.1038/onc.2016.334. [DOI] [PMC free article] [PubMed] [Google Scholar]
- 28.Cuzick J, Berney DM, Fisher G, Mesher D, Moller H, Reid JE, et al. Prognostic value of a cell cycle progression signature for prostate cancer death in a conservatively managed needle biopsy cohort. Br J Cancer. 2012;106:1095–9. doi: 10.1038/bjc.2012.39. [DOI] [PMC free article] [PubMed] [Google Scholar]
- 29.Cuzick J, Swanson GP, Fisher G, Brothman AR, Berney DM, Reid JE, et al. Prognostic value of an RNA expression signature derived from cell cycle proliferation genes in patients with prostate cancer: a retrospective study. Lancet Oncol. 2011;12:245–55. doi: 10.1016/S1470-2045(10)70295-3. [DOI] [PMC free article] [PubMed] [Google Scholar]
- 30.Sommariva S, Tarricone R, Lazzeri M, Ricciardi W, Montorsi F. Prognostic Value of the Cell Cycle Progression Score in Patients with Prostate Cancer: A Systematic Review and Meta-analysis. Eur Urol. 2016;69:107–15. doi: 10.1016/j.eururo.2014.11.038. [DOI] [PubMed] [Google Scholar]
- 31.Testa JR, Zhou JY, Bell DW, Yen TJ. Chromosomal localization of the genes encoding the kinetochore proteins CENPE and CENPF to human chromosomes 4q24–>q25 and 1q32–>q41, respectively, by fluorescence in situ hybridization. Genomics. 1994;23:691–3. doi: 10.1006/geno.1994.1558. [DOI] [PubMed] [Google Scholar]
- 32.Rattner JB, Rao A, Fritzler MJ, Valencia DW, Yen TJ. CENP-F is a .ca 400 kDa kinetochore protein that exhibits a cell-cycle dependent localization. Cell Motil Cytoskeleton. 1993;26:214–26. doi: 10.1002/cm.970260305. [DOI] [PubMed] [Google Scholar]
- 33.Liu JH, Wei S, Burnette PK, Gamero AM, Hutton M, Djeu JY. Functional association of TGF-beta receptor II with cyclin B. Oncogene. 1999;18:269–75. doi: 10.1038/sj.onc.1202263. [DOI] [PubMed] [Google Scholar]
- 34.Yang J, Song H, Walsh S, Bardes ES, Kornbluth S. Combinatorial control of cyclin B1 nuclear trafficking through phosphorylation at multiple sites. J Biol Chem. 2001;276:3604–9. doi: 10.1074/jbc.M008151200. [DOI] [PubMed] [Google Scholar]
- 35.Sartor H, Ehlert F, Grzeschik KH, Muller R, Adolph S. Assignment of two human cell cycle genes, CDC25C and CCNB1, to 5q31 and 5q12, respectively. Genomics. 1992;13:911–2. doi: 10.1016/0888-7543(92)90190-4. [DOI] [PubMed] [Google Scholar]
- 36.van de Weerdt BC, Medema RH. Polo-like kinases: a team in control of the division. Cell Cycle. 2006;5:853–64. doi: 10.4161/cc.5.8.2692. [DOI] [PubMed] [Google Scholar]
- 37.Weinstein J, Jacobsen FW, Hsu-Chen J, Wu T, Baum LG. A novel mammalian protein, p55CDC, present in dividing cells is associated with protein kinase activity and has homology to the Saccharomyces cerevisiae cell division cycle proteins Cdc20 and Cdc4. Mol Cell Biol. 1994;14:3350–63. doi: 10.1128/mcb.14.5.3350. [DOI] [PMC free article] [PubMed] [Google Scholar]
- 38.Klemparskaia NN. Hoigne reaction and its modifications. Zh Mikrobiol Epidemiol Immunobiol. 1978:31–7. [PubMed] [Google Scholar]
- 39.Weinstein J. Cell cycle-regulated expression, phosphorylation, and degradation of p55Cdc. A mammalian homolog of CDC20/Fizzy/slp1. J Biol Chem. 1997;272:28501–11. doi: 10.1074/jbc.272.45.28501. [DOI] [PubMed] [Google Scholar]
- 40.Leibowitz-Amit R, Joshua AM. Targeting the androgen receptor in the management of castration-resistant prostate cancer: rationale, progress, and future directions. Curr Oncol. 2012;19:S22–31. doi: 10.3747/co.19.1281. [DOI] [PMC free article] [PubMed] [Google Scholar]
- 41.Isaacs JT. The biology of hormone refractory prostate cancer. Why does it develop? Urol Clin North Am. 1999;26:263–73. doi: 10.1016/s0094-0143(05)70066-5. [DOI] [PubMed] [Google Scholar]
- 42.Sedelaar JP, Isaacs JT. Tissue culture media supplemented with 10% fetal calf serum contains a castrate level of testosterone. Prostate. 2009;69:1724–9. doi: 10.1002/pros.21028. [DOI] [PMC free article] [PubMed] [Google Scholar]
- 43.Li J, Karki A, Hodges KB, Ahmad N, Zoubeidi A, Strebhardt K, et al. Cotargeting Polo-Like Kinase 1 and the Wnt/beta-Catenin Signaling Pathway in Castration-Resistant Prostate Cancer. Mol Cell Biol. 2015;35:4185–98. doi: 10.1128/MCB.00825-15. [DOI] [PMC free article] [PubMed] [Google Scholar]
Associated Data
This section collects any data citations, data availability statements, or supplementary materials included in this article.
Supplementary Materials
Data Availability Statement
Data generated for this study are available through the Gene Expression Omnibus (GEO) under accession number GSE 99795.