Abstract
Liver kinase B1 (Lkb1) and mammalian target of rapamycin (mTOR) are key regulators of energy metabolism and cell growth. We have previously reported that adipocyte-specific KO of Lkb1 or mTOR in mice results in distinct developmental and metabolic phenotypes. Here, we aimed to assess how genetic KO of both Lkb1 and mTOR affects adipose tissue development and function in energy homeostasis. We used Adiponectin-Cre to drive adipocyte-specific double KO (DKO) of Lkb1 and mTOR in mice. We performed indirect calorimetry, glucose and insulin tolerance tests, and gene expression assays on the DKO and WT mice. We found that DKO of Lkb1 and mTOR results in reductions of brown adipose tissue and inguinal white adipose tissue mass, but in increases of liver mass. Notably, the DKO mice developed fatty liver and insulin resistance, but displayed improved glucose tolerance after high-fat diet (HFD)-feeding. Interestingly, the DKO mice were protected from HFD-induced obesity due to their higher energy expenditure and lower expression levels of adipogenic genes (CCAAT/enhancer binding protein α and PPARγ) compared with WT mice. These results together indicate that, compared with Lkb1 or mTOR single KOs, Lkb1/mTOR DKO in adipocytes results in overlapping and distinct metabolic phenotypes, and mTOR KO largely overrides the effect of Lkb1 KO.
Keywords: adipose, metabolism, liver kinase B1, mammalian target of rapamycin
Adipose tissue, consisting of mature adipocytes and preadipocytes, plays crucial roles in regulating whole-body glucose homeostasis and energy metabolism. In mammals, three types of adipocytes, including white, brown, and beige adipocytes, have been identified (1, 2). White adipocytes, the principal cell type of the white adipose tissue (WAT), store triglycerides as energy and are closely associated with obesity (3). Brown adipocytes, the major cells in brown adipose tissue (BAT), contain numerous mitochondria with high expression of uncoupling protein 1 (UCP1) (4, 5). Beige adipocytes, identified from subcutaneous WAT, also have lots of mitochondria and a high level of UCP1 expression (1, 2). Both brown and beige adipocytes have the capacity to burn lipid to heat that can enhance energy expenditure and combat obesity (1–3). Thus, understanding the biological and molecular regulation of adipose tissue could provide useful information for controlling obesity as well as the other metabolic diseases, such as type 2 diabetes and cardiovascular disease.
Liver kinase B1 (Lkb1), also known as the serine/threonine kinase 11 (Stk11), is a tumor suppressor and plays essential roles in various metabolic tissues and cells (6–9). Lkb1 phosphorylates 14 kinases of the AMPK subfamily and regulates systemic glucose and energy homeostasis (10). In skeletal muscle, Lkb1 ablation affects skeletal muscle development and function (7, 11), enhances glucose homeostasis and insulin sensitivity (12, 13), and decreases the oxidation of lipids and fatty acids (8, 14). In adipose tissue, KO of Lkb1 impairs adipose tissue development and function (6, 9). In BAT, deletion of Lkb1 upregulates the expression of BAT-specific genes and leads to expansion of BAT through the mammalian target of rapamycin (mTOR) pathway (6).
As a downstream target of Lkb1/AMPK, mTOR is a conserved intracellular protein kinase involved in regulating protein synthesis, cell growth, and energy metabolism (15). mTOR interacts with different proteins and forms two distinct complexes: mTOR complex (mTORC)1 and mTORC2 (16). Both complexes play important roles in regulating adipogenesis, lipid homeostasis, glucose metabolism, and insulin actions (15, 17–21). In adipocytes, deletion of mTORC1 or mTORC2, respectively, results in severe but different metabolic complications (22). Adipocyte-specific KO of mTORC1 causes lipodystrophy, insulin resistance, and severe hepatic steatosis, but enhances energy expenditure and counteracts high-fat diet (HFD)-induced obesity (22–24). In BAT, loss of mTORC1 affects the BAT cold-adaptation and reduces BAT mass and lipid content (23, 25), while activation of mTORC1 in WAT elevates Ucp1, PPARγ coactivator 1α (Pgc1α), and Pparα expression (26), suggesting a positive role of mTORC1 in regulating brown and beige adipogenesis. Adipose-specific mTORC2 ablation has little effect on fat cell size or fat mass, but leads to insulin resistance, affects glucose and lipid metabolism, and protects against HFD-induced obesity (19, 20, 27, 28). Recently, Adipoq-Cre-mediated deletion of mTOR in adipose tissues not only resulted in robust reduction of fat mass, but also caused insulin resistance and fatty liver (21). Together, these reports demonstrate that both complexes of mTOR play crucial, but distinct, roles in adipogenesis and lipid metabolism.
More recently, we generated an adipocyte-specific Lkb1 and mTOR double KO (DKO) mouse model (Adipoq-Cre/Lkb1flox/flox/mTORflox/flox mice) to test whether Lkb1 regulates adipose development and growth through the mTOR pathway (6). Though the body weights of WT and DKO mice were similar, the DKO mice rescued the BAT expansion phenotype observed in Adipoq-Lkb1 mice (6), suggesting that Lkb1 affects BAT development and growth through the mTOR pathway. Although much work has so far focused on the important roles of the Lkb1-mTOR pathway in adipose development and energy homeostasis, the direct effect of adipocyte-specific deletion of Lkb1 and mTOR on adipogenesis has not been reported. Further effort is required to investigate whether Lkb1 and mTOR DKO in adipocytes impairs glucose or energy metabolism. Therefore, in this study, we directly examined the effects of adipocyte-specific Lkb1 and mTOR DKO on adipogenesis as well as glucose and lipid metabolism.
MATERIALS AND METHODS
Animals
All procedures involving mice were guided by Purdue University Animal Care and Use Committee. All mice were purchased from Jackson Laboratory under the following stock numbers: Adipoq-Cre (stock #010803), Lkb1flox/flox (stock #014143), and mTORflox/flox (stock #011009). The DKO mouse model was prepared as previously reported (6). Mice were housed and maintained in the animal facility, with free access to standard rodent chow diet or HFD (TD.06414 Harlan) and water. Male mice at 8–10 weeks of age were used unless otherwise indicated.
Indirect calorimetry study and blood glucose measurement
Indirect calorimetry study and blood glucose measurements were conducted as previously described (21).Oxygen consumption (VO2), carbon dioxide production (VCO2), respiratory exchange ratios (RERs), and heat production were measured using an indirect calorimetry system (Oxymax; Columbus Instruments). Blood glucose was measured by a glucometer (Accu-Check Active; Roche). For glucose tolerance tests (GTTs), mice were given an intraperitoneal injection of 100 mg ml−1 D-glucose (2 g kg−1 body weight for standard diet, 1 g kg−1 for HFD) after overnight fasting. For insulin tolerance tests (ITTs), mice were fasted for 4 h before intraperitoneal administration of human insulin (Santa Cruz) (0.75 U kg−1 body weight). After injection, tail blood glucose concentrations were measured.
Primary adipocyte isolation, culture, and differentiation
BAT and WAT stromal vascular fraction cells were isolated using collagenase digestion. For adipogenic differentiation, cells were induced to differentiate when they reached 90% confluence.
Oil Red O staining
Oil Red O staining was conducted as previously described (21). Briefly, cultured cells or liver sections were stained using the Oil Red O work solutions containing 6 ml Oil Red O stock solution (5 g/l in isopropanol) and 4 ml ddH2O for 30 min. After staining, the cells or liver sections were washed and photographed.
Total RNA extraction, cDNA synthesis, and real-time PCR
Total RNA was extracted from tissues or cells using Trizol reagent. The purity and concentration of total RNA were measured, and then 5 μg of total RNA was reversed transcribed. Real-time PCR was carried out and the 2−ΔΔCT method was used to analyze the relative changes in gene expression normalized against 18S rRNA as internal control.
Protein extraction and Western blot analysis
Total protein was extracted from cells or tissues using RIPA buffer. Protein separation and Western blot analysis were conducted as previously described (21). The UCP1 antibody was from Abcam (Cambridge, MA); the pS6 and S6 antibodies were from Cell Signaling; and all other antibodies were from Santa Cruz Biotechnology (Dallas, TX).
Data analysis
All experimental data are presented as mean ± SEM. Comparisons were made by unpaired two-tailed Student’s t-tests. Effects were considered as significant at P < 0.05.
RESULTS
DKO of Lkb1 and mTOR in adipocytes affects BAT, inguinal WAT, and liver mass
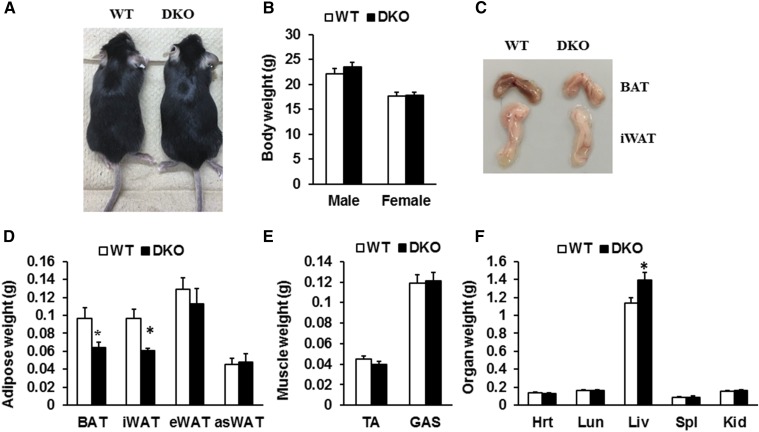
First, we directly examined the effects of Lkb1 and mTOR ablation in adipocytes on animal growth and tissue/organ weight by using the DKO mouse model generated previously (6). We found that the DKO mice were born at normal Mendelian ratios, with normal body weight and similar growth rate to WT littermates under standard chow diet. At 8 weeks of age, the DKO mice were indistinguishable from their WT littermates (Fig. 1A). The body weight of the DKO mice was similar to WT mice (Fig. 1B). Notably, the mass of BAT and inguinal WAT (iWAT) from the DKO mice was 30% and 37% less than that of WT littermates, respectively (Fig. 1C, D). However, the weight of epididymal WAT (eWAT) and anterior subcutaneous WAT (asWAT), as well as muscle mass, from the DKO mice were unchanged (Fig. 1D, E). In addition, the mass of heart, lung, spleen, and kidney was unchanged (Fig. 1F). Strikingly, liver weight was dramatically increased (Fig. 1F). Taken together, adipocyte-specific deletion of Lkb1 and mTOR led to reduction of BAT and iWAT, but expansion of liver.
Fig. 1.
Effect of Lkb1 and mTOR DKO on body weight and tissue mass. A: Representative image of WT and DKO mice. B: Body weight of WT and DKO mice (male, n = 6; female, n = 5). C: Representative images of BAT and iWAT depots. D–F: Weights of adipose (D) and nonadipose tissues (E, F) (n = 6). Comparisons were made by unpaired two-tailed Student’s t-tests. Error bars, SEM; *P < 0.05. TA, tibialis anterior muscle; GAS, gastrocnemius muscle; Hrt, heart; Lun, lung; Liv, liver; Spl, spleen; Kid, kidney. Male mice at 8–10 weeks of age were used unless otherwise indicated.
Adipocyte-specific deletion of Lkb1 and mTOR results in insulin resistance
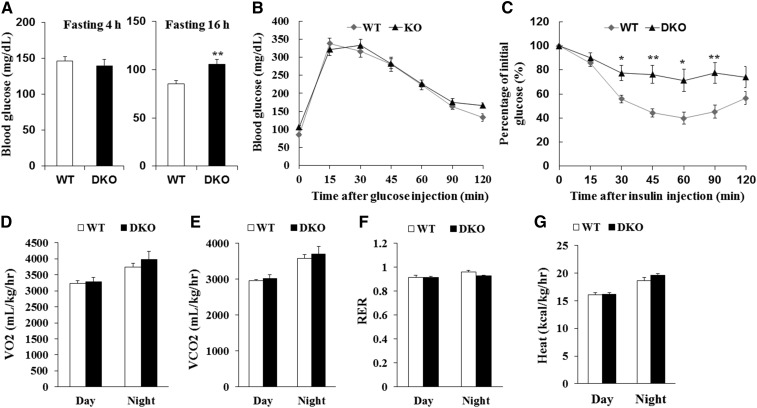
Adipose tissues regulate whole-body glucose hemostasis and insulin sensitivity (29). To determine whether reduction of BAT and iWAT mass in DKO mice affected whole-body glucose metabolism and insulin sensitivity, we conducted GTTs and ITTs. Compared with WT littermates, the DKO mice had higher blood glucose levels after fasting for 16 h (Fig. 2A). However, the DKO mice had similar glucose levels after glucose injection compared with WT mice (Fig. 2B). Notably, slower insulin-stimulated glucose clearance was observed in DKO mice compared with WT mice (Fig. 2C). In addition, the DKO mice had similar rates of VO2 and VCO2, RER, and heat production compared with WT mice (Fig. 2D–G). Taken together, these results suggest that loss of Lkb1 and mTOR in adipocytes does not affect energy metabolism, but causes severe insulin resistance under chow diet conditions.
Fig. 2.
Induced insulin resistance in DKO mice. A: Fasting glucose levels (n = 9). B, C: Blood glucose concentrations during intraperitoneal GTTs (B) (n = 9) and intraperitoneal ITTs (C) (WT, n = 8; DKO, n = 9) performed on WT and KO mice. D–G: Average VO2 (D), VCO2 (E), RER (F), and heat production (G) performed on WT and DKO mice (n = 5). Comparisons were made by unpaired two-tailed Student’s t-tests. Error bars represent SEM. *P < 0.05, **P < 0.01.
DKO mice are resistant to HFD-induced obesity
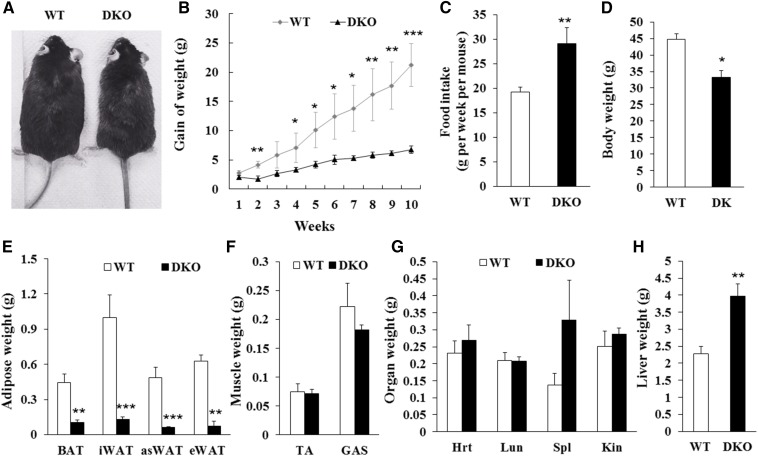
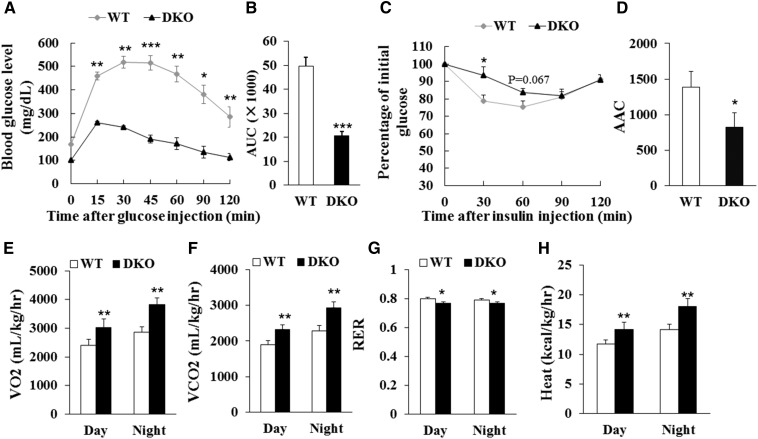
To examine the long-term effect of DKO on insulin sensitivity and energy metabolism, we fed the DKO mice and WT littermates with HFD for 10 weeks. The DKO mice were observed to be much leaner than WT mice after HFD feeding (Fig. 3A). Although the body weight of DKO mice was similar to WT mice before HFD feeding, the body weight gain of the DKO mice was less than that of WT mice starting at 2 weeks after HFD feeding, even though larger amounts of food were consumed (Fig. 3B, C). After HFD feeding, the body weight of WT mice was 44.6 ± 1.8 g, while that of the DKO mice was only 33.2 ± 2.0 g (Fig. 3D). Notably, the mass of BAT, iWAT, asWAT, and eWAT from the DKO mice was 77, 87, 87, and 88% less than that of WT littermates, respectively (Fig. 3E). Muscle mass and organ weight in DKO mice were similar to WT mice (Fig. 3F, G). Liver mass in the DKO mice was significantly increased (DKO 3.98 ± 0.36 g vs. WT 2.27 ± 0.21 g) (Fig. 3H). Moreover, the DKO mice had better glucose tolerance, but less insulin sensitivity, than WT mice after HFD feeding (Fig. 4A–D). In addition, the DKO mice had higher VO2 and VCO2 production, higher heat production, and lower RER than the WT mice after HFD feeding (Fig. 4E–H; supplemental Fig. S1A–D), reflecting an increase in energy expenditure and fatty acid oxidation. Furthermore, the liver mass of the DKO mice was larger than that of WT mice under standard chow diet or under HFD (Figs. 1F, 3H; supplemental Fig. S2A). Notably, the lipid content was much higher in the livers of the DKO mice compared with WT mice after HFD feeding (supplemental Fig. S2B). These results together suggest that adipocyte-specific deletion of Lkb1 and mTOR results in fatty liver, but protects against HFD-induced obesity.
Fig. 3.
Adipocyte-specific deletion of Lkb1 and mTOR protects mice from HFD-induced obesity. A: Representatives of WT and DKO mice fed with HFD for 10 weeks. B, C: Body weight gains (B) and food intake (C) of WT (n = 5) and DKO (n = 3) mice during HFD feeding. D–H: Body weight (D), adipose tissue mass (E), muscle mass (F), and organ mass (G, H) of WT (n = 5) and DKO (n = 3) mice after 10 weeks on HFD. Comparisons were made by unpaired two-tailed Student’s t-tests. Error bars represent SEM. *P < 0.05, **P < 0.01, ***P < 0.001.
Fig. 4.
Lkb1 and mTOR DKO affects glucose and energy metabolism in mice after HFD feeding. A, B: Blood glucose concentrations and area under curve (AUC) during GTT (A, B) (WT, n = 9; DKO, n = 8) after 10 week HFD. C, D: Blood glucose concentrations and area above curve (AAC) during ITT (C, D) (n = 7) after 10 week HFD. E–H: Average day and night VO2 (E), VCO2 (F), RER (G), and heat production (H) of WT (n = 4) and DKO (n = 3) mice after 10 week HFD. Comparisons were made by unpaired two-tailed Student’s t-tests. Error bars represent SEM. *P < 0.05, **P < 0.01, ***P < 0.001.
Lkb1 and mTOR deficiency affects adipogenesis through downregulating PPARγ and C/EBPα
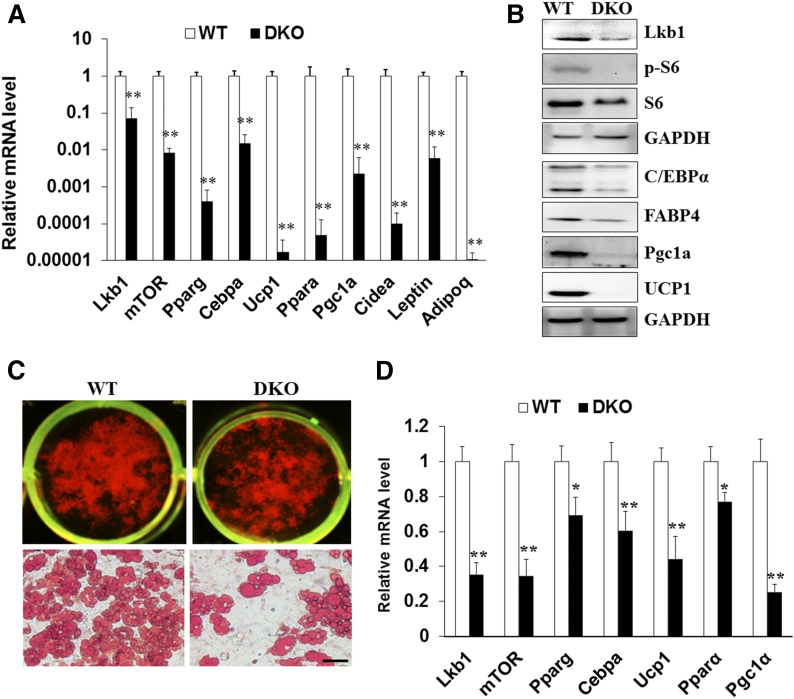
To further investigate how Lkb1 and mTOR DKO protects against HFD-induced obesity, we examined the mitochondrial function- and adipogenesis-related genes. Consistent with our previous results (6), Lkb1 deficiency in BAT expressed higher levels of UCP1 and the mTOR signaling protein, pS6, and lower levels of pAMPK than WT BAT (supplemental Fig. S3A). Notably, the DKO BAT appeared whiter than that of WT mice (Fig. 1C), indicating that Lkb1 and mTOR deficiency drives whitening of BAT. Indeed, Lkb1 and mTOR DKO dramatically decreased the expression of UCP1 and PGC1α in BAT tissue (supplemental Fig. S3A). Consistently, the expression of UCP1, PGC1α, and PPARα in DKO BAT was lower than that of WT mice after HFD feeding (Fig. 5A, B). The lipid accumulation and mRNA levels of Ucp1, Pgc1a, and Ppara in cultured DKO BAT adipocytes were dramatically decreased (Fig. 5C, D). Together, these results demonstrate that DKO of Lkb1 and mTOR may impact UCP1 and mitochondrial-related gene expression.
Fig. 5.
Deletion of Lkb1 and mTOR decreases the expression of adipogenesis and mitochondrial function-related genes in BAT and cultured brown adipocytes. A, B: mRNA (A) and protein (B) levels of adipogenesis and mitochondrial function-related genes in BAT from WT and DKO mice after 10 weeks of HFD feeding (n = 5). C: Oil Red O staining of cultured WT and DKO brown adipocytes. D: mRNA levels of adipogenesis and mitochondrial function-related genes in differentiated WT and KO brown adipocytes (n = 3). Comparisons were made by unpaired two-tailed Student’s t-tests. Error bars represent SEM. *P < 0.05, **P < 0.01.
To further confirm that DKO could affect the expression of mitochondrial-related genes, we examined the expression of mitochondrial proteins using the mitochondrial antibody cocktail (21). We found that Lkb1-deficient BAT expressed higher levels of mitochondrial function-related proteins than WT BAT (supplemental Fig. S3B). Remarkably, DKO BAT expressed lower levels of mitochondrial function-related proteins, including ubiquinol-cytochrome c reductase core protein II, cytochrome c oxidase I, succinate dehydrogenase complex iron sulfur subunit B, and NADH:ubiquinone oxidoreductase subunit B8 (supplemental Fig. S3B). In addition, similar expression of mitochondrial proteins in iWAT was found between the DKO and WT mice (supplemental Fig. S3B). Likewise, lower levels of UCP1, PGC1α, and PPARα in HFD-fed DKO iWAT were found (supplemental Fig. S4A, B). Consistently, Lkb1 and mTOR DKO reduced the lipid accumulation and the expression Ucp1, Pgc1α, and Pparα in iWAT adipocytes (supplemental Fig. S4C, D). These results indicated that DKO of Lkb1 and mTOR decreases the expression of the mitochondrial-related proteins in adipose tissues.
To determine how Lkb1 and mTOR ablation affect fat development and lipid accumulation, we examined the expression of CCAAT/enhancer binding protein α (C/EBPα) and PPARγ, two key transcription factors that control adipogenesis (30). Real-time PCR and Western blotting results indicated that Lkb1 and mTOR deficiency dramatically decreased the expression of PPARγ and C/EBPα in BAT after HFD feeding, as well as in BAT cell cultures (Fig. 5A–D). Consistently, similar results were found using iWAT tissues and differentiated iWAT adipocytes from the DKO and WT mice (supplemental Fig. S4). These results reveal a significant reduction of adipogenesis-related gene expression, together with an increase in fatty acid oxidation, both of which might contribute to the reduced adiposity in the HFD-fed DKO mice.
DISCUSSION
Here, we generated the adipocyte-specific Lkb1 and mTOR DKO mouse model and directly determined the effects of Lkb1 and mTOR deficiency on adipose development, glucose homeostasis, and insulin sensitivity. We provided evidence that Lkb1 and mTOR DKO inhibits BAT and iWAT development and decreases lipid accumulation and differentiation of adipocytes. Moreover, we presented that DKO of Lkb1 and mTOR causes downregulation of mitochondrial-related genes and insulin resistance, but protects against HFD-induced obesity. We further elucidated that Lkb1 and mTOR ablation inhibits adipogenesis and fat deposition through upregulating fatty acid oxidation and downregulating the C/EBPα and PPARγ signaling pathways. Our study directly reveals a regulatory role of the Lkb1/mTOR signaling pathway in adipose tissue development, energy metabolism, and insulin sensitivity.
The Lkb1 and mTOR signaling pathways play crucial roles in regulating adipose development and growth (6, 9, 21, 22, 31). We found that Lkb1 and mTOR DKO reduces BAT and iWAT mass under normal chow diet or HFD. Consistent with our current results, adipocyte-specific deletion of mTOR inhibits BAT and WAT development and growth (21). In addition, inhibition of mTORC1 or deletion of mTORC1 signaling components, Raptor or S6K1, also results in reduction of fat mass and fat cell sizes (24, 32, 33) and lipodystrophy (23), suggesting that mTORC1 is a positive regulator of adipose development and growth. Moreover, Ucp1-Cre-mediated BAT-specific deletion of Raptor also reduces BAT mass and lipid content (23). Differently, these phenotypes were not observed in the Rictor-deficient mice (20, 27). Taken together, we conclude that the reduction of fat mass in DKO mice may be mainly due to the ablation of mTORC1.
We found that DKO mice are resistant to HFD-induced obesity. Likewise, Adipoq-Cre-mediated Raptor deletion mice have normal energy expenditure, but are resistant to HFD-induced obesity (23). Consistently, the Adipoq-Cre-driven Rictor ablation mice are resistant to body weight gain on HFD (28). In addition, Myf5-Cre-induced Rictor KO mice are resistant to diet-induced obesity and hepatic steatosis when living at thermoneutrality (18). Adipocyte-specific deletion of Lkb1 is also resistant to HFD-induced obesity (6). This resistance to diet-induced obesity may be associated with the expansion of BAT, browning of sWAT, high UCP1 expression, and energy expenditure in the Lkb1 deletion mice (6). Differently, DKO mice had reduction of BAT and iWAT mass and low levels of UCP1 and mitochondria-related proteins. Likewise, loss of Raptor in all mature adipocytes affects BAT expansion and adaptation to cold (25). Without functional mTORC1, Ucp1 expression in WAT cannot be induced by cold or βAR3 agonists (34, 35). Inhibition of mTOR with rapamycin blocks WAT browning (34, 35). Activation of mTORC1 by deleting its negative regulator, TSC1, increases the expression of Ucp1, Pgc1a, and Pparα (26). Though mTORC2 is essential for BAT thermogenesis, the mitochondrial size and function appear normal in Rictor ablation mice (36). Taken together, the downregulation of Ucp1 and mitochondrial proteins in DKO mice is mainly caused by the deletion of mTORC1 in adipocytes.
Previous studies revealed that mTORC1 signaling promotes adipogenesis (37, 38), while mTORC2 is dispensable for adipogenesis (20, 27). C/EBPα and PPARγ are the two key regulators of adipocyte differentiation and lipogenesis (30). mTORC1 promotes the terminal differentiation of preadipocytes and affects lipogenesis by controlling multiple effectors, including PPARγ, Lipin1, and SREBP-1 (38, 39). We found that DKO of Lkb1 and mTOR decreased the expression of PPARγ and C/EBPα in adipose tissues or in cultured adipocytes. Thus, the inhibition of adipogenesis leads to the reduction of adiposity in the HFD-fed DKO mice.
We found that DKO mice have fatty liver and insulin resistance. Similar to our results, Adipoq-Cre-mediated Raptor deletion mice develop systemic metabolic disease, including hepatomegaly, hepatic steatosis, and insulin resistance (23). Likewise, adipocyte-specific deletion of Rictor leads to insulin resistance and defects in adipocyte glucose uptake, and elevates lipolysis and steatosis (20, 27, 28). However, DKO mice exhibit better glucose tolerance and worse insulin sensitivity compared with WT mice after HFD feeding. We speculate that profound fatty liver or dysplastic hepatic nodules in DKO mice accompanied by glycogen storage dysfunction and accelerating glucose utilization might be account for this phenomenon (40). In addition, another explanation could be hypersecretion of insulin in DKO mice because of insulin resistance. Opposite to our current results, ablation of Lkb1 in adipocytes improved insulin sensitivity and decreased lipid accumulation in the liver (6). Previous studies reported that adipose-specific Rictor deletion mice have hyperinsulinemia and reduced glucose uptake into adipocytes, which could promote hepatic glucose and lipid production and drive hepatic insulin resistance (22, 28, 41). These findings suggest that mTOR in adipocytes controls lipid and glucose metabolism and impacts hepatic lipid synthase and metabolism pathways (22). Thus, the insulin resistance and fatty liver in DKO mice are the result of the loss of function of mTOR in adipose tissue.
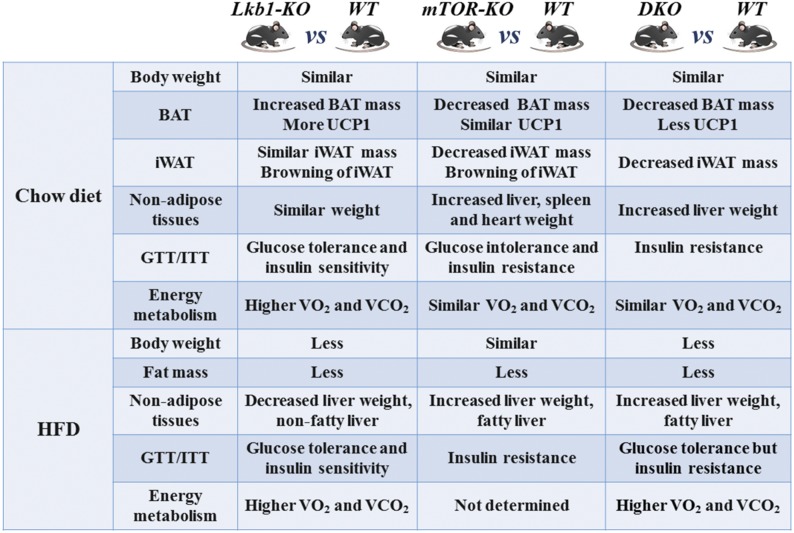
The similarities and differences among the Lkb1-KO (Adipoq-Lkb1) (6), mTOR-KO (Adipoq-mTOR) (21), and DKO mouse phenotypes are presented in Fig. 6. In conclusion, we revealed the effects of DKO of Lkb1 and mTOR on adipose growth, energy expenditure, glucose metabolism, and insulin sensitivity. Our results directly demonstrate the effects of Lkb1 and mTOR during adipogenesis and suggest that that the Lkb1-mTOR signaling pathway could be used as a potential therapeutic target to combat obesity and other metabolic diseases.
Fig. 6.
Similarities and differences between the Lkb1-KO [Adipoq-Lkb1 (6)], mTOR-KO [Adipoq-mTOR (21)], and DKO mouse phenotypes.
Supplementary Material
Acknowledgments
The authors thank Jun Wu for mouse colony maintenance and technical support, and members of the Kuang Laboratory for comments.
Footnotes
Abbreviations:
- asWAT
- anterior subcutaneous white adipose tissue
- BAT
- brown adipose tissue
- C/EBPα
- CCAAT/enhancer binding protein α
- DKO
- double KO
- eWAT
- epididymal white adipose tissue
- GTT
- glucose tolerance test
- HFD
- high-fat diet
- iWAT
- inguinal white adipose tissue
- ITT
- insulin tolerance test
- Lkb1
- liver kinase B1
- mTOR
- mammalian target of rapamycin
- mTORC
- mammalian target of rapamycin complex
- PGC1α
- PPARγ coactivator 1α
- RER
- respiratory exchange ratio
- UCP1
- uncoupling protein 1
- VCO2
- carbon dioxide production
- VO2
- oxygen consumption
- WAT
- white adipose tissue
This work was partially supported by Foundation for the National Institutes of Health Grant R01AR060652 (S.K.), National Natural Science Foundation of China Grant 31672427, Natural Science Foundation of Zhejiang Province Grant LR17C170001, and the “Hundred Talents Program” funding from Zhejiang University to T.S. The content is solely the responsibility of the authors and does not necessarily represent the official views of the National Institutes of Health. The authors declare no competing financial interests.
The online version of this article (available at http://www.jlr.org) contains a supplement.
REFERENCES
- 1.Wu J., Bostrom P., Sparks L. M., Ye L., Choi J. H., Giang A. H., Khandekar M., Virtanen K. A., Nuutila P., Schaart G., et al. 2012. Beige adipocytes are a distinct type of thermogenic fat cell in mouse and human. Cell. 150: 366–376. [DOI] [PMC free article] [PubMed] [Google Scholar]
- 2.Wu J., Cohen P., and Spiegelman B. M.. 2013. Adaptive thermogenesis in adipocytes: is beige the new brown? Genes Dev. 27: 234–250. [DOI] [PMC free article] [PubMed] [Google Scholar]
- 3.Waldén T. B., Hansen I. R., Timmons J. A., Cannon B., and Nedergaard J.. 2012. Recruited vs. nonrecruited molecular signatures of brown, “brite,” and white adipose tissues. Am. J. Physiol. Endocrinol. Metab. 302: E19–E31. [DOI] [PubMed] [Google Scholar]
- 4.Oelkrug R., Polymeropoulos E. T., and Jastroch M.. 2015. Brown adipose tissue: physiological function and evolutionary significance. J. Comp. Physiol. B. 185: 587–606. [DOI] [PubMed] [Google Scholar]
- 5.Cannon B., and Nedergaard J.. 2004. Brown adipose tissue: function and physiological significance. Physiol. Rev. 84: 277–359. [DOI] [PubMed] [Google Scholar]
- 6.Shan T., Xiong Y., Zhang P., Li Z., Jiang Q., Bi P., Yue F., Yang G., Wang Y., Liu X., et al. 2016. Lkb1 controls brown adipose tissue growth and thermogenesis by regulating the intracellular localization of CRTC3. Nat. Commun. 7: 12205. [DOI] [PMC free article] [PubMed] [Google Scholar]
- 7.Shan T., Zhang P., Liang X., Bi P., Yue F., and Kuang S.. 2014. Lkb1 is indispensable for skeletal muscle development, regeneration, and satellite cell homeostasis. Stem Cells. 32: 2893–2907. [DOI] [PMC free article] [PubMed] [Google Scholar]
- 8.Jeppesen J., Maarbjerg S. J., Jordy A. B., Fritzen A. M., Pehmoller C., Sylow L., Serup A. K., Jessen N., Thorsen K., Prats C., et al. 2013. LKB1 regulates lipid oxidation during exercise independently of AMPK. Diabetes. 62: 1490–1499. [DOI] [PMC free article] [PubMed] [Google Scholar]
- 9.Zhang W., Wang Q., Song P., and Zou M. H.. 2013. Liver kinase b1 is required for white adipose tissue growth and differentiation. Diabetes. 62: 2347–2358. [DOI] [PMC free article] [PubMed] [Google Scholar] [Retracted]
- 10.Lizcano J. M., Goransson O., Toth R., Deak M., Morrice N. A., Boudeau J., Hawley S. A., Udd L., Makela T. P., Hardie D. G., et al. 2004. LKB1 is a master kinase that activates 13 kinases of the AMPK subfamily, including MARK/PAR-1. EMBO J. 23: 833–843. [DOI] [PMC free article] [PubMed] [Google Scholar]
- 11.Thomson D. M., Hancock C. R., Evanson B. G., Kenney S. G., Malan B. B., Mongillo A. D., Brown J. D., Hepworth S., Fillmore N., Parcell A. C., et al. 2010. Skeletal muscle dysfunction in muscle-specific LKB1 knockout mice. J. Appl. Physiol. 108: 1775–1785. [DOI] [PMC free article] [PubMed] [Google Scholar]
- 12.Koh H. J., Arnolds D. E., Fujii N., Tran T. T., Rogers M. J., Jessen N., Li Y. F., Liew C. W., Ho R. C., Hirshman M. F., et al. 2006. Skeletal muscle-selective knockout of LKB1 increases insulin sensitivity, improves, glucose homeostasis, and decreases TRB3. Mol. Cell. Biol. 26: 8217–8227. [DOI] [PMC free article] [PubMed] [Google Scholar]
- 13.Sakamoto K., McCarthy A., Smith D., Green K. A., Hardie D. G., Ashworth A., and Alessi D. R.. 2005. Deficiency of LKB1 in skeletal muscle prevents AMPK activation and glucose uptake during contraction. EMBO J. 24: 1810–1820. [DOI] [PMC free article] [PubMed] [Google Scholar]
- 14.Thomson D. M., Brown J. D., Fillmore N., Condon B. M., Kim H. J., Barrow J. R., and Winder W. W.. 2007. LKB1 and the regulation of malonyl-CoA and fatty acid oxidation in muscle. Am. J. Physiol. Endocrinol. Metab. 293: E1572–E1579. [DOI] [PubMed] [Google Scholar]
- 15.Lamming D. W., and Sabatini D. M.. 2013. A central role for mTOR in lipid homeostasis. Cell Metab. 18: 465–469. [DOI] [PMC free article] [PubMed] [Google Scholar]
- 16.Laplante M., and Sabatini D. M.. 2012. mTOR signaling in growth control and disease. Cell. 149: 274–293. [DOI] [PMC free article] [PubMed] [Google Scholar]
- 17.Soukas A. A., Kane E. A., Carr C. E., Melo J. A., and Ruvkun G.. 2009. Rictor/TORC2 regulates fat metabolism, feeding, growth, and life span in Caenorhabditis elegans. Genes Dev. 23: 496–511. [DOI] [PMC free article] [PubMed] [Google Scholar]
- 18.Hung C. M., Calejman C. M., Sanchez-Gurmaches J., Li H. W., Clish C. B., Hettmer S., Wagers A. J., and Guertin D. A.. 2014. Rictor/mTORC2 loss in the Myf5 lineage reprograms brown fat metabolism and protects mice against obesity and metabolic disease. Cell Reports. 8: 256–271. [DOI] [PMC free article] [PubMed] [Google Scholar]
- 19.Olsen J. M., Sato M., Dallner O. S., Sandstrom A. L., Pisani D. F., Chambard J. C., Amri E. Z., Hutchinson D. S., and Bengtsson T.. 2014. Glucose uptake in brown fat cells is dependent on mTOR complex 2-promoted GLUT1 translocation. J. Cell Biol. 207: 365–374. [DOI] [PMC free article] [PubMed] [Google Scholar]
- 20.Kumar A., Lawrence J. C., Jung D. Y., Ko H. J., Keller S. R., Kim J. K., Magnuson M. A., and Harris T. E.. 2010. Fat cell-specific ablation of rictor in mice impairs insulin-regulated fat cell and whole-body glucose and lipid metabolism. Diabetes. 59: 1397–1406. [DOI] [PMC free article] [PubMed] [Google Scholar]
- 21.Shan T., Zhang P., Jiang Q., Xiong Y., Wang Y., and Kuang S.. 2016. Adipocyte-specific deletion of mTOR inhibits adipose tissue development and causes insulin resistance in mice. Diabetologia. 59: 1995–2004. [DOI] [PMC free article] [PubMed] [Google Scholar]
- 22.Lee P. L., Jung S. M., and Guertin D. A.. 2017. The complex roles of mechanistic target of rapamycin in adipocytes and beyond. Trends Endocrinol. Metab. 28: 319–339. [DOI] [PMC free article] [PubMed] [Google Scholar]
- 23.Lee P. L., Tang Y. F., Li H. W., and Guertin D. A.. 2016. Raptor/mTORC1 loss in adipocytes causes progressive lipodystrophy and fatty liver disease. Mol. Metab. 5: 422–432. [DOI] [PMC free article] [PubMed] [Google Scholar]
- 24.Um S. H., Frigerio F., Watanabe M., Picard F., Joaquin M., Sticker M., Fumagalli S., Allegrini P. R., Kozma S. C., Auwerx J., et al. 2004. Absence of S6K1 protects against age- and diet-induced obesity while enhancing insulin sensitivity. Nature. 431: 200–205. [DOI] [PubMed] [Google Scholar]
- 25.Labbe S. M., Mouchiroud M., Caron A., Secco B., Freinkman E., Lamoureux G., Gelinas Y., Lecomte R., Bosse Y., Chimin P., et al. 2016. mTORC1 is required for brown adipose tissue recruitment and metabolic adaptation to cold. Sci. Rep. 6: 37223. [DOI] [PMC free article] [PubMed] [Google Scholar]
- 26.Magdalon J., Chimin P., Belchior T., Neves R. X., Vieira-Lara M. A., Andrade M. L., Farias T. S., Bolsoni-Lopes A., Paschoal V. A., Yamashita A. S., et al. 2016. Constitutive adipocyte mTORC1 activation enhances mitochondrial activity and reduces visceral adiposity in mice. Biochim. Biophys. Acta. 1861: 430–438. [DOI] [PubMed] [Google Scholar]
- 27.Cybulski N., Polak P., Auwerx J., Ruegg M. A., and Hall M. N.. 2009. mTOR complex 2 in adipose tissue negatively controls whole-body growth. Proc. Natl. Acad. Sci. USA. 106: 9902–9907. [DOI] [PMC free article] [PubMed] [Google Scholar]
- 28.Tang Y., Wallace M., Sanchez-Gurmaches J., Hsiao W. Y., Li H., Lee P. L., Vernia S., Metallo C. M., and Guertin D. A.. 2016. Adipose tissue mTORC2 regulates ChREBP-driven de novo lipogenesis and hepatic glucose metabolism. Nat. Commun. 7: 11365. [DOI] [PMC free article] [PubMed] [Google Scholar]
- 29.Stanford K. I., Middelbeek R. J. W., Townsend K. L., An D., Nygaard E. B., Hitchcox K. M., Markan K. R., Nakano K., Hirshman M. F., Tseng Y. H., et al. 2013. Brown adipose tissue regulates glucose homeostasis and insulin sensitivity. J. Clin. Invest. 123: 215–223. [DOI] [PMC free article] [PubMed] [Google Scholar]
- 30.Rosen E. D., and MacDougald O. A.. 2006. Adipocyte differentiation from the inside out. Nat. Rev. Mol. Cell Biol. 7: 885–896. [DOI] [PubMed] [Google Scholar]
- 31.Cai H., Dong L. Q., and Liu F.. 2016. Recent advances in adipose mTOR signaling and function: therapeutic prospects. Trends Pharmacol. Sci. 37: 303–317. [DOI] [PMC free article] [PubMed] [Google Scholar]
- 32.Polak P., Cybulski N., Feige J. N., Auwerx J., Ruegg M. A., and Hall M. N.. 2008. Adipose-specific knockout of raptor results in lean mice with enhanced mitochondrial respiration. Cell Metab. 8: 399–410. [DOI] [PubMed] [Google Scholar]
- 33.Xiang X., Lan H., Tang H., Yuan F., Xu Y., Zhao J., Li Y., and Zhang W.. 2015. Tuberous sclerosis complex 1-mechanistic target of rapamycin complex 1 signaling determines brown-to-white adipocyte phenotypic switch. Diabetes. 64: 519–528. [DOI] [PubMed] [Google Scholar]
- 34.Tran C. M., Mukherjee S., Ye L., Frederick D. W., Kissig M., Davis J. G., Lamming D. W., Seale P., and Baur J. A.. 2016. Rapamycin blocks induction of the thermogenic program in white adipose tissue. Diabetes. 65: 927–941. [DOI] [PMC free article] [PubMed] [Google Scholar]
- 35.Liu D., Bordicchia M., Zhang C., Fang H., Wei W., Li J. L., Guilherme A., Guntur K., Czech M. P., and Collins S.. 2016. Activation of mTORC1 is essential for beta-adrenergic stimulation of adipose browning. J. Clin. Invest. 126: 1704–1716. [DOI] [PMC free article] [PubMed] [Google Scholar]
- 36.Albert V., Svensson K., Shimobayashi M., Colombi M., Munoz S., Jimenez V., Handschin C., Bosch F., and Hall M. N.. 2016. mTORC2 sustains thermogenesis via Akt-induced glucose uptake and glycolysis in brown adipose tissue. EMBO Mol. Med. 8: 232–246. [DOI] [PMC free article] [PubMed] [Google Scholar]
- 37.Kim J. E., and Chen J.. 2004. Regulation of peroxisome proliferator-activated receptor-gamma activity by mammalian target of rapamycin and amino acids in adipogenesis. Diabetes. 53: 2748–2756. [DOI] [PubMed] [Google Scholar]
- 38.Laplante M., and Sabatini D. M.. 2009. An emerging role of mTOR in lipid biosynthesis. Curr. Biol. 19: R1046–R1052. [DOI] [PMC free article] [PubMed] [Google Scholar]
- 39.Peterson T. R., Sengupta S. S., Harris T. E., Carmack A. E., Kang S. A., Balderas E., Guertin D. A., Madden K. L., Carpenter A. E., Finck B. N., et al. 2011. mTOR complex 1 regulates lipin 1 localization to control the SREBP pathway. Cell. 146: 408–420. [DOI] [PMC free article] [PubMed] [Google Scholar]
- 40.Softic S., Boucher J., Solheim M. H., Fujisaka S., Haering M. F., Homan E. P., Winnay J., Perez-Atayde A. R., and Kahn C. R.. 2016. Lipodystrophy due to adipose tissue-specific insulin receptor knockout results in progressive NAFLD. Diabetes. 65: 2187–2200. [DOI] [PMC free article] [PubMed] [Google Scholar]
- 41.Kim M. S., Krawczyk S. A., Doridot L., Fowler A. J., Wang J. X., Trauger S. A., Noh H. L., Kang H. J., Meissen J. K., Blatnik M., et al. 2016. ChREBP regulates fructose-induced glucose production independently of insulin signaling. J. Clin. Invest. 126: 4372–4386. [DOI] [PMC free article] [PubMed] [Google Scholar]
Associated Data
This section collects any data citations, data availability statements, or supplementary materials included in this article.


