

Abstract
C-terminal polylysine (PL) can be synthesized from the polyadenine tail of prematurely cleaved mRNAs or when a read-though of a stop codon happens. Due to the highly positive charge, PL stalls in the electrostatically negative ribosomal exit channel. The stalled polypeptide recruits the Ribosome-associated quality control (RQC) complex which processes and extracts the nascent chain. Dysfunction of the RQC leads to the accumulation of PL-tagged proteins, induction of a stress response, and cellular toxicity. Not much is known about the PL-specific aspect of protein quality control. Using quantitative mass spectrometry, we uncovered the post-ribosomal PL-processing machinery in human cytosol. It encompasses key cytosolic complexes of the proteostasis network, such as chaperonin TCP-1 ring complexes (TRiC) and half-capped 19S-20S proteasomes. Furthermore, we found that the nuclear transport machinery associates with PL, which suggests a novel mechanism by which faulty proteins can be compartmentalized in the cell. The enhanced nuclear import of a PL-tagged polypeptide confirmed this implication, which leads to questions regarding the biological rationale behind it.
Keywords: translational read-through, polylysine, protein quality control, chaperone, proteasome, protein degradation
Introduction
Homopolymeric amino acid repeats are found in protein across all kingdoms of life.1 Their structural and functional relevance remains enigmatic. One exception in this regard is C-terminal polylysine (PL). PL is a conditionally added sequence that can mark nascent polypeptide chains. An impressive progress has been achieved recently in understanding how PL-tagged proteins are generated and processed in yeast.2−4 Polyadenine tails (poly(A)) of mRNA molecules act as templates encoding PL. Two main mechanisms lead to the poly(A) translation by ribosomes. One is the read-through when a stop codon preceding the poly(A) fails to terminate the translation. Depending on sequence context and conditions, the read-through can reach 10% efficiency or even higher.5 The second mechanism relies on the premature cleavage and polyadenylation of an mRNA. This faulty processing can result in an open reading frame including poly(A); when translated, the PL-tagged protein will be synthesized. The prevalence of premature polyadenylation in yeast and mammalian cells has been estimated to be 5% and 1%, respectively.6
The side chain amino groups in PL are positively charged at physiological pH that results in electrostatic repulsion and leads to the extended conformation of the polymer. PL can undergo conformational transitions between α-helices, random coils, and β-strands.7,8 However, the positive charges of PL, not the structure, seem to determine its translation-stalling potential while in the negative electrostatic environment of the ribosomal exit tunnel.9 The stalled polypeptides recruit the nascent chain processing and extraction machinery called Ribosome-associated quality control (RQC) complex. The RQC complex is conserved in eukaryotes. In yeasts, it includes the ubiquitin ligase Ltn1; the hexameric AAA protein Cdc48 with its co-factors Ufd1 and Npl4; and two specialized proteins, Rqc1 and Rqc2. The respective human proteins are called Listerin, p97, UFD1L, NPLOC4, TCF25, and NEMF. Stalled ribosomes have to be dissociated first because the RQC complex docks only on the exposed 60S particles at the interface with the 40S in intact 80S monosomes. In collaboration with the cognate E2, Ltn1 ubiquitylates stalled chains10 that render them extractable by Cdc4811,12 and degradable by the 26S proteasome. Rqc2, another component of RQC, mediates the template-free addition of several alanines and threonines to the C-terminal end of the stalled polypeptide, the so-called CAT tail.13
The dysfunction of RQC results in aggregation of PL-tagged polypeptides.14−16 Mass spectrometry (MS) analyses revealed an extensive network of molecular chaperones in the aggregates that included the HSP70 family members Ssa1 and Ssa2; the HSP90 family representative Hsp82; and a number of their co-factors, such as Sis1, Sgt2, and Cns1, among others.14,16 Persistent association with chaperones is surprising because the model proteins used in those and similar studies are wild-type proteins capable of folding. The positively charged PL-tag would not be considered as an epitope that attracts chaperones either. An elegant explanation was offered with the discovery that the CAT-tail, added on stalled polypeptides by Rqc2 while still on ribosomes, is required for PL-tagged protein aggregation.14 However, formally, the interaction of alanine–threonine peptides with the chaperones has not been investigated yet.
The high frequency and potential toxicity of PL species motivated us to identify the PL-processing machinery in human cells. Unexpectedly, our analysis revealed that a considerable part of proteostasis network is dedicated to and assembles around the hydrophilic lysine stretches. Analysis of PL interactors suggests novel pathways used by the human protein quality control.
Experimental Section
Reagents, Plasmids, and Antibodies
Proteasome inhibitor MG132 was purchased from Enzo (Farmingdale, NY), and iodixanol solution Visipaque was from GE Healthcare (Chicago, IL). Other chemicals were from Sigma-Aldrich (Saint Louis, MO) if not indicated otherwise. Poly-L-lysine and poly-D-lysine were mixtures of polymers from 1 to 5 kDa (Sigma P0879 and P0296, respectively). Stock solutions (100 mM) of the polymers in 50 mM Tris–HCl (pH 7.5) and 500 mM NaCl were kept at −80 °C.
For mammalian expression of wild-type (WT) NQO1, 3xFLAG-NQO1 expression construct was used.17 Site-directed mutagenesis was used to clone the read-through (“no stop”) variants NS1, NS2, and NS3.18 Mutations were verified by sequencing.
The antibody against FLAG-tag was from Sigma. The antibody against the TCP-1 ring complexes (TRiC) subunit CCT5 (A303–480A) was from Bethyl Laboratories (Montgomery, TX). Antibodies against proteasome subunit PSMC5 (13392), lamin B1 (D9 V6H), histone 2B (D2H6), and GAPDH (14C10) were from Cell Signaling (Danvers, MA).
Analysis of Substrate Degradation by the 20S Proteasome
N-Succinyl-LLVY-AMC (100 μM; 7-amino-4-methylcoumarin) from Enzo was incubated with 2 nM 20S proteasome (Boston Biochem, Cambridge, MA) in 50 mM Tris–HCl (pH 7.4) and 1 mM DTT at 37 °C for 60 min, and the accumulation of the unquenched fluorescence at 380/440 nm (Ex/Em) was measured using a TECAN Infinite M200 plate reader.
Additionally, the degradation of 2.5 μM α-synuclein (A53T mutant) by 100 nM 20S proteasome upon incubation at 37 °C for 60 min was analyzed by sodium dodecyl sulfate polyacrylamide gel electrophoresis (SDS-PAGE) and Coomassie staining. Recombinant α-synuclein was purified following the osmotic shock protocol.19
Protein Stability Analysis
A total of 8 ×10⁶ 293T cells were mixed with 30 μg of plasmid DNA (20 μg of NQO1 WT or no-stop variants NS1, NS2, and NS3 and 10 μg of pcDNA3.1 plasmid) in 400 μL of cold intracellular buffer and electroporated at 950 μF/240 V. Cells were washed with 10 mL of Dulbecco’s modified Eagle medium (DMEM), resuspended in 2 mL of DMEM, and split equally for seeding in 10 cm tissue culture dishes. After 6 h, medium was exchanged to either containing dimethyl sulfoxide (DMSO; vehicle control) or 1 μM MG132 for overnight incubation. The next day, cells were collected by washing with cold phosphate-buffered saline (PBS) twice and then pelletted at 21.380 g for 20 s. Cells were lysed in CHIP lysis buffer (20 mM 4-(2-hydroxyethyl)-1-piperazineethanesulfonic acid [HEPES] KOH pH 7.4, 100 mM KCl, 10 mM MgCl2, 10% (w/v) glycerol, 0.5% (v/v) IGEPAL, phenylmethane sulfonyl fluoride [PMSF], and 1× protease inhibitor cocktail from Sigma), sonicated for 1 s at 52% output with MS72 sonotrode from Bandelin (Germany) and then incubated on ice for an additional 15 min. An equal volume of 2× SDS-PAGE sample buffer was added to each sample and boiled for 5 min. Samples were separated on 10% SDS-PAGE gels at 100 V and transferred on a nitrocellulose membrane (Protran, GE Healthcare) at 120 V for 90 min in a transfer tank containing transfer buffer (25 mM Tris, 192 mM glycine, and 20% methanol). Membranes were stained in Ponceau S solution to control the quality of the transfer and then blocked for 1 h with 5% milk solution for anti-FLAG antibody or 5% milk, 0.1% Tween-20 for anti-Lamin B1 antibody or 5% BSA, and 0.1% Tween-20 for anti-GAPDH antibody. Membranes were incubated with primary antibodies overnight. Next day, membranes were washed with Tris-buffered saline (TBS) 3 times (5 min per wash) and incubated with horseradish peroxidase-conjugated secondary antibodies (anti-mouse from Sigma, A9044 and anti-rabbit from Cell Signaling, 7074,) for 1 h. Membranes were washed with TBS/0.1% Tween-20 3 times (5 min per wash) and developed using Supersignal-Westpico Plus solution from Thermo Fisher Scientific. Chemiluminescence images were acquired with the ChemiDoc MP imaging system (Bio-Rad Laboratories).
Solubility Analysis
Cell transfection and lysis were as described above for protein stability analysis. Lysates were normalized; 1 μL of benzonase from Merck Milipore was added to 100 μg lysate (100 μL) for 30 min at RT. A total of 20 μL of nucleic acid-hydrolyzed lysate was mixed with 2× SDS-PAGE sample buffer and boiled for 5 min (“total lysate”). Remaining lysates (∼80ul) were centrifuged at 720g (low speed) at 4 °C for 5 min, and the supernatant was removed and further centrifuged at 15000g (high speed) for 5 min. Pellets from low-speed and high-speed centrifugations were resuspended in 20 μL CHIP lysis buffer, 20 μL of 2× SDS-PAGE sample buffer was added, and samples were boiled for 5 min. An equal volume of 2× SDS-PAGE sample buffer was added to supernatants, and the samples were boiled for 5 min. SDS-PAGE and Western blotting were performed as detailed above for protein stability analysis.
Nuclear Localization Analysis
To analyze the nuclear localization of PL-tagged NQO1, the lysis gradient protocol was used.20 A total of 8 × 10⁶ 293T cells were electroporated with protein expression plasmids as described above. The next day, cells were washed with cold PBS twice and scraped into 700 μL of 10% FBS–DMEM. A total of three-fourths of the cell suspension was loaded onto the iodixanol lysis gradient containing 0.5% NP-40 and 0.5% n-dodecyl-β-d-maltoside (DDM) in a 14 mL tube and centrifuged at 1000g for 10 min. Isolated nuclei from the lower interface were washed in 600 μL of nuclei isolation buffer (0.25 M sucrose, 10 mM Tris HCl at pH 7.4, 25 mM KCl, 5 mM MgCl2, PMSF, and protease inhibitor cocktail) and pelleted at 1000g for 10 min at 4 °C twice. Washed nuclei were resuspended in 50 μL of CHIP lysis buffer, sonicated for 10 s at 52% output with a MS72 sonotrode, and incubated on ice for 15 min. The rest of the cell suspension was pelleted at 21380g for 20 s, sonicated for 1 s in 50 μL of lysis buffer, and incubated on ice for additional 15 min. An equal volume of 2× SDS-PAGE sample buffer was added to samples, and the samples were boiled for 5 min. SDS-PAGE and Western blotting were performed as detailed above.
To analyze the solubility of NS3 in nuclei, NS3-transfected 293T cells were incubated overnight with 1 μM MG132 and the nuclei isolated as described above. The nuclei were incubated in a modified radio-immunoprecipitation assay (RIPA) buffer (10 mM Tris, 140 mM NaCl, 1 mM EDTA, 0.5 mM EGTA, 0.1% SDS, 0.1% sodium deoxycholate, and 1% Triton X-100) for 15 min on ice and centrifuged at 10000g for 5 min. Supernatants and pellets were analyzed by Western blotting with anti-FLAG and anti-Histone 2B antibodies.
Poly-L-lysine Agarose Pulldowns for Proteomics analysis
293T cells were trypsinized, washed with cold PBS, and then pelleted at 21380g for 20 s. Pellet was resuspended in 1.5 volumes of hypotonic buffer (10 mM HEPES KOH pH 7.6, 10 mM K acetate, 1.5 mM Mg acetate, and 2 mM DTT) and left to swell on ice for at least 10 min. Lysates were prepared by passing the cell suspension through a 20 G needle 20 times and then centrifuged at 640g for 5 min. 1 M K acetate was added to the cleared lysate to a final 100 mM concentration. Samples were additionally centrifuged for 10400g for 20 min at 4 °C before the protein concentration was measured. A total of 500 μg of lysate was treated with the nuclease Bezonase (1 μL of nuclease per 100 μL of lysate in the presence of 5 mM MgCl2) at RT for 10 min. Meantime, 100 μL of 50% poly-L-lysine agarose from Sigma (P6983) was pre-equilibrated in pulldown solution (50 mM Tris–HCl at pH 7.5 and 500 mM NaCl). The same volume of poly-D-lysine solution in pulldown solution was added to the lysate for 10 mM poly-D-lysine and 200 μL of volume. Beads were drained, mixed with the lysate, and incubated on a roller for 4 h at 4 °C. Beads were washed with pulldown solution twice and eluted with 50 μL of 10 mM poly-L-lysine for 10 min twice. Eluates were pooled and stored at −80 °C.
Mass Spectrometry of Polylysine Preparations
Poly-L-lysine and poly-D-lysine were dissolved at a concentration of 10 mg/mL with MS-grade water. The MS measurements were performed with the samples diluted to 100 ng/μL in 50% acetonitrile and 0.5% formic acid. Electrospray ionization (ESI)-MS analyses were conducted on a Q Exactive Plus mass spectrometer equipped with an Ion Max source and an H-ESI II probe (all from Thermo Fisher Scientific). Samples were directly infused into the ESI source at a flow rate of 5 μL/min by a microsyringe pump (Fusion 100, Chemyx). The ESI source conditions were as follows: transfer capillary temperature of 275 °C, sheath gas flow of 5 arbitrary units, auxiliary gas flow of 3 arbitrary units, spray voltage of 3.5 kV, and an S-lens RF level of 65. The sample signal was acquired for 5 min from 133 to 2.000 m/z, with a resolution of 70 000, an ACG target of 106, and a maximum injection time of 100 ms.
Sample Preparation for Proteomics Analysis
Pulldown eluates (100 μL) from 500 μg of total lysates were reduced with 0.1 M DTT for 5 min at 95 °C, followed by a 4× dilution with 8 M urea and 50 mM Tris–HCl at pH 8.5 and loaded onto spin filters with a 30 kDa cutoff (Microcon, Merck). The filter-aided sample preparation protocol (FASP) was followed.21 Proteins were digested at 37 °C overnight with trypsin (sequencing grade, Promega). Peptides were eluted from the filters with 50 mM ammonium bicarbonate buffer and acidified with 0.1% trifluoroacetic acid final concentration. Eluted peptides were desalted and fractionated (three fractions) on combined C18/strong cation exchange StageTips. Peptides were dried in a SpeedVac and resolved in 12 μL of 1% acetonitrile and 0.1% formic acid.
A total of 100 μg of lysate preparation was adjusted to a volume of 50 μL with hypoosmotic lysis buffer and to 10% SDS and 0.1 M DTT concentration and incubated for 5 min at 95 °C. The lysates were then mixed with 200 μL of 8 M urea and 50 mM Tris–HCl at pH 8.5, followed by protein digestion with trypsin according to the FASP protocol as described above. According to the described procedure,22 acidified peptides (0.1% trifluoroacetic acid final concentration) were desalted with C18 StageTips and fractionated with strong cation exchange (SCX) StageTips. The C18 trans-elution fraction was combined with the first of 6 SCX fractions. Peptides were dried and resolved in 12 μL of 1% acetonitrile and 0.1% formic acid.
Liquid Chromatography–Tandem Mass Spectrometry
Liquid chromatography–tandem mass spectrometry (MS/MS) was performed on a Q Exactive Plus equipped with an ultrahigh-pressure liquid chromatography unit Easy-nLC1000 and a Nanospray Flex ion source (all three from Thermo Fisher Scientific). Peptides were separated on an in-house-packed column (100 μm inner diameter, 30 cm length, 2.4 μm Reprosil-Pur C18 resin from Dr. Maisch GmbH, Germany) using a gradient from mobile phase A (4% acetonitrile and 0.1% formic acid) to 30% mobile phase B (80% acetonitrile and 0.1% formic acid) for 60 min followed by a second step to 60% B for 30 min, with a flow rate of 300 nL/min. MS data were recorded in data-dependent mode by selecting the 10 most abundant precursor ions for HCD with a normalized collision energy of 27. The full MS scan range was set from 350 to 2000 m/z with a resolution of 70 000. Ions with a charge of ≥2 were selected for a tandem MS scan with a resolution of 17 500 and an isolation window of 2 m/z. The maximum ion injection time for the survey scan and the MS/MS scans was 80 ms, and the ion target values were set to 3 × 10⁶ and 1 × 10⁵, respectively. Dynamic exclusion of selected ions was set to 60 s. Data were acquired using Xcalibur software (Thermo Fisher Scientific).
Data Analysis
MS raw files from five biological replicates of cell lysates and respective pulldowns were analyzed with Max Quant23 (version 1.5.3.30) using default parameters. Enzyme specificity was set to trypsin, defined as the C-terminal to arginine and lysine including proline, and a maximum of 2 missed cleavages were allowed. A minimal peptide length of six amino acids was required. Carbamidomethylcysteine was set as a fixed modification, while N-terminal acetylation and methionine oxidation were set as variable modifications. The spectra were searched against the UniProtKB human FASTA database (downloaded in November 2015; 70 075 entries) for protein identification with a false discovery rate of 1%. Unidentified features were matched between runs in a time window of 2 min. In the case of identified peptides that were shared between two or more proteins, these were combined and reported in protein group. Hits in three categories (false positives, only identified by site, and known contaminants) were excluded from further analysis. For label-free quantification (LFQ), the minimum ratio count was set to 1. Absolute protein abundances were estimated by iBAQ calculation.24
Bioinformatic data analysis was performed using Perseus25 (version 1.5.2.6). The proteins with at least five valid values in at least one group (lysate/pulldown) were considered quantified. For PL interactor selection, the pulldown-to-lysate LFQ ratios were used. First, the LFQ values of the lysate proteins were multiplied by five to take into account that one-fifth of the protein amount was used to prepare the lysate compared to the pulldown samples. The ratios were calculated from the average LFQs of the five pulldown and lysate samples, and a threshold of minimum enrichment to be included in the interactors group was set at the mean +1 standard deviation (SD) of the ratio distribution.
Physico-chemical Properties
The isoelectric point (pI) was calculated using the Compute pI/MW tool on the ExPASy Web site (www.expasy.org). Molecular weight values were extracted from the “proteingroup” table of the MaxQuant outcome. Hydrophobicity and disorder propensity were analyzed with the box-plotter function of cleverSuite26 using Kyte and Doolittle27 and TOP-IDB28 scales, respectively. Aggregation propensity was predicted on the same platform with Zyggregator29 and TANGO30 algorithms. PL interactors (309 proteins) were compared to the group of all identified proteins from the pulldown and input samples (7288 proteins). Statistical significance was assessed by Mann–Whitney test.
Protein Class Analysis
Protein class enrichment analysis was performed online with PANTHER31 (version 12.0) using the “over-representation test” tool and selecting “protein class” as the annotation data set. As the input, gene names of PL interactors and of the human protein coding genome (Perseus 1.5.2.6, 20 504 entries) were used. The P-value cutoff was set to 0.01.
KEGG Pathway Analysis
The identified proteins were assigned to KEGG pathways with Perseus. A Fisher’s exact test was performed for the enrichment in the set of PL interactors using a Benjamini–Hochberg correction with cutoff of 0.1%.
Network Analysis
Network analysis was done online with STRING32 with the following settings: network edges represent confidence, text-mining was excluded from the interaction sources, confidence was set to high (score 0.7), and hide disconnected nodes was enabled. Uniprot protein IDs were used as input, and ribosomal proteins were excluded from the analysis.
Stoichiometry Analysis of Oligomeric Complexes
Protein complex subunit stoichiometry was determined as described.33 In particular, for each TRiC and proteasome subunit in the input and interactors group, the absolute abundance was estimated by iBAQ calculation. The average iBAQ of single subunits across biological replicates was then used to calculate the ratio of the subunit iBAQ over the mean of the iBAQs for all the subunit of the complex or subcomplex, corresponding to the deviation from the expected 1:1 stoichiometry.
Statistical Analysis
All repetitions in this study were independent biological repetitions performed at least three times if not specified differently. A two-tailed t test was performed to determine the significance of the toxicity differences. Fisher exact tests with a p-value threshold of 0.001 were run for KEGG pathway and Panther protein class term enrichment analysis. Statistical significance for not normally distributed parameters (pI, MW, disorder and aggregation propensity, stoichiometry) was assessed by Mann–Whitney test.
Results
Identificaton of Polylysine Interactors
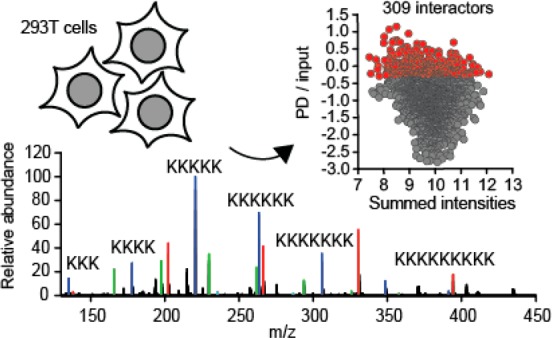
Highly concentrated 293T lysates were prepared and incubated with poly-L-lysine agarose for 4 h. To increase specificity, the trivial electrostatic binding due to positive charges of lysines was blocked by including 10 mM poly-D-lysine (Figure S-1) during incubation. To determine the length distribution of the polylysine mixture, the peptide solution was analyzed by ESI-MS. Oligopeptide chains from 2 to 12 lysine residues were detected, with a charge state ranging from 2 to 5 and with the m/z distribution centered at the 5-mer and 7-mer species for the 3+ and 4+ ions, respectively (Figure S-1). As an additional means of increasing specificity, we used poly-L-lysine (Figure 1A) to elute poly-L-lysine-agarose-bound proteins. In parallel, proteins in input lysates were identified and quantified. A total of five independent biological repetitions were performed (Table S-1). The repeatability between individual experiments was very high, as evidenced by the strong correlation of LFQ intensities (Figure S-2). Between 2459 and 2795 proteins were quantified in individual pulldowns, and between 6418 and 6669 proteins were quantified in individual lysate analyses. To rank the pulldown proteins, their fractional enrichment (i.e., fraction to the experimentally determined abundance in lysate) was calculated (Figure 1B). The top 309 proteins were defined as the interactors of the PL and analyzed further (Table S-2). This set encompasses proteins with the fractional enrichment falling above the mean and 1 SD on the distribution scale. Interestingly, a slight bias toward lower abundance proteins among the PL interactors could be uncovered (Figure 1C).
Figure 1.

Label-free quantitative MS identification of a set of human proteins that associate with PL. (A) Length distribution of the poly-L-lysine peptide mix used to elute proteins interacting with poly-L-lysine agarose, as determined by mass spectrometry. (B) Distribution of the identified PL interactors according to their enrichment during the PL-agarose pulldown (PD) from the cytosolic extracts of 293T cells. A total of five independent biological experiments. (C) Distribution of the identified interactors plotted against their abundance in cytosol (summed intensities). The subset of the 309 highest-enriched proteins (mean plus 1 standard deviation) is labeled red and is considered as the interactome of PL in this study.
Structural Features of Polylysine Interactors
Analysis of the physico-chemical properties was performed by comparing the PL interactor set with all identified proteins. There were no significant difference between the distributions of isoelectric points between the groups (Figure 2A). However, molecular weight distribution among PL interactors plotted into 10 kDa-sized bins indicated an enrichment of smaller, ca. 15–35 kDa, proteins and a depletion of larger proteins (Figure 2B). The difference appeared very clear in a box plot (Figure 2C). Similarly, the hydrophobicity analysis using the Kyte–Doolittle scale27 indicated significantly higher hydrophobicity of PL interactors compared to the control set (Figure 2D). Complementary, one would expect less disorder in the presence of increased hydrophobicity. Indeed, this was found when the disorder prediction algorithm TOP-IDB28 was applied to analyze the PL interactors (Figure 2E). Finally, differences were detected also regarding the aggregation potential. Two aggregation prediction algorithms were used. The statistical mechanics-based TANGO algorithm30 assesses secondary structure formation probability, while the Zyggregator29 is a sequence-based method of predicting aggregation propensity. Both methods identified a slight yet highly significant difference between the control set and the set of PL interactors (Figure S-3).
Figure 2.
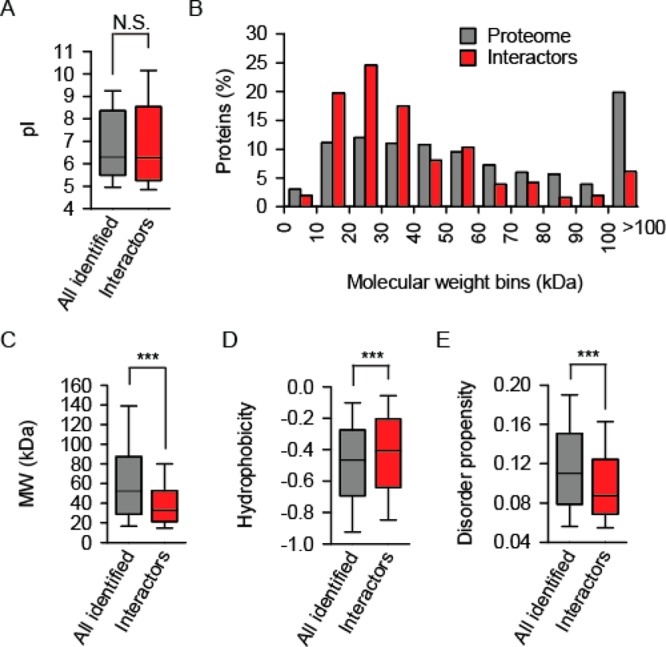
PL interactor characterization by a distinct set of physico-chemical features. The statistical significance of the difference between the distribution of the respective features of all identified proteins (gray) and of the interactors (red) was estimated using Mann–Whitney test; N.S., not significant; triple asterisks indicate p < 0.001. (A) Box plot of the isoelectric point (pI) distribution. (B) Bin diagram of the molecular weight (MW) distribution. (C) Box plot of the molecular weight distribution. (D) Box plot of the Kyte–Doolittle hydrophobicity distribution. (E) Box plot of the disorder propensity distribution.
Proteins from Proteostasis Network are Enriched among Polylysine Interactors
Next, the functional analysis of the PL interactors provided clues regarding the cellular pathways involved in PL processing. We used the PANTHER bioinformatics platform31 to identify the over-represented cellular activities in the set of 309 proteins. Several functional classes turned out to be enriched (Figure 3A). Cage-forming chaperonins were the top group with a 69-fold enrichment compared to the proteome at p = 1.34 × 10⁻¹⁰. Cytosolic chaperonin in eukaryotes is called TRiC and is a stoichiometric complex composed of two rings of eight different subunits. We identified and quantified all but one subunit of TRiC in the PL pulldowns. To corroborate the biological relevance, we revisited the MS data to determine the intactness of the TRiC in the pulldowns. To this end, we quantified the abundance of the individual subunits (subunit iBAQ) and normalized each of them by the mean iBAQ of all subunits.33 The analysis revealed that PL interacted with the intact TRiC (Figure 3B). The stoichiometric distribution of TRiC subunits in the input lysate was much broader, which probably reflects the ongoing assembly or the turnover of the complex. The interaction of PL with TRiC was verified by means of Western blotting (Figure 3C).
Figure 3.

Protein function analysis of the PL interactors identifies a strong enrichment of the members from the proteostasis network. (A) Significant hits (p < 0.01) of the PANTHER over-representation test sorted according to the enrichment factor, which is indicated in the brackets. (B) The box plot of the distribution of iBAQ values of individual subunits normalized by the mean iBAQ of all subunits of the chaperonin TRiC. (C) Biochemical verification of TRiC pulldown by poly-L-lysine agarose as performed for mass spectrometry analysis. An antibody against TRiC subunit CCT5 was used for Western blotting. The elution of agarose-bound proteins was done with 10 mM poly-L-lysine or poly-D-lysine. (D) The STRING connectivity analysis identifies two clusters of the members from the proteostasis network (molecular chaperones and the proteasome). Ribosomal proteins and unconnected nodes were excluded to improve visualization.
Recently, an interactome analysis of a ribosome-extracted PL-tagged model protein was performed.34 We analyzed the interactors discovered in that study by PANTHER and found a very strong enrichment of the chaperonin class as well (Figure S-4). Actually, several classes overlap when the interactomes of our study (human lysate with poly-L-lysine-agarose as bait) and the published study34 (yeast with over-expressed polylysine-tagged protein as bait) are compared (marked red, Figure S-4). In addition to chaperonin, the related protein class “chaperone” was highly enriched in both cases. This points out to the strong involvement of the proteostasis network in processing of polylysines in organisms as different as humans and yeasts. The STRING connectivity analysis helps visualizing the distinct clusters in the network of the PL interactors (Figure 3D). In addition to the already mentioned chaperonins, HSP90 and HSP70 family members are numerously represented in the cluster of molecular chaperones (Table 1). In support to the functional interaction of the chaperones with PL, a number of co-factors (co-chaperons) are among the interactors, such as chaperonin-assisting prefoldins or HSP70- and HSP90-interacting ST13.
Table 1. Molecular Chaperones Found in the PL Interactomea.
| gene | protein | MW (kDa) | coverage (%) |
|---|---|---|---|
| chaperones | |||
| HSP90AA1 | heat-shock protein HSP 90-α | 84.7 | 65.8 |
| HSP90AB1 | heat-shock protein HSP 90-β | 83.3 | 69.2 |
| HSP90B1 | endoplasmin | 92.5 | 49.6 |
| HSPA1A/B | heat-shock 70 kDa protein 1A/B | 70.1 | 81 |
| HSPA2 | heat-shock-related 70 kDa protein 2 | 70 | 31.1 |
| HSPA4 | heat-shock 70 kDa protein 4 | 94.3 | 76.9 |
| HSPA6 | heat-shock 70 kDa protein 6 | 71 | 19.6 |
| HSPA8 | heat-shock cognate 71 kDa protein | 70.9 | 68.9 |
| chaperonins | |||
| TCP I | T-complex protein 1 subunit α | 60.3 | 74.8 |
| CCT2 | T-complex protein 1 subunit β | 57.5 | 73.1 |
| CCT4 | T-complex protein 1 subunit δ | 57.9 | 78.8 |
| CCT5 | T-complex protein 1 subunit ε | 59.7 | 76.2 |
| CCT6A | T-complex protein 1 subunit ζ | 58 | 60.6 |
| CCT7 | T-complex protein 1 subunit η | 59.4 | 79 |
| CCT8 | T-complex protein 1 subunit τ | 59.6 | 78.6 |
| HSPD1 | 60 kDa heat-shock protein, mitochondrial | 61.1 | 62.3 |
| HSPE1 | 10 kDa heat-shock protein, mitochondrial | 10.9 | 86.3 |
| co-chaperones | |||
| BAG5 | BAG family regulator 5 | 51.2 | 15 |
| DNAJC2 | DnaJ homologue subfamily C member 2 | 72 | 52.5 |
| NACA | nascent polypeptide-associated complex subunit a | 15 | 60.3 |
| BTF3 | nascent polypeptide-associated complex subunit b | 22.2 | 49 |
| PFDNI | prefoldin subunit 1 | 14.2 | 54.1 |
| PFDN6 | prefoldin subunit 6 | 14.6 | 74.4 |
| STI3 | Hsc70-interacting protein | 41.3 | 41.2 |
Molecular chaperones are grouped in three subclasses: HSP90 and HSP70 (chaperones), HSP60 (chaperonins), and the co-chaperones. MW, molecular weight.
26S Proteasome Interactions with Polylysine
Proteasome represents another cluster related to the proteostasis (Figure 3D and Table 2). It was ranked very high by the KEGG pathway enrichment analysis: 25-fold enrichment with p = 8.62 × 10⁻¹⁹ (Figure 4A). Proteasome is enriched among the PL-tagged protein interactors in yeast34 as well, being actually the highest enriched pathway there (Figure S-5). Similar to the TRiC analysis, we revisited the MS data to determine the intactness of the proteasome in the pulldowns. The abundances of the individual subunits of the 20S catalytic particle and 19S regulatory particle were determined (subunit iBAQ) and normalized by the mean iBAQ of 20S or 19S, respectively. Again, we found that PL interacted with the intact 20S and 19S particles (Figure 4B). The stoichiometric distribution of the proteasome subunits in the input lysate was broader, reminiscent of the result of the TRiC analysis.
Table 2. 26S Proteasome Subunits Identified in PL Interactomea.
| gene | MW (kDa) | coverage (%) | average ± SD (log 10) |
|---|---|---|---|
| core particle 20S | |||
| PSMA1 | 29.6 | 65.8 | 7.80 ± 0.45 |
| PSMA4 | 29.5 | 52.9 | 7.94 ± 0.39 |
| PSMA6 | 28.1 | 63.9 | 7.95 ± 0.44 |
| PSMA7 | 27.9 | 66.5 | 7.98 ± 0.36 |
| PSMB1 | 26.5 | 50.6 | 8.04 ± 0.43 |
| PSMB2 | 22.8 | 43.8 | 7.89 ± 0.36 |
| PSMB3 | 22.9 | 49.3 | 7.76 ± 0.41 |
| PSMB5 | 28.5 | 58.6 | 7.99 ± 0.49 |
| PSMB6 | 25.4 | 42.3 | 7.84 ± 0.36 |
| regulatory particle 19S | |||
| PSMC2 | 48.6 | 76 | 7.57 ± 0.39 |
| PSMC5 | 45.6 | 67.2 | 7.59 ± 0.43 |
| PSMC6 | 45.8 | 66.3 | 7.45 ± 0.42 |
| PSMD2 | 100.2 | 45.8 | 7.47 ± 0.41 |
| PSMD11 | 47.5 | 66.1 | 7.58 ± 0 37 |
| PSMD14 | 34.6 | 36.1 | 7.10 ± 0.37 |
MW, molecular weight; AVG ± SD, average iBAQ values with standard deviation (N = 5).
Figure 4.

Half-capped proteasome association with PL. (A) KEGG analysis identifies proteasome among the top 4 biochemical pathways in the eukaryotic cells (p = 8.62 × 10⁻¹⁹). (B) The box plot of the distribution of iBAQ values of individual subunits of catalytic (20S) and regulatory (19S) particles normalized by the mean iBAQ of all subunits of the respective particle. (C) As in panel B but with both 20S and 19S normalized to the mean iBAQ of 20S particle. The significance of the difference (double asterisks indicate p > 0.01) was estimated using a Mann–Whitney test. (D) As in panel C, but LFQ intensities were used instead of iBAQ values. Additionally, mean LFQ values of 20S and 19S are indicated to stress the half-stoichiometric abundance of the regulatory particle. (E) Biochemical verification of proteasome pulldown by poly-L-lysine agarose as performed for mass spectrometry analysis. An antibody against proteasome subunit PSMC5 was used for Western blotting. The elution of agarose-bound proteins was done with 10 mM poly-L-lysine or poly-D-lysine.
The 20S catalytic particle can be capped with the 19S regulatory particle on one or both ends (19S-20S-19S or 19S-20S). To determine the symmetry of the 19S association in the PL-interacting proteasome, we modified the abundance analysis. This time iBAQs of all subunits were normalized to the mean of the 20S particle. Interestingly, a distinctly substoichiometric distribution of 19S subunit abundances was revealed (Figure 4C). The results strongly implied that only the singly capped 19S-20S proteasome associates with PL. A similar conclusion was reached by using an alternative abundance measure, the LFQ intensity (Figure 4D). The interaction between PL and proteasome was verified by means of Western blotting (Figure 4E).
A pair of functional assays were used to test the effect of PL on the 20S proteasome function. PL inhibited cleavage of the reporter peptide LLVY-AMC by proteasome (Figure 5A). Similarly, an inhibitory effect of polylysine was observed when the degradation of a bigger substrate, the disordered protein α-synuclein, was analyzed (Figure 5B).
Figure 5.
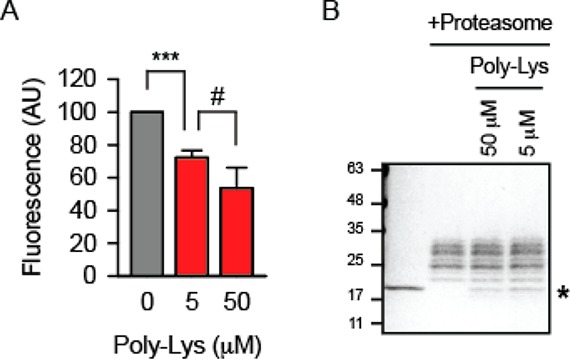
Polylysine effect on the degradation of substrates by the 20S proteasome. (A) Unquenched fluorescence was measured after the incubation of LLVY-AMC with the 20S proteasome for 60 min. The signal in the absence of polylysine (Poly-Lys) was set as 100. Triple asterisks indicate p < 0.001. A two-sided t-test analysis was performed. N = 3 independent experiments, and a pound sign indicates an insignificant difference. (B) Degradation of α-synuclein by the 20S proteasome after 60 min of incubation was analyzed by SDS-PAGE and Coomassie staining. A single asterisk indicates α-synuclein; all other bands above it are subunits of the proteasome. A single representative experiment out of three is shown.
Polylysine-Tagged NQO1 Aggregation in Mammalian Cells
Over-expression of stop codon-deleted open reading frames represents an experimental alternative to the use of chemically synthesized PL. To obtain this additional tool, we constructed a series of deletions in the plasmid encoding the flavoprotein NAD(P)H:quinone oxireductase (NQO)1 and labeled them no-stop (NS)1, NS2, and NS3 (Figure 6A). NS1 and NS2 became extended by 20 and 57 additional amino acids, respectively. To keep the polyadenylation signal intact, we introduced a frame-shift during construction of the NS3. The newly created amino acid sequence is colored red in Figure 6A. A total of three amino acids are shown in brackets because there are two possible sites of the poly adenine tail addition. Only dedicated experiments will clarify which site is used by the polyadenylation machinery.
Figure 6.

Mutations of stop codons in the NAD(P)H:quinone oxireductase (NQO1)-encoding expression construct creates the model PL-tagged protein NS3. (A) C-terminal amino acid sequence of the wild type NQO1 (WT) and its read-through versions upon mutations of stop codons (no stop, NS). Amino acids replacing the stop codons are underlined. To create the NS3 version, the last stop codon was eliminated by a frame-shifting mutation; the newly generated sequence is labeled in red. HRI sequence is shown in brackets because it is not clear at this stage whether HRI is synthesized or omitted before the polylysine stretch (KKKKKK...). (B) Stability analysis of the wild-type and read-through proteins upon transient expression in 293T cells. Steady-state levels of the proteins were determined by Western blotting. Proteasomal degradation was inhibited with MG132 where indicated. GAPDH was used as loading control. A single representative out of three independent experiments is shown. (C) Solubility analysis of the wild-type and read-through variants by consecutive low-speed and high-speed pelleting of the cellular lysates. T, total lysate; Pl and Ph, pellet upon low-speed and high-speed centrifugation, respectively; S, supernatant upon high-speed centrifugation. A single representative out of three independent experiments is shown.
First, an efficient clearance of NS3 was demonstrated by transient transfections of WT protein and its NS variants into 293T cells (Figure 6B). The degradation of NS3 was likely driven by the PL tail because the very similar NS2 variant was as stable as the WT protein. Not considering the PL part, the two proteins differ minimally by a 7–10 amino acid long stretch that is not particularly hypdrophobic to be implicated in the aggregation or interaction with molecular chaperones. Over-expressed NS3 could be pelleted during lysate centrifugation (Figure 6C). In addition, a combination of proteasomal inhibition, the overloading of samples during SDS-PAGE, and the over-exposure of the chemiluminescence signal during Western blotting revealed a partial SDS insolubility of NS3 (Figure S-6). Thus, NS3 shows aggregation behavior similar to other PL-tagged model substrates.14,15,34
Polylysine-Tagged NQO1 Transport into the Nucleus
It was unexpected that the low-speed centrifugation at 720g pelleted a big fraction of NS3 (Figure 6C). To explain this result, we considered the possibility that NS3 becomes sequestered in cellular organelles pelletable at 720g, such as nuclei. Classical nuclear targeting sequences (NLS) are known to be patches of positively charged amino acids similar to PL.35 NLS of a substrate polypeptide associates with the heterodimer protein importin. Importin then mediates interaction of the complex with the nuclear pore leading to the translocation of the substrate into the nucleus. Indeed, PL interacted with both importin subunits α1 (gene KPNA2) and β1 (gene KPNB1) according to the MS analysis (Table S-2). A total of 25 and 32 peptides covered 42% and 41% of importin α1 and importin β1 sequences, respectively, resulting in a high score (the top third of the score distribution). To verify nuclear import of NS3 biochemically, we performed cellular fractionation by means of the lysis gradient method.20 The experiment revealed efficient translocation of PL-tagged NS3 into the nucleus compared to that of the very similar protein without the PL tag (NS2) (Figure 7A). Next, the strongly solubilizing RIPA buffer was used to permeabilize the isolated nuclei, yet only a fraction of NS3 could be released into the supernatant (Figure 7B). The result indicates that a part of polylysine-tagged proteins associate strongly with DNA, similar to the histones (Figure 7B). Alternatively, polylysine-tagged proteins might form detergent-insoluble aggregates in nuclei.
Figure 7.

PL-tagged protein transport into the nucleus efficiently. (A) Wild-type and read-through versions of NQO1 were transfected into 293T, and their localization in the nucleus (Nucl) was analyzed as detailed in the Experimental section. Proteasome was inhibited using MG132 where indicated. Anti-FLAG antibody was used to detect NQO1. FLAG* indicates an over-exposed blot. GAPDH and lamin B1 were used as a loading control for total lysate and nucleus, respectively. (B) Isolated nuclei were incubated in a RIPA buffer without (−Det) or with detergents 1% Triton X-100, 0.1% deoxycholate and 0.1% SDS (+Det) on ice for 15 min and then centrifuged at 10000g for 5 min. Supernatant and pellet were analyzed by Western blotting with anti-FLAG or anti-Histone 2B antibodies. A single representative out of four experiments is shown.
Discussion
Polylysine represents a positively charged amino acid sequence that poses an experimental challenge to controlling nonspecific electrostatic interactions. We prevented this potential problem by including a high concentration of poly-D-lysine during incubation. Most biochemical processes in human cells have evolved to use only the levorotatory enantiomers of amino acids. Thus, poly-D-lysine as a competitor during pulldown not only reduced background binding due to the electrostatic interactions but also must have supported the stereospecificity. To reduce the amount of background binders, we eluted poly-L-lysine agarose interactors using soluble poly-L-lysine peptides.
The analysis of the identified interactome reassured the validity of our experimental setup. The unbiased distribution of isoelectric points indicates that the electrostatics did not dominate the association of the lysate proteins that were identified as specific PL interactors. Second, the lower molecular weight of the interactome argues against artificial enrichment due to aggregation on beads. Smaller proteins are usually more stable due to kinetic reasons. Third, at least two macromolecular complexes, chaperonin TRiC and 26S proteasome, were found to be present in the stoichiometric composition. TRiC is composed of two rings of eight different subunits.36 For the stoichiometry determination, we were able to identify and quantify all but one subunit in the pulldowns. Proteasome is more complex: the 20S catalytic particle is composed of 4 stacked heptameric rings of different α and β subunits, and the 19S regulatory particle is composed of at least 19 different proteins.37 We could quantify 9 proteins from the 20S particle and 6 proteins from the 19S particles. Although less exhaustive than TRiC coverage, the abundance analysis of proteasome subunits again indicated stoichiometric composition of the pulldown complex. Interestingly, the distribution of TRiC and proteasome subunits in lysate turned out to be broader and might reflect the ongoing assembly or the turnover of the complexes. Finally, several chaperones were detected together with their co-chaperones, such as TRiC with Prefoldin or HSP70 and HSP90 with ST13, which indicates functional relationships among interactors.
We were surprised to find so many molecular chaperones in the PL interactome. PL is positively charged at physiological pH. Actually, lysine is the second most hydrophilic amino acid according to the classical Kyte–Doolittle scale.27 Discrepantly, chaperones are known to bind to hydrophobic stretches of polypeptides.38 One possible explanation is that secondary structure elements formed by PL are responsible for its interactions with chaperones. It has been known for a long time that PL, especially when uncharged, undergoes conformational transitions between α-helices, random coils, and β-structures.7 An abundance of β-structures might lead to amyloidogenesis and explain the recruitment of chaperones.39,40 As an interesting parallel, the polyglutamine mutants of huntingtin interact and are remodeled by TRiC.41−43 Glutamine is almost as hydrophilic as lysine and is its neighbor on the Kyte–Doolittle scale.
The described interactome is a resource for revealing novel principles of protein quality control in eukaryotic cells. An example is our discovery of the PL association with nuclear import machinery. Recently, the nucleus has been shown to be an important organelle in proteostasis.44 Several cytosolic proteins can be transported into nuclei for proteasomal degradation.45−47 Importantly, a PL-tagged GFP was shown to relocalize into the nucleus when the CAT tail addition was inactive in yeast.14 PL synthesized from the poly(A) tail of an mRNA is somewhat reminiscent of classical nuclear targeting sequences enriched in lysine and arginine;35 thus, PL interaction with importin complex could have been anticipated. The implication from the interactome analysis was supported by a functional assay (Figure 7A). The coding sequence lacking a stop codon immediately before the polyadenylation signal resulted in a polypeptide that was transported into the nucleus very efficiently. To our knowledge, the PL–importin interaction would be the first example of a compartmentalizing mechanism that is specific for a protein damage tag.
The interplay between polylysine and the CAT tail in defining the biology of translational read-throughs is an interesting question. The CAT tail was shown to drive the aggregation of polylysine-tagged proteins when the ribosome-associated quality control was defective in yeast models. There is no reason to doubt that the aggregation of NS3 is mediated by the CAT tail in human cells as well, especially because polylysine alone is a hydrophilic sequence. Furthermore, it is very likely that the nuclear translocation of NS3 depends on the polylysine tag as discussed above. Whether the sequestration of polylysine-tagged proteins in the nucleus has evolved for a specific purpose or represents a coincidence due to the physico-chemical similarity of polylysine to the nuclear localization signals is difficult to judge from the currently available data. Changes of polylysine-tagged protein turnover or toxicity upon inhibition of the nuclear import machinery might provide indications in favor of the former.
Another example of how the interactome can suggest novel PQC mechanisms is the analysis of the proteasome association with PL. The stoichiometry indicates the half-capped 19S-20S architecture of the PL-interacting complex. This is particularly intriguing given the capacity of 20S to degrade ubiquitin-free substrates if they are disordered.48 As discussed above, PL fluctuates between secondary structures and random coil. The disordered state of PL would make a PL-tagged faulty protein susceptible to ubiquitin-independent proteasomal hydrolysis.
Conclusions
Here, we uncovered that the PL tag of faulty polypeptides can drive their interactions with a number of proteins in mammalian cells. Remarkably, many components of the proteostasis network are found among PL interactors. This indicates that PL processing and disposal represents an important aspect of protein quality control. The described set of interactors offers a starting point toward uncovering the molecular mechanisms that allow mammalian cells to recognize and inactivate PL-tagged proteins when the ribosome-associated quality control is insufficient.
Acknowledgments
This study has been supported by the Cluster of Excellence “Macromolecular Complexes” grant no. EXC115 (W.-H.L. and R.M.V.) and the European Research Council grant no. 311522-MetaMeta (G.C. and R.M.V.).
Glossary
Abbreviations
- MS
mass spectrometry
- PL
polylysine
- RQC
ribosome-associated quality control
- TRiC
TCP-1 ring complex
Supporting Information Available
The Supporting Information is available free of charge on the ACS Publications website at DOI: 10.1021/acs.jproteome.8b00108.
Figures showing the length distribution of the poly-D-lysine peptide mix, LFQ protein intensities, PLL interactor aggregation, interactomes of the PLL-tagged model protein in yeast, proteasome enrichment, and PLL-tagged model proteins. (PDF)
A table showing MaxLFQ quantitative data and identifiers. (XLSX)
A table showing a list of PLL interactors and identifiers. (XLSX)
The authors declare no competing financial interest.
Notes
The mass spectrometry proteomics data have been deposited to the ProteomeXchange Consortium49 via the PRIDE partner repository with the data set identifier PXD008171.
Supplementary Material
References
- Mier P.; Alanis-Lobato G.; Andrade-Navarro M. A. Context Characterization of Amino Acid Homorepeats Using Evolution, Position, and Order. Proteins: Struct., Funct., Genet. 2017, 85 (4), 709–719. 10.1002/prot.25250. [DOI] [PubMed] [Google Scholar]
- Brandman O.; Hegde R. S. Ribosome-Associated Protein Quality Control. Nat. Struct. Mol. Biol. 2016, 23 (1), 7–15. 10.1038/nsmb.3147. [DOI] [PMC free article] [PubMed] [Google Scholar]
- Inada T. The Ribosome as a Platform for MRNA and Nascent Polypeptide Quality Control. Trends Biochem. Sci. 2017, 42 (1), 5–15. 10.1016/j.tibs.2016.09.005. [DOI] [PubMed] [Google Scholar]
- Joazeiro C. A. P. Ribosomal Stalling During Translation: Providing Substrates for Ribosome-Associated Protein Quality Control. Annu. Rev. Cell Dev. Biol. 2017, 33, 343–368. 10.1146/annurev-cellbio-111315-125249. [DOI] [PubMed] [Google Scholar]
- Arribere J. A.; Cenik E. S.; Jain N.; Hess G. T.; Lee C. H.; Bassik M. C.; Fire A. Z. Translation Readthrough Mitigation. Nature 2016, 534 (7609), 719–723. 10.1038/nature18308. [DOI] [PMC free article] [PubMed] [Google Scholar]
- Ozsolak F.; Kapranov P.; Foissac S.; Kim S. W.; Fishilevich E.; Monaghan A. P.; John B.; Milos P. M. Comprehensive Polyadenylation Site Maps in Yeast and Human Reveal Pervasive Alternative Polyadenylation. Cell 2010, 143 (6), 1018–1029. 10.1016/j.cell.2010.11.020. [DOI] [PMC free article] [PubMed] [Google Scholar]
- Davidson B.; Fasman G. D. The Conformational Transitions of Uncharged Poly-L-Lysine. Alpha Helix-Random Coil-Beta Structure. Biochemistry 1967, 6 (6), 1616–1629. 10.1021/bi00858a008. [DOI] [PubMed] [Google Scholar]
- Mirtič A.; Grdadolnik J. The Structure of Poly-L-Lysine in Different Solvents. Biophys. Chem. 2013, 175–176, 47–53. 10.1016/j.bpc.2013.02.004. [DOI] [PubMed] [Google Scholar]
- Lu J.; Deutsch C. Electrostatics in the Ribosomal Tunnel Modulate Chain Elongation Rates. J. Mol. Biol. 2008, 384 (1), 73–86. 10.1016/j.jmb.2008.08.089. [DOI] [PMC free article] [PubMed] [Google Scholar]
- Bengtson M. H.; Joazeiro C. A. P. Role of a Ribosome-Associated E3 Ubiquitin Ligase in Protein Quality Control. Nature 2010, 467 (7314), 470–473. 10.1038/nature09371. [DOI] [PMC free article] [PubMed] [Google Scholar]
- Defenouillère Q.; Yao Y.; Mouaikel J.; Namane A.; Galopier A.; Decourty L.; Doyen A.; Malabat C.; Saveanu C.; Jacquier A.; et al. Cdc48-Associated Complex Bound to 60S Particles Is Required for the Clearance of Aberrant Translation Products. Proc. Natl. Acad. Sci. U. S. A. 2013, 110 (13), 5046–5051. 10.1073/pnas.1221724110. [DOI] [PMC free article] [PubMed] [Google Scholar]
- Verma R.; Oania R. S.; Kolawa N. J.; Deshaies R. J. Cdc48/P97 Promotes Degradation of Aberrant Nascent Polypeptides Bound to the Ribosome. eLife 2013, 2, e00308. 10.7554/eLife.00308. [DOI] [PMC free article] [PubMed] [Google Scholar]
- Shen P. S.; Park J.; Qin Y.; Li X.; Parsawar K.; Larson M. H.; Cox J.; Cheng Y.; Lambowitz A. M.; Weissman J. S.; et al. Protein Synthesis. Rqc2p and 60S Ribosomal Subunits Mediate MRNA-Independent Elongation of Nascent Chains. Science 2015, 347 (6217), 75–78. 10.1126/science.1259724. [DOI] [PMC free article] [PubMed] [Google Scholar]
- Choe Y.-J.; Park S.-H.; Hassemer T.; Körner R.; Vincenz-Donnelly L.; Hayer-Hartl M.; Hartl F. U. Failure of RQC Machinery Causes Protein Aggregation and Proteotoxic Stress. Nature 2016, 531 (7593), 191–195. 10.1038/nature16973. [DOI] [PubMed] [Google Scholar]
- Yonashiro R.; Tahara E. B.; Bengtson M. H.; Khokhrina M.; Lorenz H.; Chen K.-C.; Kigoshi-Tansho Y.; Savas J. N.; Yates J. R.; Kay S. A.; et al. The Rqc2/Tae2 Subunit of the Ribosome-Associated Quality Control (RQC) Complex Marks Ribosome-Stalled Nascent Polypeptide Chains for Aggregation. eLife 2016, 5, e11794. 10.7554/eLife.11794. [DOI] [PMC free article] [PubMed] [Google Scholar]
- Defenouillère Q.; Zhang E.; Namane A.; Mouaikel J.; Jacquier A.; Fromont-Racine M. Rqc1 and Ltn1 Prevent C-Terminal Alanine-Threonine Tail (CAT-Tail)-Induced Protein Aggregation by Efficient Recruitment of Cdc48 on Stalled 60S Subunits. J. Biol. Chem. 2016, 291 (23), 12245–12253. 10.1074/jbc.M116.722264. [DOI] [PMC free article] [PubMed] [Google Scholar]
- Martínez-Limón A.; Alriquet M.; Lang W.-H.; Calloni G.; Wittig I.; Vabulas R. M. Recognition of Enzymes Lacking Bound Cofactor by Protein Quality Control. Proc. Natl. Acad. Sci. U. S. A. 2016, 113 (43), 12156–12161. 10.1073/pnas.1611994113. [DOI] [PMC free article] [PubMed] [Google Scholar]
- Proudfoot N. J. Ending the Message: Poly(A) Signals Then and Now. Genes Dev. 2011, 25 (17), 1770–1782. 10.1101/gad.17268411. [DOI] [PMC free article] [PubMed] [Google Scholar]
- Huang C.; Ren G.; Zhou H.; Wang C. A New Method for Purification of Recombinant Human Alpha-Synuclein in Escherichia Coli. Protein Expression Purif. 2005, 42 (1), 173–177. 10.1016/j.pep.2005.02.014. [DOI] [PubMed] [Google Scholar]
- Schatzlmaier P.; Supper V.; Göschl L.; Zwirzitz A.; Eckerstorfer P.; Ellmeier W.; Huppa J. B.; Stockinger H. Rapid Multiplex Analysis of Lipid Raft Components with Single-Cell Resolution. Sci. Signaling 2015, 8 (395), rs11. 10.1126/scisignal.aac5584. [DOI] [PubMed] [Google Scholar]
- Wiśniewski J. R.; Zougman A.; Nagaraj N.; Mann M. Universal Sample Preparation Method for Proteome Analysis. Nat. Methods 2009, 6 (5), 359–362. 10.1038/nmeth.1322. [DOI] [PubMed] [Google Scholar]
- Kulak N. A.; Pichler G.; Paron I.; Nagaraj N.; Mann M. Minimal, Encapsulated Proteomic-Sample Processing Applied to Copy-Number Estimation in Eukaryotic Cells. Nat. Methods 2014, 11 (3), 319–324. 10.1038/nmeth.2834. [DOI] [PubMed] [Google Scholar]
- Cox J.; Mann M. MaxQuant Enables High Peptide Identification Rates, Individualized p.p.b.-Range Mass Accuracies and Proteome-Wide Protein Quantification. Nat. Biotechnol. 2008, 26 (12), 1367–1372. 10.1038/nbt.1511. [DOI] [PubMed] [Google Scholar]
- Schwanhäusser B.; Busse D.; Li N.; Dittmar G.; Schuchhardt J.; Wolf J.; Chen W.; Selbach M. Global Quantification of Mammalian Gene Expression Control. Nature 2011, 473 (7347), 337–342. 10.1038/nature10098. [DOI] [PubMed] [Google Scholar]
- Tyanova S.; Temu T.; Sinitcyn P.; Carlson A.; Hein M. Y.; Geiger T.; Mann M.; Cox J. The Perseus Computational Platform for Comprehensive Analysis of (Prote)Omics Data. Nat. Methods 2016, 13 (9), 731–740. 10.1038/nmeth.3901. [DOI] [PubMed] [Google Scholar]
- Klus P.; Bolognesi B.; Agostini F.; Marchese D.; Zanzoni A.; Tartaglia G. G. The CleverSuite Approach for Protein Characterization: Predictions of Structural Properties, Solubility, Chaperone Requirements and RNA-Binding Abilities. Bioinformatics 2014, 30 (11), 1601–1608. 10.1093/bioinformatics/btu074. [DOI] [PMC free article] [PubMed] [Google Scholar]
- Kyte J.; Doolittle R. F. A Simple Method for Displaying the Hydropathic Character of a Protein. J. Mol. Biol. 1982, 157 (1), 105–132. 10.1016/0022-2836(82)90515-0. [DOI] [PubMed] [Google Scholar]
- Campen A.; Williams R. M.; Brown C. J.; Meng J.; Uversky V. N.; Dunker A. K. TOP-IDP-Scale: A New Amino Acid Scale Measuring Propensity for Intrinsic Disorder. Protein Pept. Lett. 2008, 15 (9), 956–963. 10.2174/092986608785849164. [DOI] [PMC free article] [PubMed] [Google Scholar]
- Tartaglia G. G.; Vendruscolo M. Proteome-Level Interplay between Folding and Aggregation Propensities of Proteins. J. Mol. Biol. 2010, 402 (5), 919–928. 10.1016/j.jmb.2010.08.013. [DOI] [PubMed] [Google Scholar]
- Fernandez-Escamilla A.-M.; Rousseau F.; Schymkowitz J.; Serrano L. Prediction of Sequence-Dependent and Mutational Effects on the Aggregation of Peptides and Proteins. Nat. Biotechnol. 2004, 22 (10), 1302–1306. 10.1038/nbt1012. [DOI] [PubMed] [Google Scholar]
- Mi H.; Huang X.; Muruganujan A.; Tang H.; Mills C.; Kang D.; Thomas P. D. PANTHER Version 11: Expanded Annotation Data from Gene Ontology and Reactome Pathways, and Data Analysis Tool Enhancements. Nucleic Acids Res. 2017, 45 (D1), D183–D189. 10.1093/nar/gkw1138. [DOI] [PMC free article] [PubMed] [Google Scholar]
- Szklarczyk D.; Franceschini A.; Wyder S.; Forslund K.; Heller D.; Huerta-Cepas J.; Simonovic M.; Roth A.; Santos A.; Tsafou K. P.; et al. STRING V10: Protein-Protein Interaction Networks, Integrated over the Tree of Life. Nucleic Acids Res. 2015, 43, D447–452. 10.1093/nar/gku1003. [DOI] [PMC free article] [PubMed] [Google Scholar]
- Fabre B.; Lambour T.; Bouyssie D.; Menneteau T.; Monsarrat B.; Burlet-Schiltz O.; Bousquet-Dubouch M.-P. Comparison of Label-Free Quantification Methods for the Determination of Protein Complexes Subunits Stoichiometry. EuPa Open Proteomics 2014, 4, 82–86. 10.1016/j.euprot.2014.06.001. [DOI] [Google Scholar]
- Defenouillère Q.; Namane A.; Mouaikel J.; Jacquier A.; Fromont-Racine M. The Ribosome-Bound Quality Control Complex Remains Associated to Aberrant Peptides during Their Proteasomal Targeting and Interacts with Tom1 to Limit Protein Aggregation. Mol. Biol. Cell 2017, 28 (9), 1165–1176. 10.1091/mbc.E16-10-0746. [DOI] [PMC free article] [PubMed] [Google Scholar]
- Christie M.; Chang C.-W.; Róna G.; Smith K. M.; Stewart A. G.; Takeda A. A. S.; Fontes M. R. M.; Stewart M.; Vértessy B. G.; Forwood J. K.; et al. Structural Biology and Regulation of Protein Import into the Nucleus. J. Mol. Biol. 2016, 428 (10A), 2060–2090. 10.1016/j.jmb.2015.10.023. [DOI] [PubMed] [Google Scholar]
- Leitner A.; Joachimiak L. A.; Bracher A.; Mönkemeyer L.; Walzthoeni T.; Chen B.; Pechmann S.; Holmes S.; Cong Y.; Ma B.; et al. The Molecular Architecture of the Eukaryotic Chaperonin TRiC/CCT. Structure 2012, 20 (5), 814–825. 10.1016/j.str.2012.03.007. [DOI] [PMC free article] [PubMed] [Google Scholar]
- Finley D.; Chen X.; Walters K. J. Gates, Channels, and Switches: Elements of the Proteasome Machine. Trends Biochem. Sci. 2016, 41 (1), 77–93. 10.1016/j.tibs.2015.10.009. [DOI] [PMC free article] [PubMed] [Google Scholar]
- Balchin D.; Hayer-Hartl M.; Hartl F. U. In Vivo Aspects of Protein Folding and Quality Control. Science 2016, 353 (6294), aac4354. 10.1126/science.aac4354. [DOI] [PubMed] [Google Scholar]
- Cieślik-Boczula K. Alpha-helix to beta-sheet transition in long-chain poly-l-lysine: Formation of alpha-helical fibrils by poly-l-lysine. Biochimie 2017, 137, 106–114. 10.1016/j.biochi.2017.03.006. [DOI] [PubMed] [Google Scholar]
- Cieślik-Boczula K. The PPII-to-α-helix transition of poly-l-lysine in methanol/water solvent mixtures accompanied by fibrillar self-aggregation: An influence of fluphenazine molecules. Biophys. Chem. 2017, 227, 14–20. 10.1016/j.bpc.2017.05.012. [DOI] [PubMed] [Google Scholar]
- Tam S.; Geller R.; Spiess C.; Frydman J. The Chaperonin TRiC Controls Polyglutamine Aggregation and Toxicity through Subunit-Specific Interactions. Nat. Cell Biol. 2006, 8 (10), 1155–1162. 10.1038/ncb1477. [DOI] [PMC free article] [PubMed] [Google Scholar]
- Kitamura A.; Kubota H.; Pack C.-G.; Matsumoto G.; Hirayama S.; Takahashi Y.; Kimura H.; Kinjo M.; Morimoto R. I.; Nagata K. Cytosolic Chaperonin Prevents Polyglutamine Toxicity with Altering the Aggregation State. Nat. Cell Biol. 2006, 8 (10), 1163–1170. 10.1038/ncb1478. [DOI] [PubMed] [Google Scholar]
- Behrends C.; Langer C. A.; Boteva R.; Böttcher U. M.; Stemp M. J.; Schaffar G.; Rao B. V.; Giese A.; Kretzschmar H.; Siegers K.; et al. Chaperonin TRiC Promotes the Assembly of PolyQ Expansion Proteins into Nontoxic Oligomers. Mol. Cell 2006, 23 (6), 887–897. 10.1016/j.molcel.2006.08.017. [DOI] [PubMed] [Google Scholar]
- Shibata Y.; Morimoto R. I. How the Nucleus Copes with Proteotoxic Stress. Curr. Biol. 2014, 24 (10), R463–474. 10.1016/j.cub.2014.03.033. [DOI] [PMC free article] [PubMed] [Google Scholar]
- Heck J. W.; Cheung S. K.; Hampton R. Y. Cytoplasmic Protein Quality Control Degradation Mediated by Parallel Actions of the E3 Ubiquitin Ligases Ubr1 and San1. Proc. Natl. Acad. Sci. U. S. A. 2010, 107 (3), 1106–1111. 10.1073/pnas.0910591107. [DOI] [PMC free article] [PubMed] [Google Scholar]
- Prasad R.; Kawaguchi S.; Ng D. T. W. A Nucleus-Based Quality Control Mechanism for Cytosolic Proteins. Mol. Biol. Cell 2010, 21 (13), 2117–2127. 10.1091/mbc.E10-02-0111. [DOI] [PMC free article] [PubMed] [Google Scholar]
- Park S.-H.; Kukushkin Y.; Gupta R.; Chen T.; Konagai A.; Hipp M. S.; Hayer-Hartl M.; Hartl F. U. PolyQ Proteins Interfere with Nuclear Degradation of Cytosolic Proteins by Sequestering the Sis1p Chaperone. Cell 2013, 154 (1), 134–145. 10.1016/j.cell.2013.06.003. [DOI] [PubMed] [Google Scholar]
- Erales J.; Coffino P. Ubiquitin-Independent Proteasomal Degradation. Biochim. Biophys. Acta, Mol. Cell Res. 2014, 1843 (1), 216–221. 10.1016/j.bbamcr.2013.05.008. [DOI] [PMC free article] [PubMed] [Google Scholar]
- Vizcaíno J. A.; Deutsch E. W.; Wang R.; Csordas A.; Reisinger F.; Ríos D.; Dianes J. A.; Sun Z.; Farrah T.; Bandeira N.; et al. ProteomeXchange Provides Globally Coordinated Proteomics Data Submission and Dissemination. Nat. Biotechnol. 2014, 32 (3), 223–226. 10.1038/nbt.2839. [DOI] [PMC free article] [PubMed] [Google Scholar]
Associated Data
This section collects any data citations, data availability statements, or supplementary materials included in this article.