

Abstract
From a clinical point of view, easily obtainable and useful markers of a particular pathological status are required for appropriate diagnosis and treatment. Analysis of the proteomic profile of saliva may allow for the selection of potential marker of preterm delivery in humans. Saliva samples were collected from 12 patients diagnosed with threatened preterm delivery and 10 controls with uncomplicated pregnancies at the same gestational age. Samples were analysed using 2D electrophoresis. Based on statistical analysis, spots of interest were selected and collected from gels. Subsequently, spots were decoloured and proteins were identified by mass spectrometry using the matrix assisted laser desorption ionization-time of flight technique. The results of identification were compared with the Swiss-Prot database. A total of 1,393 spots were detected in the present study with 59 significantly different between control and preterm samples. Increased intensity of staining of 32 spots was observed in the premature delivery group compared with control patients and 27 spots were stained more intensely in the control group compared with the premature delivery group. A total of nine spots, which were significantly different between examined samples were identified and three of them exhibited increased intensity of staining in premature delivery group compared with controls, including dedicator of cytokinesis protein 1, metallothionein-2, guanylyl cyclase-activating protein 1. The six remaining spots included, epithelial-stromal interaction protein 1, serum albumin, tyrosine-tRNA ligase, cytoplasmic, protein chibby homolog 3, leukemia inhibitory factor receptor and adenosylhomocysteinase 3, and exhibited increased intensity of staining in healthy controls compared with premature delivery group. Further studies with an increased number of patients and identification of the complete protein profile are required to confirm the results of the present study and applicability of saliva as a source of disease biomarkers.
Keywords: premature delivery, saliva, proteins, preterm delivery, proteomic profile
Introduction
Saliva is an easily obtainable biological fluid, which can reflect body metabolism (1). Certain components of saliva are secreted by salivary glands, while other components originate from plasma. Of human saliva proteins, 30% are of blood origin and the majority of them exhibit antimicrobial activities, indicating that composition of saliva is dependent on the composition of plasma (2). Analysis of human saliva can be used as a diagnostic tool to detect markers of diseases and physiological states (3).
Certain reports have stated that several parameters in human saliva resemble those in plasma. Öztürk et al (4) examined lipid peroxidation intensity during human gestation and postpartum, and identified an association between the concentration of examined parameters in plasma and saliva. Salivary glands express oestrogen receptors and therefore, pregnancy may affect the composition of saliva (5).
Preterm delivery is defined as parturition before the 37th week of gestation and is the most common cause of perinatal morbidity and mortality. A general hormonal profile of patients in the periparturient period has already been described, however detailed mechanisms underlying the initiation of delivery remain unclear (6). Elucidation and annotation of protein profile in plasma and in saliva may be useful for understanding the physiological processes underlying delivery and potential pathologies (7). There are several reports describing plasma and placental protein profile during human gestation (8–10); however, data regarding salivary proteins are scarce.
Menon et al (11), reviewed several co-regulated processes associated with delivery, including the study of foetal membranes, maternal signals, maturation of foetal organs and hormonal profile. The study emphasized the role of proteins in the aforementioned processes associated with delivery (11).
From a clinical point of view, it is necessary to develop a rapid and accurate method for predicting the time of delivery, and to identify women at risk for spontaneous preterm birth or other alterations during pregnancy. The aim of the present study was to evaluate protein profile in saliva from patients with uncomplicated pregnancy and delivery at term, and to compare the profile with that from premature delivery.
Materials and methods
Patients
The present study included 22 pregnant women receiving treatment and delivering between February 2015 and November 2016 at the Department of Obstetrics and Pathology of Pregnancy at the Independent Clinical Hospital No. 1 in Lublin, Medical University of Lublin (Lublin, Poland). The study was approved by The Ethics Committee of the Medical University of Lublin (KE-0254/77/2014).
The study group [partus praematurus imminens (PPI)] included 12 patients with preterm uterine contractions and diagnosis of threatened preterm delivery. Iatrogenic preterm birth occurred in 1 patient as a result of foetal distress and 3 patients delivered at term despite symptoms of threatened preterm delivery. These 4 patients were excluded from further analysis. Saliva was collected at the time of admission to the Independent Clinical Hospital No 1 in Lublin, Poland.
The control group (C) included 10 patients with uncomplicated pregnancies. During routine control visits between 27–32 weeks of gestation in the outpatients clinic, saliva was collected form each patient. One patient from the control group declined to continue participation in the study and another delivered in a different hospital; thus, these patients were excluded from the study. Therefore, data from 16 women were further analysed, including 8 C group patients and 8 PPI patients. Inclusion criteria was a follows: Maternal age, >18; delivery prior to 35 weeks of gestation; intact membranes; and regular uterine contractions with cervical effacement ≥50%. Exclusion criteria were as follows: Multiple pregnancy; no confirmation of gestational age by ultrasound examination performed in the first trimester; iatrogenic preterm birth; and smoking during pregnancy. Written informed consent was obtained from all participants at the time of enrolment. Participation in the study was voluntary. The characteristics of study participants are presented in Table I. Mean gestational age at the time of sample collection in both groups was 31.5±2.8 weeks. Saliva was collected in the morning prior to eating.
Table I.
Characteristics of the patients and controls.
| Characteristic | Experimental group (n=8) | Control group (n=8) |
|---|---|---|
| Mean maternal age (years) | 27.8±3.6 | 28.4±5.8 |
| Mean gestational age at delivery (weeks) | 31.5±2.8 | 39.2±1.3 |
| Number primiparous | 5 (62%) | 3 (37%) |
| Mean birth weight (g) | 1952±980 | 3608±505 |
| Maternal BMI (kg/m2) | 28.4±7.2 | 29.6±6.8 |
Values are presented as the mean ± standard deviation. BMI, body mass index.
Preparation of saliva
Saliva samples were collected in Salivette tubes (Sarstedt, Inc., Newton, NC, USA). Samples were centrifuged for 15 min at 5,000 × g in 4°C. Protease inhibitor cocktail (10 µl; cat. no. I3911; Sigma-Aldrich; Merck KGaA, Darmstadt, Germany) was added to 1,000 µl of supernatant. The samples were stored at −20°C prior to further analysis.
Then thawed saliva (700 µl) was concentrated to ~50 µl using Vivaspin columns for ultrafiltration (polyethersulfone membrane, molecular weight cutoff 3 kDa; Sartorius AG, Göttingen, Germany), washed twice with 100 µl 7.0 pH 20 mM PBS and suspended in 330 µl rehydration buffer containing 8 M urea, 2% CHAPS, 50 mM dithiothreitol (DTT), 0.2% Bio-Lyte 3/10 ampholyte and 0.001% bromophenol blue.
Electrophoresis
Isoelectric focusing was performed using strips with linear gradient of pH 3–10 and length of 17 cm. Each saliva sample was loaded onto one strip. Preparation of SDS-PAGE (16×20 cm; 1.0 mm; T=11%, C=2.6%) was performed as previously described by Laemmli (12). The second dimension was performed using a Protean II XL cell (Bio-Rad Laboratories, Inc., Hercules, CA, USA) according to the manufacturer's protocol. Gels were stained with silver nitrate according to MS compatible protocol (13).
Identification of spots
Selected spots of interest (27 spots) were removed from the gels manually (in accordance to significance and intensity of staining), cut into small pieces and transferred to 0.5 ml Eppendorf tubes. The gel pieces were subsequently washed three times with 100 µl 100 mM NH4HCO3 buffer (pH 8.5; Sigma-Aldrich; Merck KGaA) for 5 min. Gel pieces were dehydrated by adding 100 µl acetonitrile (ACN) and dried for 15 min at room temperature in vacuum concentrator CentriVap with 220 × g (Labconco Corporation, Kansas City, MO, USA). Samples were resuspended in 100 µl of 10 mM DTT in 50 mM NH4HCO3 buffer in order to perform reduction at 56°C for 60 min. Following cooling to room temperature, the solution was replaced by 100 µl of 50 mM iodoacetamide in 50 mM NH4HCO3 buffer and samples were incubated in the dark for 45 min at room temperature. Trypsin digestion of proteins was carried out on ice by gradual addition of 10 µl 12.5 ng/ml enzyme solution (Trypsin Gold; mass spectrometry grade; Promega Corporation, Madison, WI, USA) in 50 mM NH4HCO3 buffer until proteins were completely rehydrated. Finally, 30 µl 50 mM NH4HCO3 buffer was added to each sample and digestion reaction was allowed to proceed at 37°C overnight. Following digestion, the supernatant was collected and peptides were extracted three times with 50 µl 70% ACN and 1.5% trifluoroacetic acid (TFA) by sonication for 15 min at room temperature in an ultrasonic water bath (Ultron U-507; Ultron, Dywity, Poland). The supernatant was collected and dried in the CentriVap (Labconco Corporation) for 45 min at 40°C and 220 × g.
The obtained pellet of peptides was resuspended in 10 µl 0.1% TFA and purified with µC18 ZipTip columns (Eppendorf, Hamburg, Germany) in accordance with the manufacturer's protocol. After purification, 1 µl peptide solution (1.5% TFA, 30% ACN) was applied to α-cyano-4-hydroxycinnamic acid-Prespotted AnchorChip frame (Bruker Corporation, Billerica, MA, USA) and left to dry at room temperature. Mass spectra were obtained using Ultraflex III matrix-assisted laser desorption/ionization time-of-flight/time-of-flight spectrometer (MALDI; Bruker Corporation). Acquisition was performed in positive ion reflector mode with a 25 kV acceleration voltage. External calibrations were prepared using the peptide calibration standard (Bruker Corporation). FlexAnalysis 3.0 software (Bruker Corporation) was used for selection of monoisotopic peptide masses.
Identification of peptides and proteins from mass spectrometry data was performed using Mascot algorithm (Mascot 2.2 software; Matrix Science, Ltd., London, UK) and Swiss-Prot database (UniProt release 2016_07; uniprot.org/statistics/Swiss-Prot) restricted to the human taxonomy. Search parameters were set in the following mode: Enzyme-trypsin, up to 1 missed cleavages, fixed modification-carboamoinodmethylation cysteine, variable modification-oxidation of methionine, error of 50 ppm. Analyses and comparisons with the database were made by the BioTools 3.2 software (Bruker Corporation).
Statistical analysis
Delta2D software (version 4.6; Decodon GmbH, Greifswald, Germany) was used to differentiate the presence of particular spots and intensity of staining within examined saliva samples using one-way analysis of variance, as previously described (14). As a result, a list of most common and differential spots between groups C and PPI (P<0.05) was created and spots for further analysis were selected. A principal components analysis scatterplot (PCA 3D) of all spots was constructed using Delta2D software (15).
Spot selection for identification was based on the presence of spots in one or both of the examined groups as well as their intensity of staining that reflects the amount of protein necessary for further identification analysis (highly visible spots with amount of protein more that 5–10 ng). The number of analysed saliva samples followed proteomic requirements (16,17). The specificity and sensitivity of used laboratory methods (16,17) allowed for reliable statistical analysis. Data is presented as the mean ± standard deviation. P<0.05 was considered to indicate a statistically significant difference.
The protein identification of spots was based on the comparison with UniProt databases and confirmed by Mascot scores (http://www.matrixscience.com/help/scoring_help.html). Scores >67 were considered to indicate a statistical significance.
Results
Out of 1,393 detected spots, 59 were significantly different between the C and PPI groups. Statistical analysis demonstrated that 32 spots exhibited increased intensity of staining in PPI group samples compared with the C group, while 27 had the opposite trend (Table II). Out of 59 spots that differed significantly between examined groups 9 were identified and are shown in Table III. Three spots exhibited increased intensity of staining in the PPI group compared with the C group: Dedicator of cytokinesis protein 1 (DOCK1), metallothionein-2 (MT2A) and guanylyl cyclase-activating protein 1 (GUCA1A). Six spots exhibited an opposite pattern in PPI and C groups: Epithelial-stromal interaction protein 1 (EPSTI1), serum albumin, tyrosine--tRNA ligase, cytoplasmic (YARS), protein chibby homolog 3, leukemia inhibitory factor receptor (LIFR) and adenosylhomocysteinase 3. DOCK1 is a haemostasis-associated protein, and GUCA1A and EPSTI1 are proteins associated with programmed cell death. YARS is associated with gene expression and LIFR has a role in the immune system. MT2A involved in antioxidative defence.
Table II.
Statistical analysis of significantly different (P<0.05) spots between examined groups of patients, C and PPI.
| Spot label | PPI mean | Control mean | C/PPI ratio | P-value |
|---|---|---|---|---|
| 1 | 0.053 | 0.001 | 0.027 | 0.024 |
| 2 | 0.045 | 0.002 | 0.035 | 0.021 |
| 3 | 0.011 | 0.002 | 0.181 | 0.015 |
| 4 | 0.024 | 0.005 | 0.225 | 0.024 |
| 5 | 0.015 | 0.002 | 0.118 | 0.034 |
| 6 | 0.145 | 0.219 | 1.509 | 0.048 |
| 7 | 0.307 | 0.597 | 1.948 | 0.031 |
| 8 | 0.107 | 0.283 | 2.639 | 0.045 |
| 9 | 0.025 | 0.005 | 0.189 | 0.004 |
| 10 | 0.015 | 0.003 | 0.197 | 0.011 |
| 11 | 0.064 | 0.229 | 3.574 | 0.011 |
| 12 | 0.207 | 0.364 | 1.759 | 0.048 |
| 13 | 1.233 | 2.411 | 1.956 | 0.023 |
| 14 | 0.068 | 0.235 | 3.434 | 0.016 |
| 15 | 0.009 | 0.002 | 0.184 | 0.044 |
| 16 | 0.01 | 0.002 | 0.174 | 0.03 |
| 17 | 0.032 | 0.003 | 0.105 | 0.015 |
| 18 | 0.1 | 0.037 | 0.368 | 0.024 |
| 19 | 0.05 | 0.139 | 2.793 | 0.028 |
| 20 | 0.028 | 0.008 | 0.273 | 0.033 |
| 21 | 0.014 | 0.062 | 4.396 | 0.019 |
| 22 | 0.037 | 0.011 | 0.307 | 0.014 |
| 23 | 0.017 | 0.053 | 3.071 | 0.028 |
| 24 | 0.015 | 0.002 | 0.14 | 0.021 |
| 25 | 0.008 | 0.059 | 7.127 | 0.012 |
| 26 | 0.096 | 0.025 | 0.262 | 0.016 |
| 27 | 0.818 | 0.311 | 0.38 | 0.003 |
| 28 | 0.335 | 0.042 | 0.125 | 0.036 |
| 29 | 1.116 | 0.542 | 0.485 | 0.026 |
| 30 | 0.023 | 0.002 | 0.099 | 0.044 |
| 31 | 0.118 | 0.318 | 2.681 | 0.017 |
| 32 | 0.009 | 0.002 | 0.238 | 0.041 |
| 33 | 0.011 | 0.001 | 0.119 | 0.042 |
| 34 | 0.027 | 0.003 | 0.13 | 0.0005 |
| 35 | 0.021 | 0.005 | 0.215 | 0.044 |
| 36 | 0.084 | 0.254 | 3.03 | 0.006 |
| 37 | 0.347 | 1.062 | 3.06 | 0.002 |
| 38 | 0.018 | 0.074 | 4.14 | 0.024 |
| 39 | 0.135 | 0.035 | 0.26 | 0.047 |
| 40 | 0.013 | 0.003 | 0.218 | 0.043 |
| 41 | 0.009 | 0.025 | 2.606 | 0.03 |
| 42 | 0.31 | 0.975 | 3.144 | 0.009 |
| 43 | 0.017 | 0.003 | 0.18 | 0.022 |
| 44 | 0.021 | 0.005 | 0.254 | 0.039 |
| 45 | 0.02 | 0.086 | 4.383 | 0.006 |
| 46 | 0.058 | 0.138 | 2.386 | 0.007 |
| 47 | 0.07 | 0.862 | 12.254 | 0.01 |
| 48 | 0.475 | 0.069 | 0.144 | 0.016 |
| 49 | 0.103 | 0.357 | 3.473 | 0.0005 |
| 50 | 0.045 | 0.006 | 0.133 | 0.049 |
| 51 | 0.046 | 0.011 | 0.244 | 0.026 |
| 52 | 0.776 | 1.185 | 1.526 | 0.045 |
| 53 | 0.143 | 0.363 | 2.539 | 0.005 |
| 54 | 0.049 | 0.019 | 0.384 | 0.041 |
| 55 | 0.056 | 0.175 | 3.13 | 0.006 |
| 56 | 0.04 | 0.127 | 3.144 | 0.013 |
| 57 | 0.207 | 0.692 | 3.338 | 0.026 |
| 58 | 0.029 | 0.134 | 4.617 | 0.025 |
| 59 | 0.105 | 0.024 | 0.228 | 0.001 |
Ratio >1 indicates increased abundance of a spot in the PPI group compared with the C group. C, control; PPI, partus praematurus imminens. Mean values are obtained from densitometric analysis of gels from all C and PPI patients in duplicate-mean spot volume (intensity of staining × spot area). Table corresponds with Figure 3.
Table III.
The list of identified spots in saliva of the examined groups of patients.
| Spot label | Protein | UniProt entry | Mascot Score | Protein sequence coverage (%) | Molecular weight (kDa) | pI |
|---|---|---|---|---|---|---|
| 6 | Epithelial-stromal interaction protein 1 | Q96J88 (ESIP1_HUMAN) | 58 | 16 | 36.80 | 9.90 |
| 12 | Serum albumin | P02768 (ALBU_HUMAN) | 61 | 21 | 69.37 | 5.92 |
| 18 | Dedicator of cytokinesis protein 1 | Q14185 (DOCK1_HUMAN) | 87 | 8 | 21.53 | 7.29 |
| 19 | Tyrosine-tRNA ligase, cytoplasmic | P54577 (SYYC_HUMAN) | 80 | 18 | 59.14 | 6.61 |
| 21 | Protein chibby homolog 3 | A6NI87 (CBY3_HUMAN) | 59 | 33 | 27.34 | 10.65 |
| 22 | Metallothionein-2 | P02795 (MT2_HUMAN) | 65 | 54 | 6.04 | 8.23 |
| 23 | Leukemia inhibitory factor receptor | P42702 (LIFR_HUMAN) | 133 | 16 | 123.74 | 5.50 |
| 25 | Adenosylhomocysteinase 3 | Q96HN2 (SAHH3_HUMAN) | 160 | 19 | 66.72 | 7.13 |
| 29 | Guanylyl cyclase-activating protein 1 | P43080 (GUC1A_HUMAN) | 62 | 57 | 22.92 | 4.34 |
pI, isoelectric point. Mascot Scores greater than 67 were considered significant at (P<0.05).
In addition, 18 spots that did not differ in intensity of staining between groups were identified. The identified proteins included, carboxypeptidase E (Cpe), fucose-1-phosphate guanylyltransferase (FKGP), E3 ubiquitin-protein ligase TRIM56 (TRIM56), myosin light chain kinase 2, skeletal/cardiac muscle (Mylk2), CMP-N-acetylneuraminate-β-galactosamide-α-2,3-sialyltransferase 4 (ST8SIA4), methyltransferase-like protein 13 (METTL13) and pancreatic lipase-related protein 3 (PNLIPRP3). The above proteins have roles in cell metabolism, but are not associated with pregnancy and were not considered as clinically significant.
Fig. 1 presents fused image of spots from both examined groups, which were overlapped by use of Delta2D software. Orange spots are from C group, blue from PPI group while common spots for both groups are marked with black. The figure demonstrates the profile and location of the spots distributed in accordance to the isoelectric point and molecular weight of proteins, which were in examined the biological fluids.
Figure 1.

Merged images of spots from healthy individuals (orange) and patients with PPI (blue) and spots identified in both groups (black). Spots which were statistically significant and identified (based on intensity of staining) are marked with arrows and correspond with numbers in Tables II and III. Picture represents overlapped samples from all C and PPI patients in duplicate. Gel was stained with silver nitrate but Delta2D software allowed to distinguish between spots which are common for both examined groups and individual for C group or PPI group and mark them in colour separately. PPI, partus praematurus imminens.
Fig. 2 presents PCA scatterplot from C group marked with green area and PPI group marked with red area. The location of areas represents the association between the obtained spots and indicates that the majority of proteins are similar in examined samples as they overlay.
Figure 2.
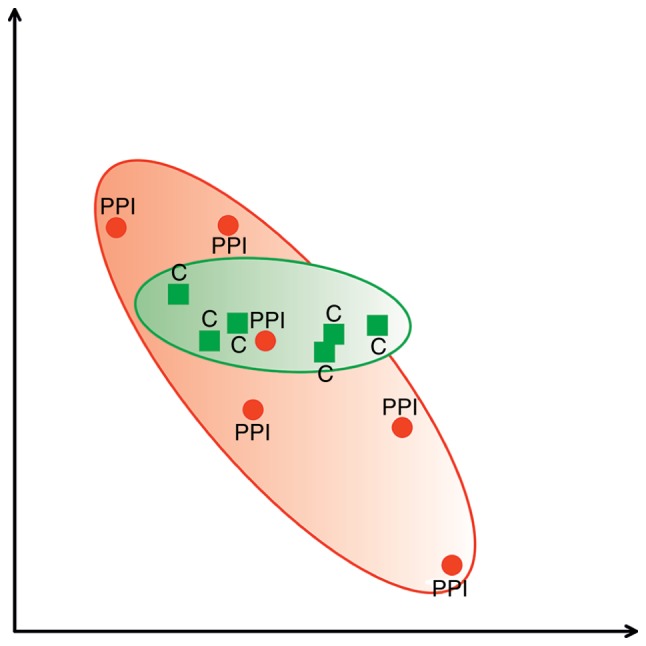
PCA scatterplot presenting analysis of spots from PPI group (red area) and C group (green area). Statistical analysis of association between spots obtained from examined groups of patients (PCA 3D) (15). The range of overlapping areas represent the differences between examined groups of patients. The picture was created by Delta2D software based on statistical analysis (15). C, control; PPI, partus praematurus imminens; PCA, principal components analysis.
Fig. 3 represents histograms of all spots that differ significantly in accordance to intensity of staining what indirectly reflects the amount of protein. All 59 pairs are significantly different between each other at (P<0.05). Y-axis reflects the mean spot volume (intensity of staining × spot area). X axis-experimental groups.
Figure 3.

Histograms of proteins that differ in intensity of staining between C and PPI groups. The intensity of staining was analysed densitometrically during the analysis of gels by Delta2D software. Y-axis represents the mean spot volume (intensity of staining × spot area) while X-axis experimental groups. All pairs differ significantly at aP<0.05 vs. PPI, bP<0.05 vs. C. Detailed statistical analysis is in Table II. C, control; PPI, partus praematurus imminens.
Discussion
The present study compared the proteomic pattern of saliva from patients that delivered at term, with those that delivered prematurely. Statistical analysis enabled identification of the spots that differed significantly in intensity of staining between the examined groups of patients. As the intensity of staining reflects the amount of protein in spot, this analysis indicated quantitative differences in saliva protein profile between examined spots. The majority of detected spots expressed similar intensity. Proteins corresponding to certain spots were identified.
A preliminary report featuring a plasma protein profile in humans during pregnancy was published in 1978 by Joseph et al (8). Term 2D protein profile of human placenta was described by Mushahary et al (9). Pregnancy-associated proteins, which have a role in maintenance of human placenta include proteins detected in maternal serum, foetal proteins and soluble, solubilized or membrane-associated placental proteins (18).
Yuan et al (10) described protein profile of human placental blood plasma obtained from patients that underwent elective caesarean section (not in labour), spontaneous vaginal delivery, induction of labour vaginal delivery, spontaneous delivery, emergency caesarean section and induction of delivery. Apolipoproteins A-IV, E and C-III were considered to be associated with the onset of delivery while hepatocyte nuclear factor 1 homeobox A was common for human parturition regardless of type of delivery (10).
Preterm delivery may cause perinatal mortality and morbidity, and is defined as birth prior to 37 weeks of gestation (19). Although several factors are known to be involved in spontaneous preterm termination of pregnancy, biochemical markers of preterm delivery remain to be elucidated. Previous studies indicated that intrauterine inflammation may be one of the initiating factors of preterm delivery (20,21). There are several other possible factors associated with this pathological condition, including uteroplacental ischemia, decidual haemorrhage, failure in the maternal immunological tolerance of the foetus, allergies, abnormal uterine size, cervical incompetence, maternal and foetal stress and hormonal irregularities (22).
Numerous studies associated with preterm birth have demonstrated that alterations in the expression of particular molecules are associated with certain disturbances but none of them were considered diagnostic tools and markers (19,21–24). These molecules include membrane and soluble proteins present or absent in the placental tissue of patients with preterm birth (23). Proteins that are only detectable in preterm placenta compared with placenta from full-term births include, vimentin, β-actin and γ-actin as representatives of structural proteins, and soluble proteins, including lactoylglutathione lyase, transgelin and 78 kDa glucose-regulated protein. Preterm labour is also characterized by lack of certain placental proteins, which are present in normal term placenta. These include membrane proteins annexin A4 and type I keratin, and proteins present in the soluble fraction, including endoplasmin, and β- and γ-actin (24).
Elevated levels of MT2A in saliva of PPI patients compared with C patients detected in the present study may indicate oxidative stress (25). Oxidative stress alters protein molecules via peroxidative damage and complicate preterm births (26). These results are supported by the present study where, LIFR, which has a role in ovulation, implantation and fertility, was downregulated in the PPI group compared with the C group, suggesting potential alterations in protein metabolism.
Identification of proteins that exhibit similar patterns of expression in the examined saliva may aid in elucidating the sequence of events that leads to premature delivery. Molecules identified in the present study belong to different functional groups, including enzymes, and may indicate the presence of reactions that take place regardless of pregnancy-associated alterations and appear to be necessary both in physiological and pathological conditions. Among identified proteins were enzymes, including, Cpe, FKGP, TRIM56, Mylk2, ST8SIA4, METTL13 and PNLIPRP3.
As described in the review by Menon et al (11), the onset of parturition requires a complex and simultaneous transduction of several signals from the foetus, foetal membranes and the mother via local and general systems. Certain proteins may have roles in modulation of reactions during delivery in physiological and pathological conditions. Previous studies indicated that saliva may be a source of parameters of diagnostic use in diseases of the oral cavity, diabetes or breast cancer; however, the use of saliva samples for diagnostics in obstetrics requires further investigation (27–29). The present investigated saliva in the context of threatened preterm delivery.
In conclusion, although saliva is an easy obtainable biological fluid, its use in diagnostic procedures is currently limited, due to the lack of information regarding its content. The results of the present study suggested that MT2A in saliva, which has a role in oxidative stress, may be a potential marker indicating risk of premature delivery. Further studies with an increased number of patients are necessary for verification and validation of the results. The present study suggests a potential for targeted proteomic analysis of saliva to identify biomarkers that may predict premature delivery and other alterations associated with the periparturient period.
Acknowledgements
Not applicable.
Funding
The present study was supported by Statutory Activity of University of Life Sciences in Lublin (WKB-DS-4) and Statutory Activity of Medical University of Lublin (DS/122/2015-2017).
Availability of data and materials
All data generated or analyzed during this study are included in this published article.
Authors' contributions
MŁ and MK conceived the presented idea. TG and AM developed the theory and performed the computations. MŁ and MK verified the analytical methods. JW and MF expressed and purified all proteins. TG and AM analysed the data. JW designed the figures. MŁ, TG and AM supervised the findings of this work. All authors discussed the results and contributed to the final manuscript.
Ethics approval and consent to participate
Written informed consent was obtained from all participants at the time of enrolment. The study was approved by the Ethics Committee of the Medical University of Lublin (KE-0254/77/2014).
Consent for publication
Informed patient consent was obtained from all participants at the time of enrolment.
Competing interests
The authors declare that they have no competing interests.
References
- 1.Lima DP, Diniz DG, Moimaz SA, Sumida DH, Okamoto AC. Saliva: Reflection of the body. Int J Infect Dis. 2010;14:e184–e188. doi: 10.1016/j.ijid.2009.04.022. [DOI] [PubMed] [Google Scholar]
- 2.Schulz BL, Cooper-White J, Punyadeera CK. Saliva proteome research: Current status and future outlook. Crit Rev Biotechnol. 2013;33:246–259. doi: 10.3109/07388551.2012.687361. [DOI] [PubMed] [Google Scholar]
- 3.Xiao H, Wong DT. Proteomics and its applications for biomarker discovery in human saliva. Bioinformation. 2011;5:294–296. doi: 10.6026/97320630005294. [DOI] [PMC free article] [PubMed] [Google Scholar]
- 4.Öztürk LK, Akyüz S, Yarat A, Koç S, Gül N, Doğan BN. Salivary lipid peroxidation and total sialic acid levels during healthy gestation and postpartum: A longitudinal study. Clin Biochem. 2010;43:430–434. doi: 10.1016/j.clinbiochem.2009.10.053. [DOI] [PubMed] [Google Scholar]
- 5.Valimaa H, Savolainen S, Soukka T, Silvoniemi P, Mäkelä S, Kujari H, Gustafsson JA, Laine M. Estrogen receptor-beta is the predominant estrogen receptor subtype in human oral epithelium and salivary glands. J Endocrinol. 2004;180:55–62. doi: 10.1677/joe.0.1800055. [DOI] [PubMed] [Google Scholar]
- 6.Catalano RD, Lannagan TR, Gorowiec M, Denison FC, Norman JE, Jabbour HN. Prokineticins: Novel mediators of inflammatory and contractile pathways at parturition? Mol Hum Reprod. 2010;16:311–319. doi: 10.1093/molehr/gaq014. [DOI] [PubMed] [Google Scholar]
- 7.Shankar R, Gude N, Cullinane F, Brennecke S, Purcell AW, Moses EK. An emerging role for comprehensive proteome analysis in human pregnancy research. Reproduction. 2005;129:685–696. doi: 10.1530/rep.1.00524. [DOI] [PubMed] [Google Scholar]
- 8.Joseph JC, Baker C, Sprang ML, Bermes EW. Changes in plasma proteins during pregnancy. Ann Clin Lab Sci. 1978;8:130–141. [PubMed] [Google Scholar]
- 9.Mushahary D, Gautam P, Sundaram CS, Sirdeshmukh R. Expanded protein expression profile of human placenta using two-dimensional gel electrophoresis. Placenta. 2013;34:193–196. doi: 10.1016/j.placenta.2012.11.015. [DOI] [PubMed] [Google Scholar]
- 10.Yuan W, Heesom K, Phillips R, Chen L, Trinder J, Bernal López A. Low abundance plasma proteins in labour. Reproduction. 2012;144:505–518. doi: 10.1530/REP-12-0114. [DOI] [PubMed] [Google Scholar]
- 11.Menon R, Bonney EA, Condon J, Mesiano S, Taylor RN. Novel concepts on pregnancy clocks and alarms: Redundancy and synergy in human parturition. Hum Reprod Update. 2016;22:535–560. doi: 10.1093/humupd/dmw022. [DOI] [PMC free article] [PubMed] [Google Scholar]
- 12.Laemmli UK. Cleavage of structural proteins during the assembly of the head of bacteriophage T4. Nature. 1970;227:680–685. doi: 10.1038/227680a0. [DOI] [PubMed] [Google Scholar]
- 13.Shevchenko A, Wilm M, Vorm O, Mann M. Mass spectrometric sequencing of proteins silver-stained polyacrylamide gels. Anal Chem. 1996;68:850–858. doi: 10.1021/ac950914h. [DOI] [PubMed] [Google Scholar]
- 14.Jerrold HZ. Biostatistical Analysis. 4th edition. Prentice Hall; New Jersey: 1999. [Google Scholar]
- 15.Jolliffe IT. Principal Component Analysis. 2nd edition. Springer; 2002. [Google Scholar]
- 16.Smit S, Hoefsloot HC, Smilde AK. Statistical data processing in clinical proteomics. J Chromatogr B Analyt Technol Biomed Life Sci. 2008;866:77–88. doi: 10.1016/j.jchromb.2007.10.042. [DOI] [PubMed] [Google Scholar]
- 17.Chich JF, David O, Villers F, Schaeffer B, Lutomski D, Huet S. Statistics for proteomics: Experimental design and 2-DE differential analysis. J Chromatogr B Analyt Technol Biomed Life Sci. 2007;849:261–272. doi: 10.1016/j.jchromb.2006.09.033. [DOI] [PubMed] [Google Scholar]
- 18.Mine K, Katayama A, Matsumura T, Nishino T, Kuwabara Y, Ishikawa G, Murata T, Sawa R, Otsubo Y, Shin S, Takeshita T. Proteome analysis of human placentae: Pre-eclampsia versus normal pregnancy. Placenta. 2007;28:676–687. doi: 10.1016/j.placenta.2006.10.005. [DOI] [PubMed] [Google Scholar]
- 19.Parry S, Zhang H, Biggio J, Bukowski R, Varner M, Xu Y, Andrews WW, Saade GR, Esplin MS, Leite R, et al. Maternal serum serpin B7 is associated with early spontaneous preterm birth. Am J Obstet Gynecol. 2014;211:678.e1–e12. doi: 10.1016/j.ajog.2014.06.035. [DOI] [PMC free article] [PubMed] [Google Scholar]
- 20.Nelson DM, Sadovsky Y, Robinson JM, Croy BA, Rice G, Kniss DA. Advanced techniques in placental biology-workshop report. Placenta. 2006;27(Suppl A):S87–S90. doi: 10.1016/j.placenta.2006.01.012. [DOI] [PubMed] [Google Scholar]
- 21.Kim MA, Lee YS, Seo K. Assessment of predictive markers for placental inflammatory response in preterm births. PLoS One. 2014;9:e107880. doi: 10.1371/journal.pone.0107880. [DOI] [PMC free article] [PubMed] [Google Scholar]
- 22.Pařízek A, Koucký M, Dušková M. Progesterone, inflammation and preterm labor. J Steroid Biochem Mol Biol. 2014;139:159–165. doi: 10.1016/j.jsbmb.2013.02.008. [DOI] [PubMed] [Google Scholar]
- 23.Romero R, Espinoza J, Gotsch F, Kusanovic JP, Friel LA, Erez O, Mazaki-Tovi S, Than NG, Hassan S, Tromp G. The use of high-dimensional biology (genomics, transcriptomics, proteomics, and metabolomics) to understand the preterm parturition syndrome. BJOG. 2006;113:118–135. doi: 10.1111/j.1471-0528.2006.01150.x. [DOI] [PMC free article] [PubMed] [Google Scholar]
- 24.Butt RH, Lee MW, Pirshahid SA, Backlund PS, Wood S, Coorssen JR. An initial proteomic analysis of human preterm labor: Placental membranes. J Proteome Res. 2006;5:3161–3172. doi: 10.1021/pr060282n. [DOI] [PubMed] [Google Scholar]
- 25.Vašák M, Meloni G. Chemistry and biology of mammalian metallothioneins. J Biol Inorg Chem. 2011;16:1067–1078. doi: 10.1007/s00775-011-0799-2. [DOI] [PubMed] [Google Scholar]
- 26.Menon R. Oxidative stress damage as a detrimental factor in preterm birth pathology. Front Immunol. 2014;5:567. doi: 10.3389/fimmu.2014.00567. [DOI] [PMC free article] [PubMed] [Google Scholar]
- 27.Zhang A, Sun H, Wang P, Wang X. Salivary proteomics in biomedical research. Clin Chim Acta. 2013;415:261–265. doi: 10.1016/j.cca.2012.11.001. [DOI] [PubMed] [Google Scholar]
- 28.Al Kawas S, Rahim ZH, Ferguson DB. Potential uses of human salivary protein and peptide analysis in the diagnosis of disease. Arch Oral Biol. 2012;57:1–9. doi: 10.1016/j.archoralbio.2011.06.013. [DOI] [PubMed] [Google Scholar]
- 29.Al-Tarawneh SK, Border MB, Dibble CF, Bencharit S. Defining salivary biomarkers using mass spectrometry-based proteomics: A systematic review. OMICS. 2011;15:353–361. doi: 10.1089/omi.2010.0134. [DOI] [PMC free article] [PubMed] [Google Scholar]
Associated Data
This section collects any data citations, data availability statements, or supplementary materials included in this article.
Data Availability Statement
All data generated or analyzed during this study are included in this published article.