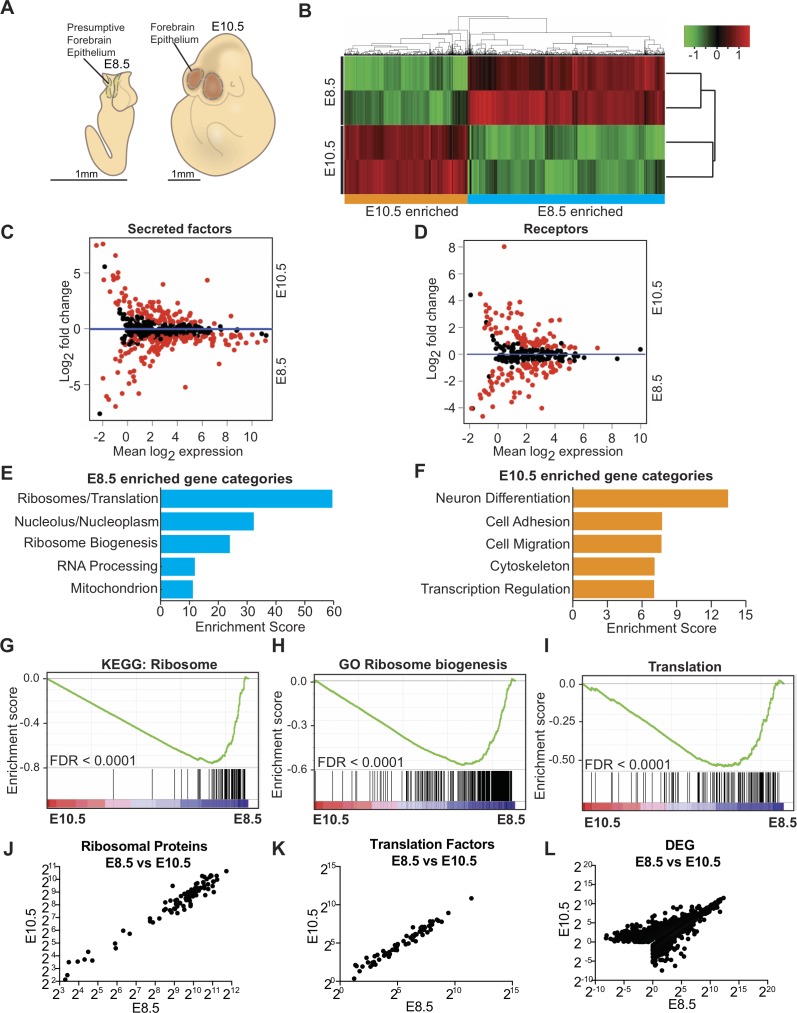
Figure 1. Transcriptome analysis of microdissected forebrain epithelium reveals downregulation of genes encoding protein biosynthetic machinery.
(A) Schematic of E8.5 embryo with open forebrain neural tube (left) and E10.5 embryo (right). Shaded regions encircled by dotted line denote developing forebrain epithelium microdissected for RNAseq. (B) Heatmap and hierarchical clustering of ~3900 differentially expressed genes (q < 0.05): 2375 genes were enriched in E8.5 and 1523 genes were enriched in E10.5. Each biological replicate contained tissue pooled from one litter of embryos. Red and green indicate relatively higher and lower expression, with gene FPKM values log2 transformed, centered and scaled by rows for display purposes. (C, D) MA plot displaying genes encoding secreted factors (C), and receptors (D). Each dot represents a single gene. Red dots denote differentially expressed genes as identified by Cuffdiff (q < 0.05). Genes below blue line (y = 0) are enriched in E8.5. (E) Functional annotation clustering of E8.5 neuroepithelium enriched genes revealed overrepresentation of genes encoding ribosomal proteins, ribosome biogenesis and translation factors. The top five enriched functional clusters are shown. (F) Functional annotation clustering of E10.5 neuroepithelium enriched genes shows overrepresentation of genes needed for neuron differentiation. The top five enriched functional clusters are shown. (G–I) GSEA of E8.5 versus E10.5 neuroepithelium for gene sets involved in ribosome biogenesis and translation. Broad Institute Molecular Signatures Database Identifiers: KEGG_RIBOSOME (G), GO_RIBOSOME_BIOGENESIS (H), and TRANSLATION (I). Each line represents a single gene in the gene set. Genes on the right side are enriched in E8.5. (J–L) Correlation plots of average expression (log2 transformed FPKM) at E8.5 and E10.5 for ribosomal proteins (J), translation factors (K), and all differentially expressed genes (L). In all cases correlation was significant; ribosomal proteins (J), Spearman R = 0.91, p<0.0001; translation factors (K) Spearman R = 0.98, p<0.0001; and DEG (L), Spearman R = 0.82, p<0.0001.
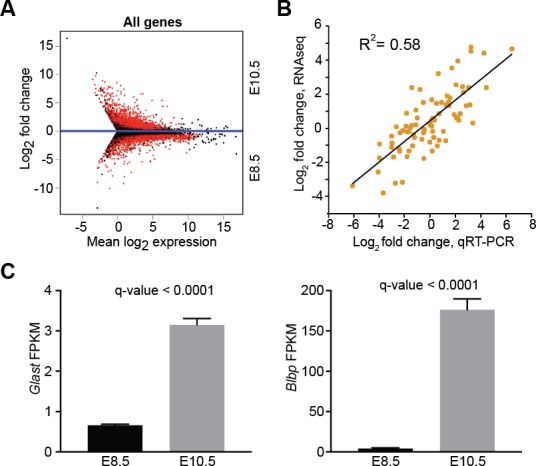
Figure 1—figure supplement 1. Differential gene expression between E8.5 and E10.5 neuroepithelium.


