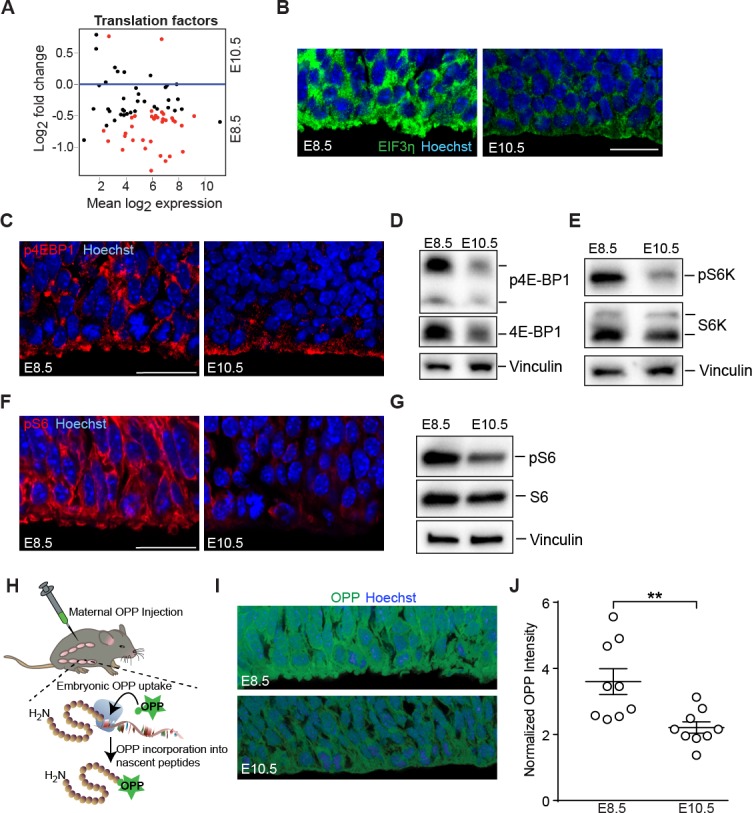
Figure 3. Downregulation of mTOR signaling pathway and decreased protein synthesis in E10.5 forebrain progenitors.

(A) MA plot displaying genes encoding translation factors. Each dot represents a single gene. Red dots denote differentially expressed genes as identified by Cuffdiff (q<0.05). Genes below blue line (y = 0) are enriched in E8.5. (B) Immunostaining of developing forebrain progenitors shows higher expression of the translation initiation factor EIF3η (green) in E8.5 versus E10.5 neuroepithelium. Scale bar = 20 μm. (C) Immunostaining of developing forebrain neuroepithelium shows decreased phosphorylation of 4E-BP1 (red) in E10.5 neuroepithelium. Scale bar 20 μm. (D) Immunoblotting shows decreased expression and phosphorylation of 4E-BP1 at E10.5. (E) Immunoblotting shows decreased phosphorylation of S6K at E10.5. (F) Immunostaining of developing forebrain neuroepithelium shows decreased phosphorylation of ribosomal protein S6 (red) in E10.5 neuroepithelium. Scale bar 20 μm. (G) Immunoblotting shows decreased phosphorylation of ribosomal protein S6 at E10.5. (H) Schematic of OPP injection into pregnant dams and incorporation into translating polypeptides in the embryos. (I) OPP incorporation assay in E8.5 and E10.5 developing forebrain neuroepithelium. (J) Quantification of OPP fluorescence intensity using Image J shows decreased rate of protein synthesis at E10.5. **p≤0.01 Welch’s t-test. For each age, n = 9 embryos from three litters.
