

Abstract
Objective
We offer a strategy for quantifying the impact of mortality and attrition on inferences from later-life health trajectory models.
Methods
Using latent class growth analysis (LCGA) we identify functional limitation trajectory classes in the Health and Retirement Study. We compare results from complete case and full information maximum likelihood (FIML) analyses, and demonstrate a method for producing upper- and lower-bound estimates of the impact of attrition on results.
Results
LCGA inferences vary substantially depending on the handling of missing data. For older adults who die during the follow up period, the widely-used FIML approach may underestimate functional limitations by up to 20%.
Discussion
The most commonly used approaches to handling missing data likely underestimate the extent of poor health in aging populations. Although there is no single solution for nonrandom missingness, we show that bounding estimates can help analysts to better characterize patterns of health in later life.
Keywords: latent class growth analysis, longitudinal analysis, mortality and attrition bias
Introduction
Mortality and other forms of non-random missingness present a major challenge for research on aging and health. As older adults’ health declines, they may be less able or willing to answer survey questions, and as follow-up time increases, so does the risk of death. Respondents who do remain in a study are likely to be positively selected based on their health, while those who drop out are more likely to be disadvantaged in terms of both health and socioeconomic and behavioral characteristics known to be associated with health. These dynamics, along with the complexity of health at older ages, have led researchers to favor longitudinal models that can reflect diverse patterns of health.
Latent class growth analysis (LCGA) is a popular strategy for highlighting heterogeneity in patterns of age-related change by dividing a population into multiple subgroups, each following a distinctive trajectory (Muthén & Muthén, 2000; Nagin, 2005). Gerontological research has employed LCGA to characterize trajectories of multidimensional health, functional impairments, cognition, and multi-morbidities in later life (Lyu & Burr, 2016); (Gill, Gahbauer, Han, & Allore, 2010; Liang, Xu, Bennett, Ye, & Quiñones, 2010); Wickrama, Mancini, Kwag, & Kwon, 2012); Xu, Liang, Bennett, Botoseneanu, & Allore, 2015). Researchers in the field of aging and health have also argued that LCGA can be more efficient in retaining information about respondents and handling problems of missing data across study waves (Palmer & Royall, 2010). Although the statistical literature has noted that LCGA and related longitudinal techniques have some limitations (Tofighi & Enders, 2008; Warren, Luo, Halpern-Manners, Raymo, & Palloni, 2015), applied research using LCGA and related approaches often neglects to adequately address the impact of attrition and mortality on estimated population health trajectories. More specifically, standard estimating procedures often used in gerontological research likely underestimate the progression and severity of health problems among older adults. While this paper uses LCGA as a running example, the missing data challenges we highlight apply to other widely-used longitudinal models such as growth mixture, random effects, and latent trajectory models.
Background
Overview of latent class growth analysis (LCGA)
Growth mixture modeling (GMM) and latent class growth analysis (LCGA) are powerful extensions of standard growth models which can capture heterogeneity in population trajectories. A standard growth model is a multilevel random effects model which assumes a single mean growth curve for the total population and that individuals trajectories can be captured as person-level deviations from the population growth curve (Muthén, 2004; Raudenbush & Bryk, 2002). GMM extends the standard growth model by allowing estimation of multiple, subpopulation- (or “class”-) specific mean growth curves while also allowing for person-level variation from the trajectory of his/her class (Muthén, 2004). LCGA is a special case of GMM which constrains the within class variance and covariance estimates to zero (Jung & Wickrama, 2008).
GMM and LCGA models have the advantages of explicitly modeling heterogeneity in a population by generating separate latent growth curve classes for previously unobserved subpopulations and classifying individuals into particular latent classes (Nagin, 1999). However, GMM and LCGA are not without limitations. It can be difficult to determine the preferred number of latent classes particularly when modeling the outcome as a non-normal distribution (Bauer & Curran, 2003). LCGA can also sometimes have poor predictive validity; an individual’s assigned latent class does not match their observed trajectory (Warren et al., 2015). Finally, although strategies for handling non-random missing data have been proposed (Enders, 2011), standard LCGA estimation is not suited to generate unbiased estimates when data is missing not at random.
When missingness is truly not random
Statistical analyses, including LCGA, often assume that data missingness is completely random, or at least, random after accounting for observed factors. Under the assumptions of missing completely at random (MCAR), missing data is independent of other variables while the missing at random (MAR) approach to handling missing data assumes that patterns of missingness are random after conditioning on observed factors (Rubin, 1976). In both cases, missingness is ignorable under an appropriate analysis, and the process leading to missing data need not be modelled for statistical inferences to be correct. In longitudinal analysis, the MAR assumption is often required to generate valid statistical inferences (Rubin & Little, 2002).
In longitudinal studies tracking changes in older adult health, sample attrition is often non-random and directly related to unobserved changes in health, a clear violation of MAR assumptions (Kapteyn, Michaud, Smith, & Van Soest, 2006). Given the high rates of morbidity and mortality in later life, respondents may be less able or willing to participate in surveys if and when their health declines, and they may die prior to experiencing or reporting health changes (Kapteyn et al., 2006). As follow-up time increases, so does the impact of mortality selection. Respondents who remain in the survey after several waves of data collection are likely to be healthier and less likely to report serious morbidity and impairment precisely because they are positively selected based on their health as well as on education, wealth, and a variety of social and behavioral characteristics known to be associated with health.
Prior research suggests that the powerful impact of mortality selection on the composition of aging cohorts can lead to potentially misleading findings about older adults’ health. For example, cohort mortality rates may appear to plateau or decelerate and subpopulation mortality disparities may be eliminated or reversed with age because of differential dropout and mortality that disproportionately removes frail and unhealthy individuals from observation (Vaupel & Yashin, 1985; Wrigley-Field, 2014). The documented increase of later-life mortality variability in high longevity populations may further reflect increased heterogeneity in the health of survivors to older ages (Engelman, Canudas‐Romo, & Agree, 2010). These phenomena underscore the contribution of longitudinal models, like LCGA, that can distinguish subgroups of the population with fundamentally different underlying trajectories of health. However, failing to account for the decidedly non-random nature of missing data may introduce considerable bias into the estimation of longitudinal health trajectories and underestimate the progression and severity of health problems (Lynch, 2003).
Approaches to handling missing data
The possible bias related to non-random dropout has long been acknowledged in the statistical literature. However, there is a disconnect between methodological recommendations and the application of this guidance in longitudinal studies of health and aging.
First, some applied studies restrict their sample to cases that have no missing data during the time frame covered by the analysis or to cases that contribute a certain number of observations to the analysis (e.g. Downie et al., 2016; Galatzer-Levy & Bonanno, 2012; Liang, Xu, Quiñones, Bennett, & Ye, 2011). Although not described as such, this strategy of dropping observations with insufficient data is a variation on complete case analysis, an approach assuming that cases are missing completely at random. However, complete case analysis necessarily restricts samples to individuals who survive the period of observation and are healthy enough to remain in the study protocols. By definition, then, the sample is selected for survival, and analysis neglects the prior experiences of those who die or leave the study.
Because dropping cases with missing data can introduce bias and sacrifice efficiency, full information maximum likelihood (FIML) is a popular strategy used by studies that model health trajectories of middle and older age adults (Downie et al., 2016; Galatzer-Levy & Bonanno, 2012; Holla et al., 2013; Lyu & Burr, 2016).1 The often-cited advantages of FIML are that the method keeps cases in the sample until the time of dropout and assigns all cases to a latent class. However, FIML has only been shown to be unbiased when data is missing at random (Enders & Bandalos, 2001; Laird, 1988). In studies of older adults, health selection often violates the missing at random assumption. If subjects who drop out go on to experience declining health, FIML will not capture these changes and results may misrepresent the population’s health trajectories.
Some longitudinal studies of older adult health have recognized the limitations of FIML and include as a sensitivity check using a method designed to handle data missing not at random. Pattern mixture modeling is one example: it estimates separate trajectories by patterns of missing data and weights these trajectories to produce population average trends (Bishop, Eggum-Wilkens, Haas, & Kronenfeld, 2016). Unfortunately, the resulting inferences are highly sensitive to chosen model constraints and assumptions about inestimable parameters (Enders, 2011). Another strategy often used in applied studies (see (Liang et al., 2010; Xu et al., 2015; Botoseneanu & Liang, 2013) is covariate-based attrition modeling. This approach allows an indicator denoting attrition to influence latent class membership, intercepts, and slopes, thus parametrically capturing trajectory differences between cases who dropout versus those who remain in sample (Hedeker & Gibbons, 2006). Covariate-based attrition modeling relies on the assumption that time of dropout does not affect latent trajectories and all missing data have the same covariance structure. It also has an important substantive limitation: models which include attrition or mortality reverse the appropriate causal ordering by conditioning on subject dropout and/or mortality — the outcomes latent trajectory models might otherwise be used to predict.
Because of the limitations of each method, statistical literature has suggested comparing inferences across MNAR methods and cautioned that no single strategy can completely handle bias related to non-random missingness. In a review of methods for working with data likely missing not at random, Enders (2011) suggest that methods of handling non-random missing data share a common limitation; they “…rely heavily on untestable assumptions (e.g., normally distributed latent variables), and even relatively minor violations of these assumptions can introduce substantial bias.” (p.1) Furthermore, no general recommendations exist about when to use these approaches and which technique is most likely to reduce bias (Allison, 2001; Demirtas & Schafer, 2003; Schafer, 2003). Although existing methods of handling MNAR data have limitations, this study demonstrates why gerontological research should consider how MNAR data may affect estimates from LCGA models.
Sensitivity analyses, in which one seeks to determine the magnitude of non-randomness needed to materially alter findings in an analysis, provide an alternative strategy for addressing MNAR (Greenland, 1996; Robins, Rotnitzky, & Scharfstein, 2000). Following existing studies which use a combination of real data and simulation to evaluate the performance of LCGA models (Warren et al., 2015), we estimate LCGAs of functional limitation trajectories in a large sample of older adults and use sensitivity analysis to examine how much inferences would change if, following drop-out, individuals made a full recovery or experience a complete health decline.2 Expanding beyond existing approaches for handling non-random missing data, we explore the degree to which model inferences may change under violations of missing at random assumptions, and offer explicit bounds for the bias introduced by mortality and other forms of selective attrition. We finally offer recommendations/strategies to better address the challenges posed by mortality and other forms of selective attrition central challenge in longitudinal studies of health.
Methods
Data
This study uses longitudinal data from waves 2-10 of the Health and Retirement Study (HRS), collected in 1992–2010. Further sample details are available at http://hrsonline.isr.umich.edu/data/index.html. The HRS is nationally representative and has extensive, repeated measures of later life health and information on mortality, rendering it an ideal resource for trajectory analysis. Our study sample comprises 9,914 members of the Health and Retirement Study cohort who were born between 1931 and 1941.3 Although the overall response rate for each of the follow-up waves is higher than 80%, there is still a substantial loss of 40% of the baseline sample over the duration of the study.
Measures
Our LCGA analysis models the accumulation of functional limitations, a stage in the disablement process that precedes the development of limitations in activities of daily living (Verbrugge & Jette, 1994). Functional limitations are measured using the sum of three scales:
Mobility
Reported difficulty with: walking several blocks, walking one block, walking across the room, climbing several flights of stairs and climbing one flight of stairs.
Large muscle functioning
Reported difficulty with: sitting for two hours, getting up from a chair, stooping or kneeling or crouching, and pushing or pulling a large object.
Fine Motor Skills
Reported difficulty with: picking up a dime, eating, and dressing. All items are scored so a value of 0 indicates no difficulty and 1 indicates difficulty. The functional limitations measure ranges from 0 (no limitations) to 12 (most limited). Because they represent different aspects of impaired health, in sensitivity and descriptive analyses we also examine associations between attrition and health outcomes including diagnosed chronic conditions and limitations in activities of daily living. However, our analysis primarily focuses on the sum of functional limitations because of its theoretical importance as well as statistical properties that make it well suited for the LCGA approach; the sum of functional limitations is well distributed across categories and cannot be readily simplified into a categorical measure. We consequently treat it as a continuous measure.
We also consider participants’ dropout and mortality status. Dropout cases are those who report functional limitations in at least one survey round but are not followed through wave 10 of the HRS. Participants’ mortality status and approximate date of death is ascertained via linkage to the National Death Index.
Statistical Analysis
Our statistical analysis consists of multiple steps. First, we examine whether the data suggest that attrition from the survey is completely random or not,. We compare the HRS sample retained across survey rounds with individuals who drop out of the study along several key characteristics, distinguishing cases lost to mortality from those who drop out for other reasons. If data were missing completely at random, we would expect few differences across subsamples, but this is not what we find.
Next, we examine the extent to which non-random attrition may be a source of bias for inference from health trajectory models. We estimate latent class growth curves and compare inferences from a sample containing only cases with complete follow up histories and from the sample containing all cases who provide information in at least one wave. The latter LCGAs are estimated via full information maximum likelihood (FIML).
We then examine whether a common practice for handling non-randomly missing data – covariate based adjustment for attrition – indeed sufficiently addresses the bias related to dropout and attrition. To do so, we estimate two growth mixture models that account for attrition and mortality as predictors of class membership and class intercept and slope. The first model adjusts for dropout without distinguishing between dropouts who die and those who survive the follow up period. The second model has two covariates, one identifying dropouts who die during the survey follow up period, and a second covariate identifying those who survive the follow up period.
We assess the comparability of results across these estimation strategies using several indicators. First, we compare the recommended number and shape of LCGAs across the complete case and full sample FIML estimation. Next, we compare the mean number of limitations at the first and final survey waves estimated under the complete case, standard FIML, and FIML with both types of dropout adjustment, and calculate the average differences in the expected number of limitations across strategies.4 We also examine the variance around these means. This numerical comparison distills the LCGA results to simple indicators that can be compared even if the recommended number of latent classes differ across sample specifications. This approach quantifies how much, on average, inferences about health would change across methods of handling missing data.
We also investigate potential health selection bias by comparing the reported and model-predicted functional limitations at baseline and at the last observed round for: respondents who remained in the sample, respondents who dropped out but did not die, and respondents who dropped out and died during survey follow-up. In the absence of health selection bias, we would expect that the model should fit equally well for all groups across time. However, if health selection is operating, we might expect that models will underestimate the limitations of respondents who drop out and later die – particularly at the last observed round if health declines precipitate the dropout.
In the next stage of analysis, we characterize the bias potentially caused by the non-random drop-out via several sensitivity analyses designed to provide upper and lower bounds for the range of possible health trajectories. First, we assume we have no information about the mortality status of respondents after they leave the sample and estimate LCGA trajectories under two hypothetical scenarios: in one, all respondents who are lost to follow up are assumed to experience a complete recovery, and are thus assigned no functional limitations after their last observed survey round. In the second simulated scenario, the same respondents are assumed to experience the poorest health state, and are assigned the maximum (12) number of limitations for all waves between their last observed round and the end of follow up.5
In a subsequent analysis, we estimate LCGA trajectories using a strategy that explicitly incorporates information about mortality and its impact on population composition. We assign respondents who died before the end of survey to have, with random noise, functional limitations one standard deviation above the time-specific sample mean for all rounds between when they exit the survey and die.6 Drop-outs who survive the follow-up period are assumed to be missing at random between the time left the survey and the end of follow up. We compare these results with those obtained from the full sample FIML estimation via the same indicators listed and described above.
In all trajectory analyses, we compare models with 2-6 latent classes and linear as well as polynomial functions of time. The final number of latent classes (visualized via the number and shape of trajectories) for each analysis is chosen based on an examination of overall and component fit statistics. Following suggested practice, we chose the best-fitting model based on properties including having the smallest Sample Adjusted Bayesian information criterion (SABIC) value combined with a significant Lo, Mendell, and Rubin likelihood ratio test (Jung & Wickrama, 2008; Tofighi & Enders, 2008). The results described below refer to the best-fitting models for each set of analyses; SABIC and BIC values are available upon request. All analyses are performed using Mplus software (version 7).
Results
Members of the HRS cohort who remained in the study through survey wave 10 differ from those who dropped out of the study in a variety of characteristics, including their demographic composition, educational attainment, and health and lifestyle factors (Table 1), underscoring the likely non-random nature of attrition in the study population. Drop-outs were more likely to be non-white, male, less-educated, not married at baseline, and ever smokers. At the baseline survey round, they had more chronic conditions, more functional limitations, and more limitations in activities of daily living than individuals who remained in the sample (Column 2). While much of the difference between the complete case and drop-out samples is driven by those who died prior to the end of data collection, drop-outs who survived the follow up period also had more chronic diseases and limitations in activities of daily living at baseline compared to the complete case sample (Columns 3 and 4).
Table 1.
Descriptive Statistics for the Health and Retirement Study Cohort (N=9914)
| (1) | (2) | (3) | (4) | |
|---|---|---|---|---|
|
| ||||
| Variables | Complete Case Sample | All Dropouts | Dropouts Alive at End of Survey Follow up | Dropouts Died Before End of Survey Follow up |
| N=5959 | N=3955 | N= 1807 | N=2148 | |
| Demographic Characteristics | ||||
| White | 0.81 | 0.76*** | 0.78* | 0.74*** |
| Black | 0.16 | 0.20*** | 0.17 | 0.22*** |
| Hispanic | 0.09 | 0.10 | 0.11 | 0.09 |
| Male | 0.44 | 0.52*** | 0.47** | 0.55*** |
| Age | 55.57 | 56.07*** | 55.67 | 56.41*** |
| Education | ||||
| Less than HS Diploma | 0.28 | 0.37*** | 0.31* | 0.42*** |
| Completed HS | 0.33 | 0.31* | 0.34 | 0.29*** |
| Some College | 0.20 | 0.18** | 0.19 | 0.17** |
| Completed College Degree | 0.19 | 0.14*** | 0.17* | 0.13*** |
| Life Style Factors | ||||
| Ever Smoked by Baseline | 0.59 | 0.69*** | 0.60 | 0.77*** |
| Married at Baseline | 0.76 | 0.70*** | 0.75 | 0.67*** |
| Health Measures at Baseline: Sum of | ||||
| Diagnosed Chronic Conditions at Baseline | 0.88 | 1.30*** | 0.95** | 1.60*** |
| Functional Limitations at First Round Collected (Round 2) | 1.57 | 2.32*** | 1.61 | 2.90*** |
| Limitations in ADLs at First Round Collected (Round 2) | 0.09 | 0.22*** | 0.11* | 0.31*** |
p<.05
p<.01
p<.001 in two-tailed t-test comparing group to complete case sample. Supplemental chi squared tests yield similar findings.
Sample Eligibility: HRS Cohort Members Born Between 1931–1941
N reported represents total sample size. Sample size for some items may be smaller due to item-missingness. Proportions in race/ethnicity categories do not sum to 1 because a small subsample reported their race as other and some Hispanic respondents reported their race as white or black.
The trajectories of functional limitation produced by the LCGA using the complete case versus full sample vary substantially, underscoring influential impact of selective attrition in the HRS cohort (Figure 1). In the complete case analysis, three latent classes are recommended: a healthy class with few limitations at baseline and a steady progression of functional limitations, an intermediate class characterized by approximately four limitations at baseline and steadily increasing functional limitations, and an unhealthy class with about seven limitations at baseline and relatively stable levels of limitation across time. In the FIML analysis, where dropouts are included for the duration of their participation in the survey, four latent trajectory classes are recommended. Three of these classes appear relatively similar to those recommended by the complete case analysis; but the fourth trajectory is distinctive, with few limitations at baseline, a steep accumulation of limitations early on, and some evidence of later decline in limitations. The difference in the preferred number of classes suggests that drop-out cases included in the FIML sample may have had substantially different health trajectories from their contemporaries who remained in the sample.7
Figure 1. Estimated Trajectories of Functional Limitation in Complete Case and FIML Analyses.
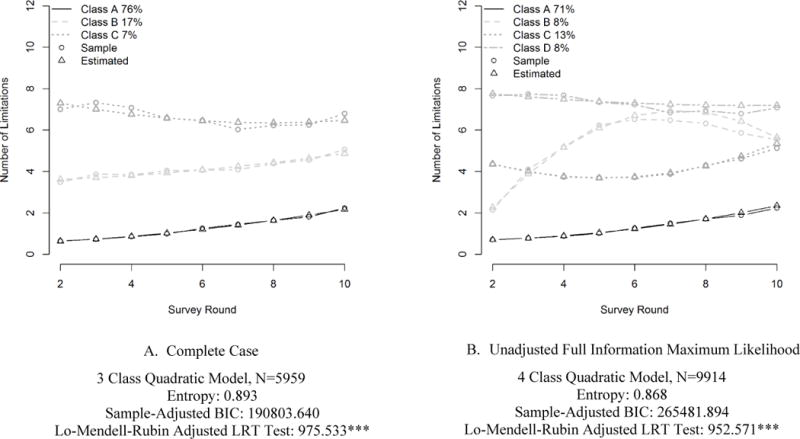
* p<.05 **p<.01 ***p<.001
Table 2 strengthens this inference by showing that the number of estimated limitations differs across the unadjusted FIML and complete case samples. At baseline, the full sample was predicted to have 1.86 limitations in the unadjusted FIML model compared with 1.59 limitations among the complete case sample. By the final survey round, the gap widened, with the unadjusted FIML predicted to have 3.36 limitations while the complete case sample had 2.92 limitations.8
Table 2.
Expected Number of Limitations Across Complete Case (N=5959) and Full Sample (N=9914) FIML Analyses
| (1) | (2) | |
|---|---|---|
| Complete Case Estimation | Full Sample Estimation— | |
| FIML As Observed | ||
| Round 2 | ||
| Mean Predicted Limitations | 1.59 (1.89) | 1.86 (2.15) |
| Skewness | 1.96 | 1.78 |
| Round 6 | ||
| Mean Predicted Limitations | 2.04 (1.59) | 2.45 (2.13) |
| Skewness | 1.66 | 1.45 |
| Round 10 | ||
| Mean Predicted Limitations | 2.92 (1.38) | 3.36 (1.68) |
| Skewness | 1.49 | 1.20 |
| Average Across Rounds | ||
| Mean Predicted Limitations | 2.13 (1.61) | 2.52 (1.99) |
| Skewness | 1.69 | 1.40 |
Estimates are based on predicted values from LCGA estimates under two common sets of assumptions. When estimated with the full sample, the complete case sample is estimated to have, on average, 1.6 limitations at survey round 2 and 3.13 limitations at Round 10.
Next, we show how the predicted number of functional limitations from LCGA models compares with limitations reported by the HRS cohort. Table 3 compares the mean number of observed limitations with those predicted by three modeling strategies. Columns 1 and 2 suggest that even FIML, which shows higher levels of functional limitation than the complete case model, still underestimates the total number of limitations experienced by the sample. The underestimate is driven by the limitations experienced by those who drop out and die. At the last observed round for these individuals, the model predicts 3.56 functional limitations on average, but they reported, on average, 4.58 limitations.
Table 3.
Observed Versus Predicted Number of Functional Limitations (N=9,914)
| (1) Observed |
(2) Unadjusted FIML |
(3) FIML with Dropout Adjustment |
(4) FIML with Dropout and Attrition Adjustment |
||||
|---|---|---|---|---|---|---|---|
| Mean | Mean Predicted Limitations | Percent Difference between Predicted and Observed | Mean Predicted Limitations | Percent Difference between Predicted and Observed | Mean Predicted Limitations | Percent Difference between Predicted and Observed | |
| Round 2 | |||||||
| Complete Case Sample | 1.57 | 1.6 | −2.05% | 1.6 | −1.78% | 1.6 | −1.63% |
| Dropouts Alive at End of Survey Follow up | 1.61 | 1.62 | −1.13% | 1.66 | −3.45% | 1.56 | 2.57% |
| Dropouts Died Before End of Survey Follow up | 2.89 | 2.77 | 4.21% | 2.79 | 3.60% | 2.8 | 3.20% |
| Last Round Observed | |||||||
| Complete Case Sample | 3.04 | 3.13 | −3.03% | 2.96 | 2.72% | 2.96 | 2.80% |
| Dropouts Alive at End of Survey Follow up | 2.11 | 2.23 | −5.70% | 2.3 | −9.13% | 2.04 | 2.97% |
| Dropouts Died Before End of Survey Follow up | 4.58 | 3.56 | 22.29% | 3.64 | 20.38% | 4.27 | 6.78% |
We then show how predicted limitations from covariate based adjustment models compare with limitations reported by the sample in Columns 1, 3, and 4 of Table 3. Results from the first LCGA, which conditioned on dropout status, do not vary substantially from the unadjusted FIML. The LCGA which conditioned on dropout status and mortality, however, does appear to capture more limitation for the subsample who dropped out and died during the follow up period, predicting 4.27 limitations for these individuals compared to the 4.58 limitations actually reported. The estimated differences between the predicted and observed number of limitations would likely be higher if more information about health declines that occurred following dropout were available.
Having established that FIML likely underestimates functional limitation for those believed to have health declines following drop out, we move to a sensitivity analysis which examines the impact of varied post-dropout health trajectories on the shape of estimated functional limitation trajectories (Figure 2). For the unadjusted FIML analysis and both scenarios, a four class model with a quadratic term provides the best fit. However, the shape of these four trajectories differs significantly. In a best-health scenario (Panel B), cases who dropped out are assumed to have no functional limitations following their exit from the survey. The first latent trajectory in this LCGA starts with few functional limitations and these appears to decline over time. The second and third latent classes comprise respondents who had intermediate and high levels of limitation at baseline, with steady increases in limitations over time. A fourth latent class has high limitation at baseline, and sees a rapid increase followed by a steep decline over time. A contrasting scenario (Panel C) assumes that cases who dropped out experienced maximum limitation following survey exit. Under this scenario, one latent class starts with few functional limitations and gains slightly over survey rounds. The second and third classes comprise respondents who had relatively few limitations at baseline, but rapidly accumulated limitations either early or late in the course of the study. Finally, a fourth latent class has high limitations at the onset of the survey and a gradual accumulation of limitation over the course of the survey.
Figure 2. Estimated Trajectories of Functional Limitation Under FIML and Extreme Value Scenarios.
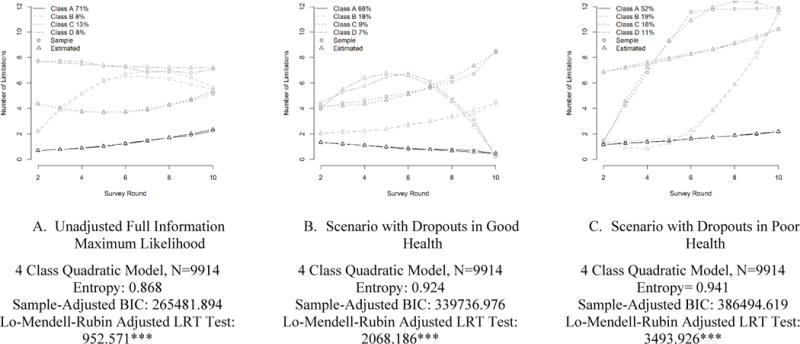
* p<.05 **p<.01 ***p<.001
The expected number of limitations under each model is also quite different (Table 4). The predicted number of limitations at baseline (round 2) is similar (approximately 1.9) across the observed and simulated samples. However, by the 10th round, there is divergence, with the observed sample averaging 3.36 limitations, the recovery scenario predicting an average of 1.84 limitations, and the health decline scenario predicting an average of 6.53 limitations at the end of follow up. The distribution of limitations also differs across scenarios. While the positively skew diminishes over time in all scenarios, by the final survey round, the skew is greatest for the recovery simulation and smallest in the poor health scenario.
Table 4.
Expected Number of Limitations for Full Sample FIML Analysis and Sensitivity Scenarios (N=9914)
| (1) | (2) | (3) | (4) | |
|---|---|---|---|---|
| Full Sample Estimation –Unadjusted FIML | Scenario with– Dropouts in Good Health | Scenario with– Dropouts in Poor Health | Scenario with– Dropouts who Die in Poor Health | |
| Round 2 | ||||
| Mean Predicted Limitations | 1.86 (2.15) | 1.88 (0.98) | 1.86 (1.72) | 1.88 (1.94) |
| Skewness | 1.78 | 1.71 | 2.56 | 2.04 |
| Round 6 | ||||
| Mean Predicted Limitations | 2.45 (2.13) | 1.91 (1.75) | 4.09 (3.73) | 2.73 (2.30) |
| Skewness | 1.45 | 1.59 | 1.05 | 1.02 |
| Round 10 | ||||
| Mean Predicted Limitations | 3.36 (1.68) | 1.84 (2.49) | 6.53 (4.57) | 4.09 (2.94) |
| Skewness | 1.20 | 1.61 | 0.11 | 0.46 |
| Average Across Rounds | ||||
| Mean Predicted Limitations | 2.52 (1.99) | 1.89 (1.59) | 4.14 (3.09) | 2.84 (2.18) |
| Skewness | 1.40 | 1.32 | 0.73 | (0.89) |
|
Absolute Difference Between FIML and Simulation in Predicted Limitations Across Rounds | ||||
| Mean | – | 1.57 (1.35) | 2.33 (2.43) | 1.05 (1.24) |
| Median | – | 0.75 | 1.29 | 0.23 |
| 90th Percentile | – | 3.31 | 7.73 | 2.96 |
| Skewness | – | 2.02 | 1.14 | 1.48 |
Standard deviation in parentheses
Estimates are based on predicted values from LCGA estimates.
These two simulated scenarios represent the extreme bounds of functional limitation trajectories in situations where there is no additional information about respondents who drop out. However, if additional information on respondents is available (e.g. via administrative linkages or a post-drop-out questionnaire), a more moderate boundary may be appropriate. Specifically, for dropouts who died before the end of the survey follow-up period, we assign, with random noise, functional limitations to be one standard deviation above the time specific sample mean up until the time of death; for dropouts who survived the observation period, we allow the data to be missing at random. This assumption may be a reasonable approximation given descriptive statistics (Table 1) that highlight significant differences in health between the complete case sample and the two types of respondents with missing data. Figure 3 compares estimates from the original FIML estimation with the more moderate scenario. Again, four latent classes are recommended under this scenario. While they are generally similar to the classes recommended by the FIML, the two middle classes are notable for beginning at a level similar to that of the lowest limitation class and ending at the same level as the highest limitation class, but differing in whether trajectories increase early or later during the follow up period. Under this moderate scenario, the expected number of limitations (4.09 by round 10, and 2.84 across all rounds) falls between the FIML and worst-health case scenarios (table 4, column 4).
Figure 3. Estimated Trajectories of Functional Limitation Under FIML and Moderate Scenario.
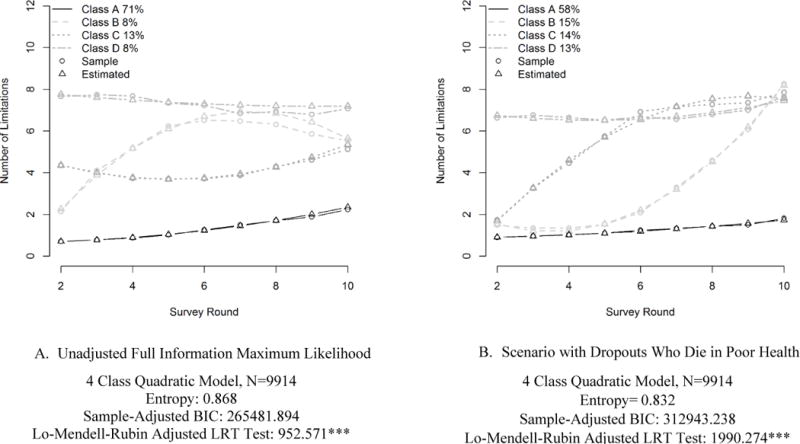
* p<.05 **p<.01 ***p<.001
Discussion
Our analyses suggest results from LCGAs are subject to bias from health-related attrition and may consequently underestimate the prevalence, progression, and severity of health problems. Prior research has suggested that latent trajectory models may, in some instances, have poor predictive validity and the number of recommended classes may vary by sample size (Tofighi & Enders, 2008; Warren et al., 2015). With a few exceptions (Lynch, 2015; Wolf, Freedman, Ondrich, Seplaki, & Spillman, 2015; Zimmer, Martin, Nagin, & Jones, 2012), the question of selective attrition has received less attention, despite the fact that nonrandom mortality and drop out have important implications for inferences from latent-class analyses in longitudinal studies of older adults’ health. This paper has focused on inferences from LCGAs, but the problem of dropout related to the dependent variable arises in other forms of longitudinal analysis (e.g. hierarchical linear modeling and more general latent growth curves) that do not account for the competing risks of dropout and mortality.
Using the HRS as a case study, we show that conclusions about the number and shape of latent classes and predicted functional limitations vary across approaches to handling missing data. Under complete case analysis only three latent classes are recommended, but in the FIML and simulation analyses, four latent classes are suggested. Beyond affecting the number of latent classes preferred, the method of handling missing data influenced the predicted number of functional limitations for the sample. We found that standard FIML estimation substantially underestimates the functional limitations for the subsample most likely to experience health declines, those who die in the course of follow up. The overall expected number of functional limitations is also affected by assumptions about the health of dropouts. By the 10th survey round, the predicted number of limitations ranged from under two to over six depending on assumptions built into the sensitivity analyses. Inferences can thus vary substantially depending on the handling of missing data. Common approaches like restricting samples to individuals who responded to a pre-determined number of survey rounds or employing FIML tend to under-estimates poor health trajectories among older adults, yielding a biased portrait of health decline patterns in later life. Furthermore, when examining latent classes under an FIML framework, one might conclude that some members of the sample experience a rapid increase in limitations before leveling out or even making a health recovery. However, a recovery pattern is not observed in the complete case analysis, raising questions about whether the recovery class is an artifact of the FIML model’s handling of dropouts. Conversely, failure to detect a class with rapidly increasing limitations in the complete case analysis may reflect the exclusion of such individuals from the sample. We thus urge caution in the interpretation of any specific trajectory. Researchers should keep in mind that the recommended number of latent classes is sensitive to the handling of missing data, and respondents with missing data may be more likely to be misclassified into a particular latent class. Rather than relying on optimal fit statistics, researchers should weigh the strength of evidence across models and approaches.
Our analysis yields several cautionary conclusions for researchers employing LCGAs and related methods. First, restricting the analysis to cases who contribute to a defined number of waves potentially biases the number and shape of estimated trajectory classes. Second, FIML does not produce unbiased estimates when data is likely missing not at random (MNAR).9 Third, covariate-based attrition adjustment – a common method of handling MNAR data in gerontological research – still underestimates the functional limitations experienced by the subsample that dropped out and died during the follow up period. More generally, it is not possible to determine if methods of handling MNAR data are introducing bias into estimated trajectories, because the data to adjudicate this determination are not observed. Finally, because respondent characteristics such as race, gender, and baseline health are associated with the likelihood of leaving the sample, LCGA models may be especially prone to mischaracterize the health trajectories of vulnerable subgroups, and future research should explore this issue in greater detail.
Our findings point to several recommendations for future studies of health trajectories. First, assessing rates of attrition is crucial, and documenting mortality is extremely useful for diagnosing potential deviations from assumptions of random missingness. Our analysis found that mortality was key for identifying cases which had data likely MNAR. Second, when a substantial amount of data is believed to be MNAR, we recommend caution when interpreting the shape of latent trajectories, as they may be heavily influenced by the unobserved outcomes of dropout cases and the potential misclassification of dropout cases into particular latent classes. Third, when dropout rates are substantial, we recommend using sensitivity analysis (Enders, 2011) as demonstrated in this paper, to provide quantitative bounds for the magnitude of potential bias.10 When developing appropriate scenarios for such sensitivity analyses, it may be helpful to consider both the mechanisms associated with non-randomly missing data and how the health outcomes being analyzed may change following attrition. The extreme value scenarios may be of interest and use to researchers because they offer bounds on the potential impact of the missingness problem: although our study found that the handling of cases lost to follow-up significantly affected the results, other studies may find that even extreme handling of missing data does not substantially affect conclusions, obviating the need for more detailed sensitivity analyses.
To be sure, there is no strategy that can “solve” the problem of bias related to non-random missing data because outcomes following drop out are simply not observed. However, sensitivity analysis offers an effective and accessible strategy for quantifying how much health declines may be under-estimated when using the FIML approach. Implementing these recommendations will help researchers in gerontology more effectively acknowledge and address the problem of selective attrition.
Acknowledgments
This work was supported by the National Institute on Aging (T32AG000247, NIA P30 AG17266, R24AG045061); and the National Institute of Child Health and Human Development (P2C HD047873).
Footnotes
FIML is commonly used as an alternative to complete case analysis that preserves statistical power. However, in some cases the two approaches are used together: the sample is restricted to respondents who contribute a certain number of observations and FIML is used to manage cases with disparate drop-out times.
The sensitivity analyses described are computationally equivalent to a fixed value imputation or simulation.
The analytic sample size for the complete case analysis is only 5959.
We supplement this analysis by calculating the expected number of functional limitations for the complete case sample using standard and FIML estimation strategies in order to better disentangle how using FIML may affect prediction of limitations for the complete case sample.
This strategy assumes we have no information on mortality. In supplemental analyses, we run a simulation which assigns respondents good/poor health up until the time period they are known to have died. An extension of our approach would be to discard the model predicted health of dropout cases after the time of death.
Of the 2,148 respondents who died during the follow up period, 435 respondents died in the same year as they would have been surveyed. 1713 respondents died after the year they would have been surveyed, and the average time between dropout and death was about one survey round of data (Mean=1.07 survey rounds SD=.63 survey rounds, Median=.97 survey rounds).
The three latent classes look similar across the complete case and full samples. However, while fit statistics consistently recommend a fourth latent class for the full sample, there is insufficient information to recommend a fourth class for the complete case sample, a result that suggests a fourth latent class is fit because of the inclusion of dropout cases. A comparison of fit statistics across models with multiple numbers of classes is available upon request.
The predicted number of limitations for the complete case sample is actually very similar in the complete case and full sample analyses for all survey rounds. Again, this suggests differences are driven by those who left the sample.
In this paper, we present results that use FIML for handling of missing data. Past research suggests that for other types of longitudinal models, FIML and multiple imputation (MI) would yield similar results (Enders & Bandalos, 2001; Newman, 2003), but there is an ongoing debate about the appropriateness of MI in the context of LCGA models. Seminal work on MI (Schafer, 1997; Rubin, 1976) suggests that MI may not be theoretically compatible with the LCGA framework because MI assumes that data are sampled from a single population while LCGA models emphasize the identification of distinct sub-populations, each with potentially different underlying missing data mechanisms. More recent studies, however, suggests that LCGA in fact presents an opportunity for a more complex imputation strategy that can improve the handling of missing data (Gebregziabher & DeSantis, 2010). Implementing such methods and systematically comparing them to existing approaches is a promising avenue for further research.
Our method of using predicted values to estimate bounds could also be applied towards addressing other types of uncertainty in latent variable models. Specifically, if there is ambiguity in the preferred number of latent classes, predicted value estimates could be used to bound estimates across plausible models. The development of methods by which to determine the degree of non-randomness needed to alter findings in the LCGA context would be a useful for further research.
References
- Allison PD. Missing data. Vol. 136. Sage publications; 2001. [Google Scholar]
- Bauer DJ, Curran PJ. Distributional assumptions of growth mixture models: implications for overextraction of latent trajectory classes. Psychological methods. 2003;8(3):338. doi: 10.1037/1082-989X.8.3.338. [DOI] [PubMed] [Google Scholar]
- Bishop NJ, Eggum-Wilkens ND, Haas SA, Kronenfeld JJ. Estimating the Co-Development of Cognitive Decline and Physical Mobility Limitations in Older US Adults. Demography. 2016;53(2):337–364. doi: 10.1007/s13524-016-0458-x. [DOI] [PubMed] [Google Scholar]
- Botoseneanu A, Liang J. Latent heterogeneity in long-term trajectories of body mass index in older adults. Journal of Aging and Health. 2013;25(2):342–363. doi: 10.1177/0898264312468593. [DOI] [PMC free article] [PubMed] [Google Scholar]
- Demirtas H, Schafer JL. On the performance of random‐coefficient pattern‐mixture models for non‐ignorable drop‐out. Statistics in medicine. 2003;22(16):2553–2575. doi: 10.1002/sim.1475. [DOI] [PubMed] [Google Scholar]
- Downie AS, Hancock MJ, Rzewuska M, Williams CM, Lin CWC, Maher CG. Trajectories of acute low back pain: a latent class growth analysis. Pain. 2016;157(1):225–234. doi: 10.1097/j.pain.0000000000000351. [DOI] [PubMed] [Google Scholar]
- Enders CK. Missing not at random models for latent growth curve analyses. Psychological methods. 2011;16(1):1. doi: 10.1037/a0022640. [DOI] [PubMed] [Google Scholar]
- Enders CK, Bandalos DL. The relative performance of full information maximum likelihood estimation for missing data in structural equation models. Structural Equation Modeling. 2001;8(3):430–457. [Google Scholar]
- Engelman M, Canudas-Romo V, Agree EM. The implications of increased survivorship for mortality variation in aging populations. Population and Development Review. 2010;36(3):511–539. doi: 10.1111/j.1728-4457.2010.00344.x. [DOI] [PubMed] [Google Scholar]
- Galatzer-Levy IR, Bonanno GA. Beyond normality in the study of bereavement: Heterogeneity in depression outcomes following loss in older adults. Social science & medicine. 2012;74(12):1987–1994. doi: 10.1016/j.socscimed.2012.02.022. [DOI] [PMC free article] [PubMed] [Google Scholar]
- Gebregziabher M, DeSantis SM. Latent class based multiple imputation approach for missing categorical data. Journal of Statistical Planning and Inference. 2010;140(11):3252–3262. doi: 10.1016/j.jspi.2010.04.020. [DOI] [PMC free article] [PubMed] [Google Scholar]
- Gill TM, Gahbauer EA, Han L, Allore HG. Trajectories of disability in the last year of life. New England Journal of Medicine. 2010;362(13):1173–1180. doi: 10.1056/NEJMoa0909087. [DOI] [PMC free article] [PubMed] [Google Scholar]
- Greenland S. Basic methods for sensitivity analysis of biases. International Journal of Epidemiology. 1996;25(6):1107–1116. [PubMed] [Google Scholar]
- Hedeker D, Gibbons RD. Longitudinal data analysis. Vol. 451. John Wiley & Sons; 2006. [Google Scholar]
- Holla JF, van der Leeden M, Heymans MW, Roorda LD, Bierma-Zeinstra SM, Boers M, Dekker J. Three trajectories of activity limitations in early symptomatic knee osteoarthritis: a 5-year follow-up study. Annals of the rheumatic diseases. 2013:202984. doi: 10.1136/annrheumdis-2012-202984. annrheumdis-2012- [DOI] [PubMed] [Google Scholar]
- Jung T, Wickrama K. An introduction to latent class growth analysis and growth mixture modeling. Social and Personality Psychology Compass. 2008;2(1):302–317. [Google Scholar]
- Kapteyn A, Michaud PC, Smith JP, Van Soest A. Effects of attrition and non-response in the Health and Retirement Study 2006 [Google Scholar]
- Laird NM. Missing data in longitudinal studies. Statistics in medicine. 1988;7(1–2):305–315. doi: 10.1002/sim.4780070131. [DOI] [PubMed] [Google Scholar]
- Liang J, Xu X, Bennett JM, Ye W, Quiñones AR. Ethnicity and changing functional health in middle and late life: A person-centered approach. The Journals of Gerontology Series B: Psychological Sciences and Social Sciences. 2010;65(4):470–481. doi: 10.1093/geronb/gbp114. [DOI] [PMC free article] [PubMed] [Google Scholar]
- Liang J, Xu X, Quiñones AR, Bennett JM, Ye W. Multiple trajectories of depressive symptoms in middle and late life: racial/ethnic variations. Psychology and aging. 2011;26(4):761. doi: 10.1037/a0023945. [DOI] [PMC free article] [PubMed] [Google Scholar]
- Lynch SM. Commentary on “Disability Trajectories at the End of Life: A Countdown Model” The Problems With Time-to-Death as a Predictor of Disability. The Journals of Gerontology Series B: Psychological Sciences and Social Sciences. 2015:gbv001. doi: 10.1093/geronb/gbv001. [DOI] [PMC free article] [PubMed] [Google Scholar]
- Lyu J, Burr JA. Socioeconomic status across the life course and cognitive function among older adults: an examination of the latency, pathways, and accumulation hypotheses. Journal of Aging and Health. 2016;28(1):40–67. doi: 10.1177/0898264315585504. [DOI] [PubMed] [Google Scholar]
- Muthén B. The Sage handbook of quantitative methodology for the social sciences. Thousand Oaks, CA: Sage Publications; 2004. Latent variable analysis; pp. 345–368. [Google Scholar]
- Muthén B, Muthén LK. Integrating person‐centered and variable‐centered analyses: Growth mixture modeling with latent trajectory classes. Alcoholism: Clinical and experimental research. 2000;24(6):882–891. [PubMed] [Google Scholar]
- Nagin D. Group-based modeling of development. Harvard University Press; 2005. [Google Scholar]
- Nagin DS. Analyzing developmental trajectories: A semiparametric, group-based approach. Psychological methods. 1999;4(2):139. doi: 10.1037/1082-989x.6.1.18. [DOI] [PubMed] [Google Scholar]
- Newman DA. Longitudinal modeling with randomly and systematically missing data: A simulation of ad hoc, maximum likelihood, and multiple imputation techniques. Organizational Research Methods. 2003;6(3):328–362. [Google Scholar]
- Palmer RF, Royall DR. Missing data? Plan on it! Journal of the American Geriatrics Society. 2010;58(s2) doi: 10.1111/j.1532-5415.2010.03053.x. [DOI] [PubMed] [Google Scholar]
- Raudenbush SW, Bryk AS. Hierarchical linear models: Applications and data analysis methods. Vol. 1. Sage; 2002. [Google Scholar]
- Robins JM, Rotnitzky A, Scharfstein DO. Statistical models in epidemiology, the environment, and clinical trials. Springer; 2000. Sensitivity analysis for selection bias and unmeasured confounding in missing data and causal inference models; pp. 1–94. [Google Scholar]
- Rubin D. Inference and Missing Data. Biometrika. 1976;63(3):581–590. doi: 10.1093/biomet/63.3.581. [DOI] [Google Scholar]
- Rubin DB, Little RJ. Statistical analysis with missing data. Hoboken, NJ: J Wiley & Sons; 2002. [Google Scholar]
- Schafer JL. Analysis of incomplete multivariate data. CRC press; 1997. [Google Scholar]
- Schafer JL. Multiple imputation in multivariate problems when the imputation and analysis models differ. Statistica Neerlandica. 2003;57(1):19–35. [Google Scholar]
- Tofighi D, Enders CK. Advances in latent variable mixture models. Information Age Publishing, Inc; 2008. Identifying the correct number of classes in growth mixture models; pp. 317–341. [Google Scholar]
- Vaupel JW, Yashin AI. Heterogeneity’s ruses: some surprising effects of selection on population dynamics. The American Statistician. 1985;39(3):176–185. [PubMed] [Google Scholar]
- Verbrugge LM, Jette AM. The disablement process. Social science & medicine. 1994;38(1):1–14. doi: 10.1016/0277-9536(94)90294-1. [DOI] [PubMed] [Google Scholar]
- Warren JR, Luo L, Halpern-Manners A, Raymo JM, Palloni A. Do Different Methods for Modeling Age-Graded Trajectories Yield Consistent and Valid Results? 1. American Journal of Sociology. 2015;120(6):1809–1856. doi: 10.1086/681962. [DOI] [PMC free article] [PubMed] [Google Scholar]
- Wickrama KK, Mancini JA, Kwag K, Kwon J. Heterogeneity in multidimensional health trajectories of late old years and socioeconomic stratification: a latent trajectory class analysis. The Journals of Gerontology Series B: Psychological Sciences and Social Sciences. 2012:gbs111. doi: 10.1093/geronb/gbs111. [DOI] [PubMed] [Google Scholar]
- Wolf DA, Freedman VA, Ondrich JI, Seplaki CL, Spillman BC. Disability trajectories at the end of life: A “countdown” model. The Journals of Gerontology Series B: Psychological Sciences and Social Sciences. 2015:gbu182. doi: 10.1093/geronb/gbu182. [DOI] [PMC free article] [PubMed] [Google Scholar]
- Wrigley-Field E. Mortality deceleration and mortality selection: Three unexpected implications of a simple model. Demography. 2014;51(1):51–71. doi: 10.1007/s13524-013-0256-7. [DOI] [PMC free article] [PubMed] [Google Scholar]
- Xu X, Liang J, Bennett JM, Botoseneanu A, Allore HG. Socioeconomic Stratification and multidimensional health trajectories: Evidence of convergence in later old age. The Journals of Gerontology Series B: Psychological Sciences and Social Sciences. 2015;70(4):661–671. doi: 10.1093/geronb/gbu095. [DOI] [PMC free article] [PubMed] [Google Scholar]
- Zimmer Z, Martin LG, Nagin DS, Jones BL. Modeling disability trajectories and mortality of the oldest-old in China. Demography. 2012;49(1):291–314. doi: 10.1007/s13524-011-0075-7. [DOI] [PubMed] [Google Scholar]