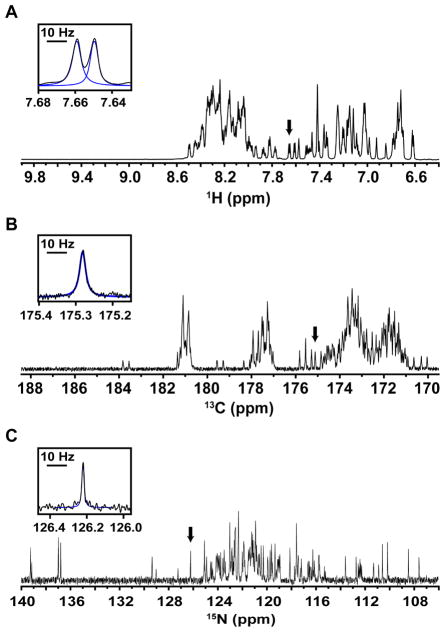
Figure 1.
1D NMR lineshape analysis for 13C/15N Hdm2-ABD. (A) The amide region of a 1D 1H spectrum. (B) The carbonyl region of a 1D 13C spectrum. (C) A 1D 15N spectrum showing amide nitrogen resonances. Insets in each panel provide a detailed view of well resolved resonances, as indicated by the black arrows, along with the fits from global spectral deconvolution (blue; see Methods). The black bar corresponds to a width of 10 Hz. It should be noted that the carbonyl region was chosen here to assess the obtainable resolution of 13C′ direct detection. 13C′ linewidths are influenced by magnetic field strength due to chemical shift anisotropy and should not be used to generally assess all 13C linewidths.

