Abstract
Quadrupolar relaxation of 2H (D) nuclear spins is a powerful probe of conformational dynamics in biological macromolecules. Deuterium relaxation rate constants are determined by the spectral density function for reorientation of the C-D bond vector at zero, single-quantum, and doublequantum 2H frequencies. In the present work, 2H relaxation rate constants were measured for an E. coli ribonuclease H [U-2H, 15N] ILV-[13CH2D] sample using 400, 500, 800, and 900 MHz NMR spectrometers and analyzed by three approaches to determine spectral density values. First, data recorded at each static magnetic field were analyzed independently. Second, data recorded at 400 and 800 MHz were analyzed jointly and data recorded at other fields were analyzed independently. Third, data recorded at 400 and 500 MHz were interpolated to 450 MHz, and the resulting two pairs of data, corresponding to 400 MHz/800 MHz and 450 MHz/900 MHz, were analyzed jointly. The second and third approaches rely on the identity between the double quantum frequency at the lower field and the single quantum frequency at the higher field. Spectral density values for 32 of the 48 resolvable ILV methyl resonances were fit by the Lipari-Szabo model-free formalism and used to validate the three methods. The three spectral density mapping methods performed equally well in cross validation with data recorded at 700 MHz. However, the third method yielded approximately 10–15% more precise estimates of model-free parameters and consequently provides a general strategy for analysis of 2H spin relaxation data in biological macromolecules.
Keywords: protein dynamics, spectral density mapping, deuterium relaxation, ribonuclease H
Graphical abstract
1. Introduction
Intramolecular dynamics of proteins and other biological macromolecules increasingly are recognized as playing important roles in function, including allostery, catalysis, molecular recognition, regulation, and signaling [1–3]. Spin relaxation in NMR spectroscopy is a powerful probe of dynamics and kinetics of biological macromolecules with atomic resolution and over a broad range of time scales [4, 5]. Methods and applications have been reported for 1H, 2H, 13C, and 15N nuclei in proteins and nucleic acids [5, 6]. Deuterium (2H or D) relaxation offers advantages when compared with other nuclei in characterizing the dynamic properties of molecules in solution. First, 2H relaxation is dominated by the quadrupolar mechanism, and contributions from other mechanisms such as chemical shift anisotropy (CSA) and chemical exchange are negligible in comparison. Second, the quadrupolar Hamiltonian is axially symmetric and the principal axis is oriented along the carbon-deuterium bond, which simplifies interpretation of relaxation measurements. In contrast, CSA tensors may be rhombic and have principal axes systems that are rotated relative to convenient reference directions.
Kay and coworkers established methods for measuring relaxation of 2H spins in CH2D methyl group isotopomers in proteins in solution [7, 8]. These methods subsequently were extended to CD, CHD, and CHD2 moieties in proteins [9, 10] and CD and CHD moieties in RNA [11, 12]. The rate constants R1, R1ρ, RQ, RAP, and RDQ describe 2H quadrupolar relaxation of longitudinal magnetization (Dz), transverse magnetization (D+), quadrupolar order (3Dz2 − 2), antiphase coherence (D+Dz + DzD+), and double-quantum coherence (D+2), respectively. At a given static magnetic field strength, the relaxation of the density operator is dependent on the values of the spectral density function, J(ω), at three frequencies: 0, ωD, and 2ωD, in which ωD is the 2H Larmor frequency. Because the five relaxation rate constants measured for the deuterium spin are defined by the spectral density functions of three deuterium frequencies, the spectral density values can be determined if three or more relaxation rate constants are measured. Inversion of the relaxation equations to obtain the values of the spectral density function is called spectral density mapping [13, 14]
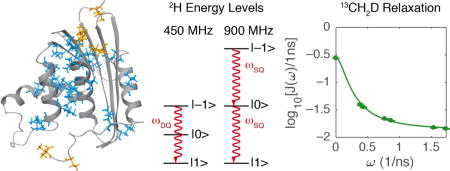
The present work examines three approaches for spectral density mapping when relaxation data have been acquired at more than one static magnetic field strength. In the simplest approach, termed the independent method, each static magnetic field is treated independently [7, 8, 15]. If data sets are obtained using two NMR spectrometers whose static magnetic field differ by a factor of two, then the double-quantum frequency, 2ωD, at the lower field is equal to the single quantum frequency at the higher field [8, 16]. In this case, the relaxation data recorded at the two static magnetic fields can be analyzed simultaneously to obtain J(ω) at frequencies of 0, ωD, 2ωD, 4ωD, in which ωD is the Larmor frequency at the lower static magnetic field. This approach is termed the joint method [8]. To overcome the limited possible pairs of static magnetic fields available with existing NMR spectrometers, we developed a strategy that interpolates the data sets for any two static fields to obtain a third data set that can be paired with a fourth experimental data set. In this paper, we demonstrate this combined field-pairing and interpolated analysis, termed the joint-interpolated method, by obtaining relaxation rate data sets using a 400 MHz/800 MHz spectrometer pair and a 450 MHz/ 900 MHz spectrometer pair and analyzing them globally. In this scenario, the 450 MHz data set was interpolated from data sets originating from the 400 MHz and 500 MHz spectrometer pair. In total, this analysis yields spectral density values at seven frequencies, ω/2π: 0, 61.4, 69.1, 122.8, 138.2, 245.6, and 276.4 MHz with increased statistical degrees of freedom for subsequent model evaluation.
The different approaches for spectral density mapping were tested using relaxation data acquired for the E. coli ribonuclease H (RNase H) U-[2H, 15N] ILV (Ile δ, Ile γ2, Leu δ1, Leu δ2, Val γ1, Val γ2) [13CH2D] sample. RNase H (EC 3.1.26.4) is a conserved endonuclease responsible for cleaving the RNA strand of DNA/RNA hybrids in various biological processes, including reverse transcription of the viral genome in retroviral reverse transcriptases and Okazaki fragment processing during the DNA replication of the lagging strand [17]. RNase H also belongs to a broader superfamily of nucleotidyl-transferases with conserved structure and mechanism, including retroviral integrases, Holliday junction resolvases, and transposases [18, 19]. RNase H has also been the subject of many investigations in folding, structure, and dynamics [20–22].
2. Methods
2.1. Sample Preparation
Isotopically labeled RNase H was produced by transformation of BL21(DE3) with a pAED4 plasmid encoding the E. coli ribonuclease HI gene. Bacterial cultures were grown in M9 minimal media containing 99% 2H2O, 15N-ammonium chloride, and 2H7-glucose to OD600 = 0.7 before induction with 0.5 mM IPTG. Selective 13CH2D group labeling was achieved by supplementing the minimal growth media with 50 mg/mL of 2-ketobutyric acid-4-13C,4-d1(99% 13C, 97% 2H, Isotec, Sigma Aldrich) and 80 mg/mL of 2-keto-3-(methyl-13C,d1)-butyric acid-3,4,4,4-d4 (99% 13C, 98% 2H, Isotec, Sigma Aldrich) an hour before induction [23, 24]. Protein expression was allowed to proceed for 4 hours at 37° C. RNase H was purified as described previously [25–27].
2.2 NMR Spectroscopy
NMR samples contained 500 µM RNase H, 100 mM 2H3-sodium acetate, pH = 5.5, and 99% 2H2O in a 5 mm Shigemi NMR tube. Relaxation experiments were acquired at 9.4 T (400 MHz for 1H spins) on a Varian Inova spectrometer with a room temperature probe and at 11.75 T (500 MHz), 16.45 T (700 MHz), 18.8 T (800 MHz), and 21.1 T (900 MHz) on Bruker AVANCE spectrometers with triple-resonance z-axis gradient CryoProbes. The static magnetic field strengths correspond to 2H Larmor frequencies of ωD/2π = 61.4, 76.8, 107.4, 122.8, and 138.2 MHz. Calibration of sample temperature to 298 K was accomplished using 98% 2H4-methanol [28] and small variations between spectrometers adjusted by matching chemical shifts. Relaxation rate constants R1, R1ρ, RQ, RAP were measured at five static B0 fields using a modified pulse sequence with non-constant time 13C chemical shift evolution in the indirect dimension [7]. The double-quantum relaxation rate constant requires correction for interactions with remote spins and was not utilized in the present work. For all four 2H relaxation experiments, spectra were recorded with 32 scans per t1 increment and 1024 × 200 complex points for t2 × t1. Spectral width for all relaxation experiments was 12 ppm × 20 ppm (t2 × t1). The carriers for 1H and 13C were set to 4.70 ppm and 15.0 ppm, respectively. Relaxation delays were set to {1 ms, 10 ms, 20 ms, 30 ms, 40 ms, 50 ms} for measurement of 2H R1 and RQ, {1 ms, 4 ms, 8 ms, 12 ms, 16 ms, 20 ms} for measurement of 2H RAP, and {0.5 ms, 3 ms, 5 ms, 10 ms, 15 ms, 20 ms} for measurement of 2H R1ρ. Two or three duplicate measurements within each relaxation delay series were recorded for purposes of error estimation.
2.3 Data Processing, Assignment, and Determination of Relaxation Parameters
NMR spectra were processed using NMRPipe [29]. Identification of 1H-13C methyl correlations from a 1H-13C HSQC experiment utilized previously published E. coli ribonuclease HI chemical shift assignments [21, 30]. In all, 48 methyl peaks were observed: 7 Ile, 20 Leu, and 21 Val. An equivalent number of peaks was also observed for the shortest relaxation delay in each of the four 2H relaxation experiments. Spectra were visualized in Sparky [31] and peak heights determined at assigned peak positions. The unweighted peak intensities were fit to mono-exponential decay functions using the trust-region non-linear least-squares algorithm implemented in the MATLAB (version R2016b) exponential library model ‘exp1’. Uncertainties in fitted relaxation rate constants were determined by Monte Carlo simulations, using estimates of Gaussian noise obtained from variation in duplicate measurements, and by jackknife simulations. The larger of the two error estimates was used as the experimental uncertainty for subsequent spectral density mapping.
2.4 Deuterium Spectral Density Mapping
The 2H spin relaxation rate constants are given by [32]:
| (1) |
| (2) |
| (3) |
| (4) |
in which:
| (5) |
e is the charge on the electron, eq is the principal value of the electric field gradient tensor, Q is the nuclear quadrupole moment, h is Planck’s constant, and e2Qq/h is taken to be 167 kHz. J(ω) is the spectral density function at frequency ω, and ωD is the 2H Larmor frequency. The following sections describe three methods of calculating the spectral density values from relaxation rate constants measured at more than one static magnetic field.
2.4.1 Independent Spectral Density Mapping
The relaxation rate constants, Eqs. 1–4, are written in matrix form as:
| (6) |
and constitute an overdetermined system of linear equations. In the independent method, Eq. 6 is solved by least-squares methods (vide infra) to obtain values of J(0), J(ωD), and J(2ωD) at each static magnetic field [8, 15]. Thus, relaxation rates collected at 2H frequencies of 61.4, 76.8, 122.8, and 138.2 MHz were independently analyzed using Eq. 6 to generate the spectral densities for this method. At each of the four static magnetic fields, three spectral density values are derived from four relaxation rate constants, giving one degree of freedom per field or a total of four degrees of freedom. The four values of J(0) obtained for each methyl group were averaged, as were the values of J(2ωD) = J(122.8) obtained from data acquired at 9.4 T (400 MHz for 1H spins) and J(ωD) = J(122.8) obtained from data acquired at 18.8 T (800 MHz). Thus, this analysis yields values for J(ω) at eight frequencies: J(0), J(61.4), J(76.8), J(122.8), J(138.2), J(153.6), J(245.6), and J(276.4), in which the frequencies are given as ω/(2π) in units of MHz.
2.4.2 Joint Spectral Density Mapping
In the second approach [8], relaxation data acquired at multiple static magnetic fields are analyzed jointly to take into account any spectral density values that contribute to the relaxation rate constants at more than one static field. In the present case, all data sets share a common value of J(0) and in addition, J(2ωD), for data acquired at 9.4 T is identical to J(ωD) for data acquired at 18.8 T. The resulting matrix equation is:
| (7) |
in which R̂i = [R1,i, R1ρ,i, RQ,i, RAP,i]T, V = [0,3/2,0,3/2]T, W = [1,5/2,3,1/2]T, X = [4,1,0,1]T, and 0 is a 4 × 1 zero-matrix. The least-squares solution of Eq. 7 yields values for J(ω) at eight frequencies and no post-analysis averaging of common values is needed. Eight spectral density values are derived from 16 relaxation rate constants, consequently with eight degrees of freedom.
2.4.3 Joint-Interpolated Spectral Density Mapping
The joint method shown in Eq. 7 links relaxation data acquired at 9.4 T (400 MHz) and 18.8 T (800 MHz), fields that differ by a factor of two. The joint-interpolated method uses the data acquired at 9.4 T (400 MHz) and 11.7 T (500 MHz) to interpolate values of the relaxation rate constants at 10.55 T (450 MHz). The interpolated relaxation rate constants are then paired with the relaxation data acquired at 21.1 T (900 MHz) for joint analysis.
The normalized correlation function for reorientation of the C-D bond vector is described as [33, 34]:
| (8) |
in which τm is the overall rotational correlation time, S2 is the generalized order parameter, and ai and τe,i are the amplitude and time constant for the ith term in the internal correlation function. Taking the real part of the Fourier transform of C(t) yields the spectral density function:
| (9) |
in which:
| (10) |
If and τe,i ≪ τm, the spectral density function reduces to:
| (11) |
which is a linear function of ω−2. With this insight, a first-order Taylor series approximation of a given relaxation rate constant with respect to ω−2 yields:
| (12) |
| (13) |
in which Rm,ωDj is a relaxation rate constant m = {R1, R1ρ, RQ, RAP} at a static magnetic field with 2H Larmor frequency ωDj. Averaging Eqs. 12 and 13 yields an interpolation formula for relaxation rate constants at a field for which experimental values are unavailable:
| (14) |
Based on this derivation, relaxation rate constants at 10.55 T (ωD/(2π) = 69.1 MHz) are estimated from data recorded at 9.4 T (61.4 MHz) and 11.74 T (76.8 MHz) using:
| (15) |
which can be expressed as:
| (16) |
in which:
| (17) |
In matrix form, the relationship between the relaxation rate constants at the three static magnetic fields becomes:
| (18) |
Consequently, for relaxation rates collected at deuterium frequencies of 61.4, 76.8, 122.8, and 138.2 Hz:
| (19) |
in which:
| (20) |
and 0 and I are 4-dimensional zero and identity matrices, respectively. Equation 19 is the main theoretical result of the present work. The solution of Eq. 19 yields values of the spectral density function at seven frequencies, consequently with nine degrees of freedom.
For each of the three spectral density mapping methods, spectral density values were obtained from the relaxation rates R1, R1ρ, RQ, and RAP measured at deuterium frequencies 61.4, 76.8, 122.8, and 138.2 MHz by solving Eqs. 6, 7, or 19 by singular value decomposition. Uncertainties in the spectral density values were obtained from the covariance matrix.
2.5. Model-Free Analysis
Spectral density values obtained by the independent, joint, and joint-interpolated methods were fit with the Lipari-Szabo model-free spectral density function [8, 33]:
| (21) |
in which S2axis is the generalized order parameter for a unit vector oriented along the symmetry axis of the methyl group, the factor of 1/9 accounts for (assumed rapid) rotation of the methyl group, and τ = (1/τm + 1/τe)−1. Fitting was performed by minimizing
| (22) |
in which K is the number of spectral density values being fit, σk are the uncertainties in spectral density values determined as described above, and Ĵ(ωk) is the fitted value of the spectral density function. Minimization was performed using weighted non-linear least-squares in MATLAB. Uncertainties in fitted model-free parameters were obtained from Monte Carlo simulations. Values of S2, τm, and τe were restricted to the ranges [0, 1], [0 ns, 20 ns], and [0 ns, 20 ns], respectively. Goodness-of-fit to Eq. 21 was tested by comparing the χ2 residual from the curve-fitting procedure for each methyl group to critical values obtained for a Bonferroni-corrected confidence level p = α/N, where α = 0.05 and N = 48 is the number of methyl groups analyzed. The critical χ2 values for the independent, joint, and joint-interpolated methods are 27.8, 20.4, and 18.4, respectively.
3. Results
3.1 Simulation of 69.1 MHz Deuterium Frequency Relaxation Rate Interpolation
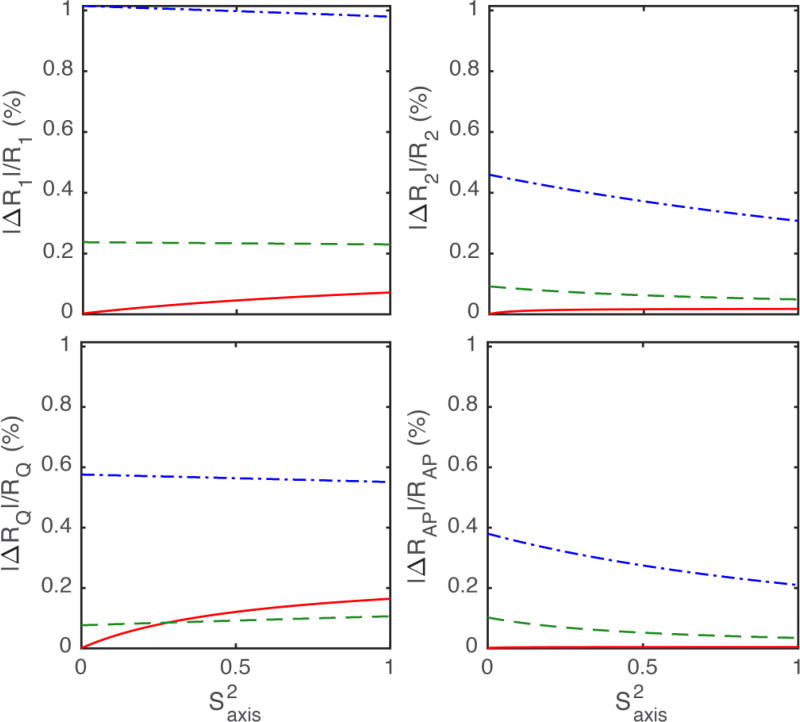
The accuracy of the proposed method for interpolation of relaxation rate constants necessary for the joint-interpolated approach was evaluated by theoretical calculations. Relaxation rates at 9.4 T, 10.55 T, and 11.7 T were calculated using Eqs. 1–4 and the Lipari-Szabo model-free formalism, Eq. 21. The percentage differences between the interpolated and exact values of the relaxation rate constants at 10.55 T are shown in Figure 1. The predicted rates show errors of ≤ 1% up to a τe of 1 ns, consistent with the experimental uncertainties in measured 2H relaxation rates (~1–2%).
Figure 1.
Predicted errors for Eq. 16 over a range of methyl axis order parameters from 0 to 1, given an overall tumbling time τm of 10 nanoseconds (ns), and effective correlation times τe of (solid, red) 0.03 ns, (dashed, green) 0.3 ns, and (dot-dashed, blue) 1 ns.
3.2 Model Selection
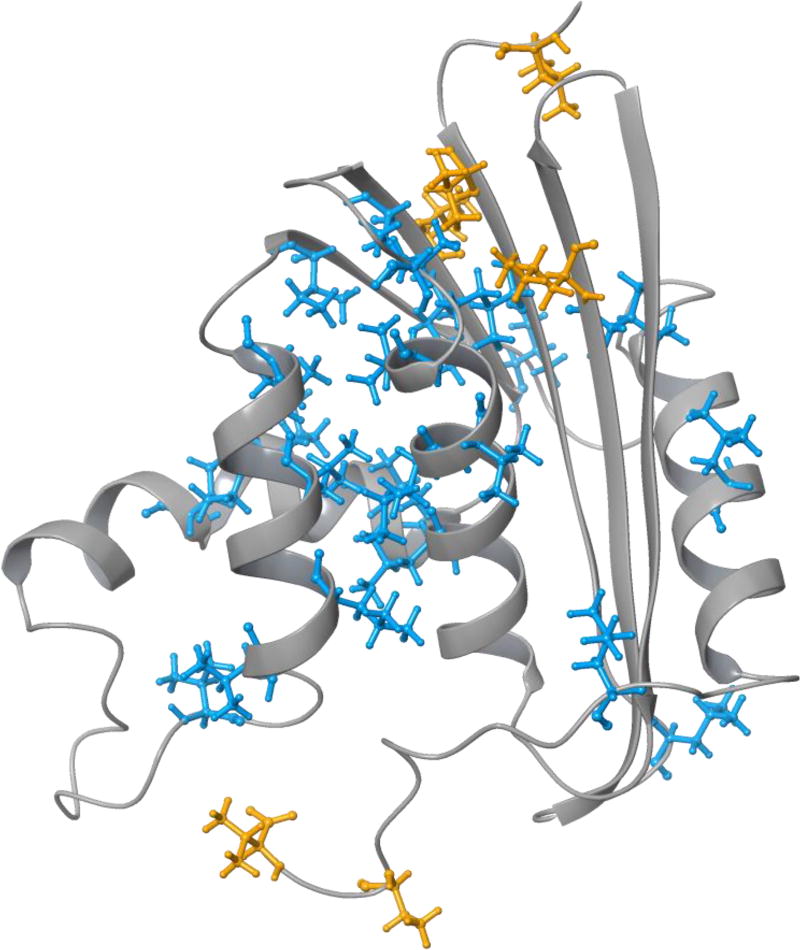
Spectral density values for each methyl resonance determined by each spectral density mapping method were fit with Eq. 21. If any of the three fits for a particular methyl group yielded a χ2 value that was less than or equal to the respective critical χ2 value, then that methyl group was included in subsequent comparisons between the three spectral density mapping methods. Methyl groups that did not meet this criterion were not considered further; these methyl groups require fitting with more complex motional models than Eq. 21 [8]. Overall, 33 of the 48 ILV methyl resonances satisfied this criterion. Fits to data for Leu 103 δ1 converged poorly and yielded large errors for τm; consequently, this methyl group was also not considered further. Figure 2 shows the locations of ILV amino acids in RNase H. Most of the methyl groups chosen for analysis are in residues located either in α-helices or β-sheets, while the other methyl groups are typically located in dynamic loops or termini.
Figure 2.
Ribbon diagram of RNase H with the observable ILV residues in stick representations. The ILV residues containing methyl relaxation data fit with the Lipari-Szabo model-free formalism, Eq. 21, are colored blue; excluded ILV residues are colored orange.
3.3 Representative Spectral Density Functions
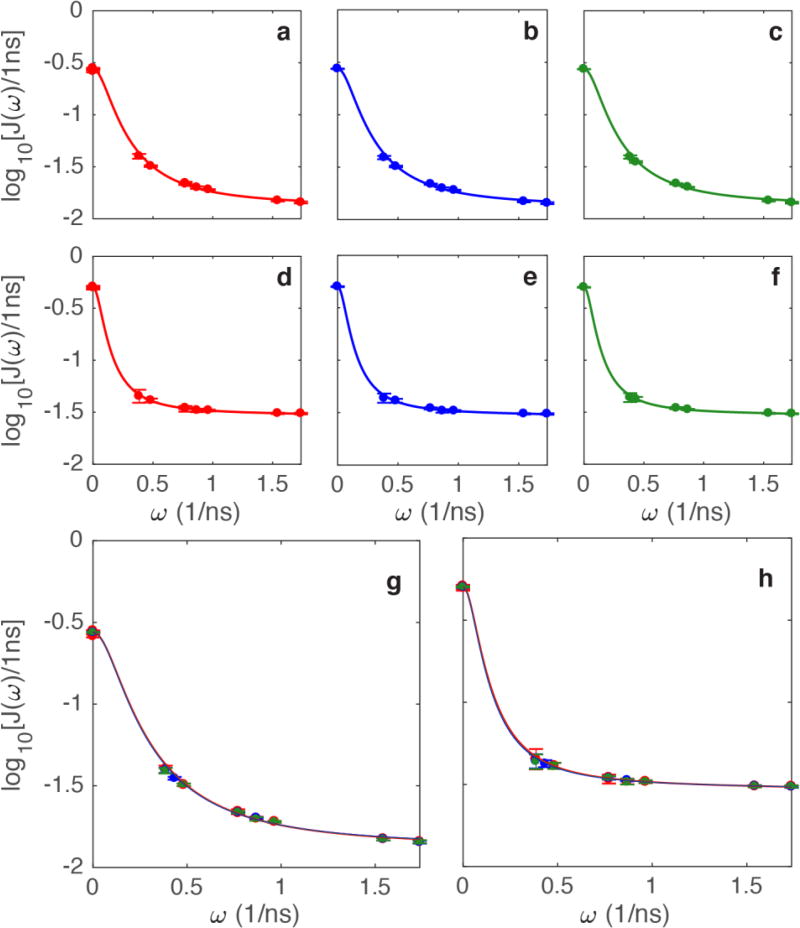
Examples of the Lipari-Szabo model-free fits to the spectral density values obtained from the three spectral density mapping methods are shown in Figure 3. Values of τm were optimized independently for each methyl group and consequently τm represents an effective local correlation time and could be smaller than the global rotational correlation time of RNase H, as determined from 15N spin relaxation [27]. Results are shown for Val 121 γ2, with a local correlation time of ~7 ns and Leucine 56 δ1 with a local correlation time of ~14 ns.
Figure 3.
(a–f) represent the individual fits for (red) independent, (blue) joint, and (green) joint-interpolated). The first row (a–c) shows plots for Val 121 γ2, with each method, plotted individually. The second row (d–f) shows plots for Leu 56 δ1, with each method also plotted individually. Superposition of data and fits for the three methods are shown for (g) Val 121 γ2 and (h) Leu 56 δ1.
3.4 Accuracy and Precision of Model Free Parameters
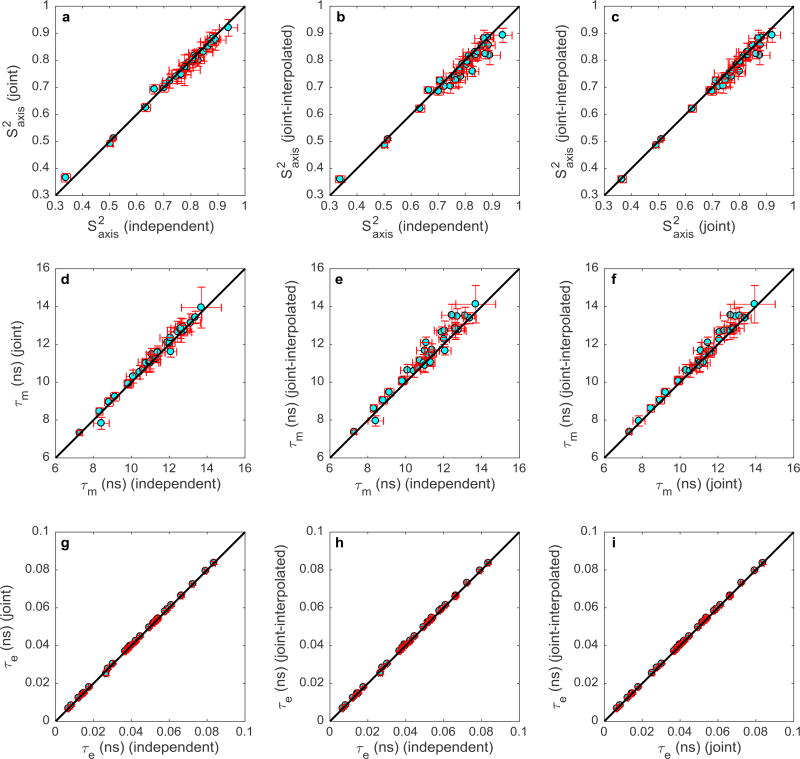
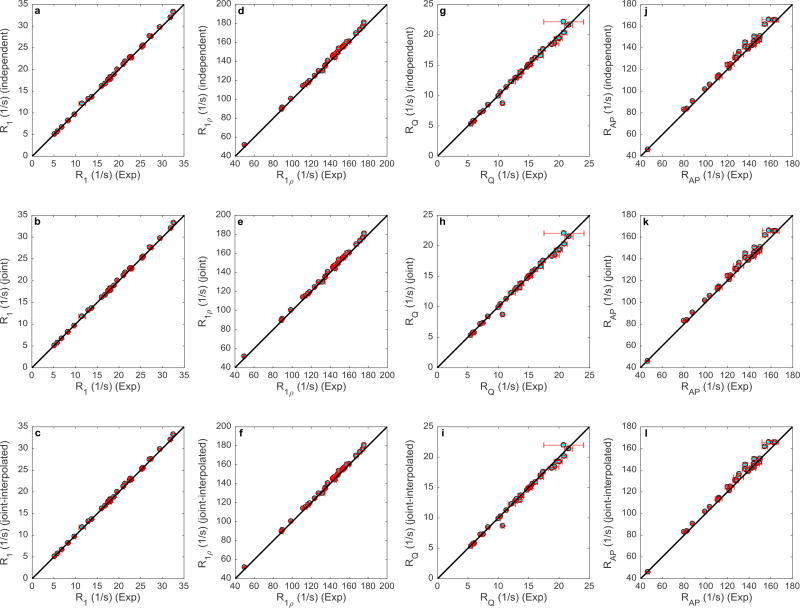
Figure 4 summarizes the results of fitting the spectral densities to the Lipari-Szabo model-free formalism to obtain , τm, and τe for 32 methyl groups. Each graph in the figure shows a one-on-one comparison between model-free parameters determined by two of the three spectral density mapping procedures. Coefficients of determination, R2, were calculated for each of the plots based on the y = x line in Figure 4. The R2 values were 0.99, 0.94, and 0.97, respectively, for comparisons, Figures 4a–c; 0.98, 0.93, and 0.97, respectively, for τm comparisons, Figures 4d–f; and 1.00 for all three τe comparisons, Figures 4g–i. Slopes of least-squares fitted lines were 0.99, 0.97, and 0.98, respectively, for comparisons, Figures 4a–c; 1.01, 1.02, and 1.02, respectively, for τm comparisons, Figures 4d–f; and 1.00 for all three τe comparisons, Figures 4g–i. The average uncertainties in the fitted Lipari-Szabo parameters, S2axis, τm, and τe, differed between the three methods of spectral density mapping. The joint-interpolated method yielded the smallest parameter uncertainties and Table 1 presents the percentage improvement in average uncertainties for this method compared with the independent and joint approaches.
Figure 4.
Correlation plots for (top row a–c), τm (middle row d–f), and τe (bottom row g–i). Each row compares the model free parameters generated from the independent, joint, and joint-interpolated methods. The parameters of the 32 residues are shown in cyan, while the error bars are depicted in red. The black line represents y=x.
Table 1.
Improvement in precision of fitted model-free parameters
| % More Precise |
Joint-Interpolated vs. Independent |
Joint-Interpolated vs. Joint |
|---|---|---|
| S2 | 14.6% | 10.8% |
| τm | 10.5% | 7.8% |
| τe | 12.8% | 10.1% |
3.5 Cross Validation with 700 MHz Spectrometer-Generated Data
The fitted model-free parameters were cross-validated by back-calculating relaxation rate constants expected for data acquired at 16.4 T (700 MHz, ωD/(2π) = 107.5 MHz) using Eqs. 1–4 and Eq. 21 and then compared to experimental data acquired at 16.4 T. Uncertainties in back-calculated relaxation rate constants were generated by Monte Carlo simulations. The cross-validated results are shown in Figure 5. The three methods of spectral density mapping gave equally accurate back-predictions of the relaxation rate constants compared with experimental values. R1 comparisons had R2 values of 1.00, R1ρ comparisons had R2 values of 0.99, RQ comparisons had R2 values of 0.99, and RAP comparisons had R2 values of 0.98. R1 and R1ρ comparisons had slopes of 1.01, RQ comparisons for independent and joint methods had slopes of 0.99, RQ comparison for the joint-interpolated method had a slope of 0.98, and RAP comparisons had slopes of 1.02.
Figure 5.
Back-calculated 700 MHz relaxation rate constants (y-axis) are compared to the experimental results (x-axis). Each row represents a method of spectral density mapping, while each column represents a relaxation rate constant. The relaxation rates of the 32 residues are shown in cyan, while the error bars are depicted in red. The black line represents y=x.
3.6 Local Diffusion Times
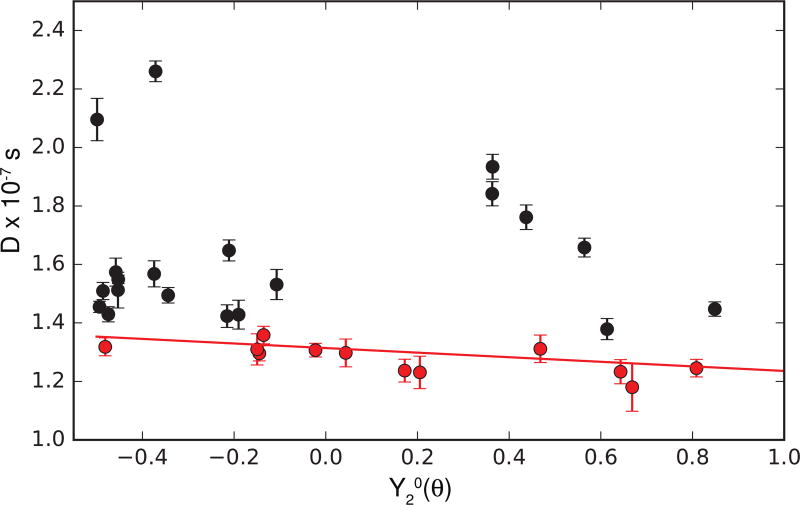
The values of τm obtained for the most rigid methyl-bearing side chains in RNase H are expected to report on the overall rotational diffusion tensor, which has been determined previously by 15N spin relaxation [27]. As shown in Figure 6, the values of the local diffusion constants, D = 1/(6τm), for the 12 methyl groups with the largest values of τm (smallest values of D; shown in red) agree well with the predictions derived from the diffusion tensor obtained from 15N spin relaxation. This agreement provides additional evidence for the accuracy of the proposed analysis for determination of rotational diffusion tensors of proteins, particularly in cases for which orientations of N-H amide bond vectors are not uniformly distributed [35].
Figure 6.
Local diffusion times (D = 1/(6τm)) plotted versus Y20(θ), in which θ is the orientation of the methyl symmetry axis in the structure of RNase H oriented in the principal axis system of the diffusion tensor determined from 15N spin relaxation. The values of D for the 12 slowest tumbling residues (for which internal motions are well-separated from overall rotation) are shown in red and agree quantitatively with predictions from the overall rotational diffusion tensor determined from 15N relaxation data (red line), when adjusted for the sample temperature and D2O viscosity.
3.7 Extent of Interpolation and Extrapolation
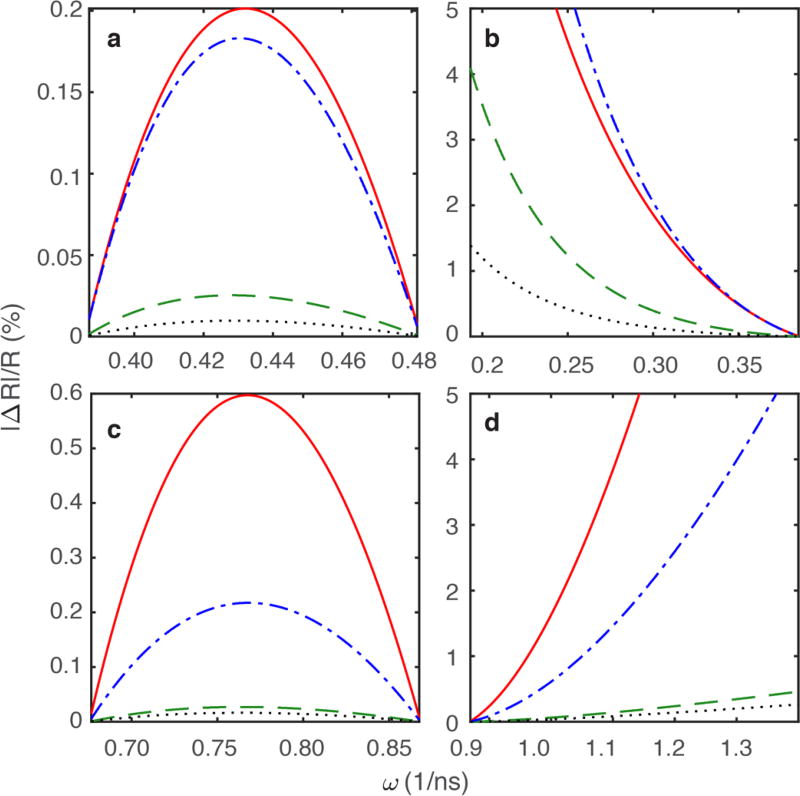
Given the success of the above method for the interpolation of relaxation rate constants necessary for the joint-interpolated approach, the accuracy of either interpolation or extrapolation was evaluated further by theoretical calculations and simulations that tested the bounds of Eq. 14. Relaxation rates at 9.4 T, 11.7 T, 18.8 T, and 21.1 T (corresponding to the two lowest and two highest experimentally-collected fields) were calculated using Eqs. 1–4 and the Lipari-Szabo model-free formalism, Eq. 21, with set values for the input variables. Four separate simulations were conducted as shown in Figure 7. Relaxation rate constants were interpolated for methyl frequencies between ωD/(2π) = 61.4 MHz – 76.8 MHz (Fig. 7a) and extrapolated for relaxation rate constants for methyl frequencies below ωD/(2π) = 61.4 MHz using the ωD/(2π) = 61.4 and 76.8 MHz pair of relaxation rate constants (Fig. 7b). Relaxation rate constants were interpolated for methyl frequencies between ωD/(2π) = 107.4 MHz – 138.2 MHz (Fig. 7c) and extrapolated for methyl frequencies above ωD/(2π) = 138.2 MHz (Fig. 7d) for the ωD/(2π) = 107.4 MHz and 138.2 MHz pair of relaxation rate constants.
Figure 7.
Predicted errors for Eq. 14 over a range of methyl frequencies ω(1/ns), given set values of methyl axis order parameters of 0.5, overall tumbling time τm of 10 nanoseconds, and effective correlation times τe of 0.3 nanoseconds. The red solid line represents R1, the green dashed line represents R1ρ, the blue dot-dashed line represents RQ, and the black dotted line represents RAP. (a) Interpolated for methyl frequencies between ωD/(2π) = 61.4 MHz – 76.8 MHz. (b) Extrapolated for methyl frequencies below ωD/(2π) = 61.4 MHz using the ωD/(2π) = 61.4 and 76.8 MHz pair of relaxation rate constants. (c) Interpolation for methyl frequencies between ωD/(2π) = 107.4 MHz – 138.2 MHz. (d) Extrapolation above ωD/(2π) = 138.2 MHz for the ωD/(2π) = 107.4 MHz and 138.2 MHz pair of relaxation rate constants.
Percentage differences between the interpolated/extrapolated and exact values of the relaxation rate constants are shown in Figure 7. The R1ρ and RAP relaxation rate constants generally have smaller percentage errors compared to R1 and RQ, likely because the J(0) contributions to Eqs. 2 and 4 remain constant regardless of method of calculation. Given that the experimental uncertainties in measured 2H relaxation rates range from ~1–2%, extrapolation or interpolation of relaxation rate constants is generally accurate for methyl frequencies that are within ~15 MHz of one of the given pair of available measurements.
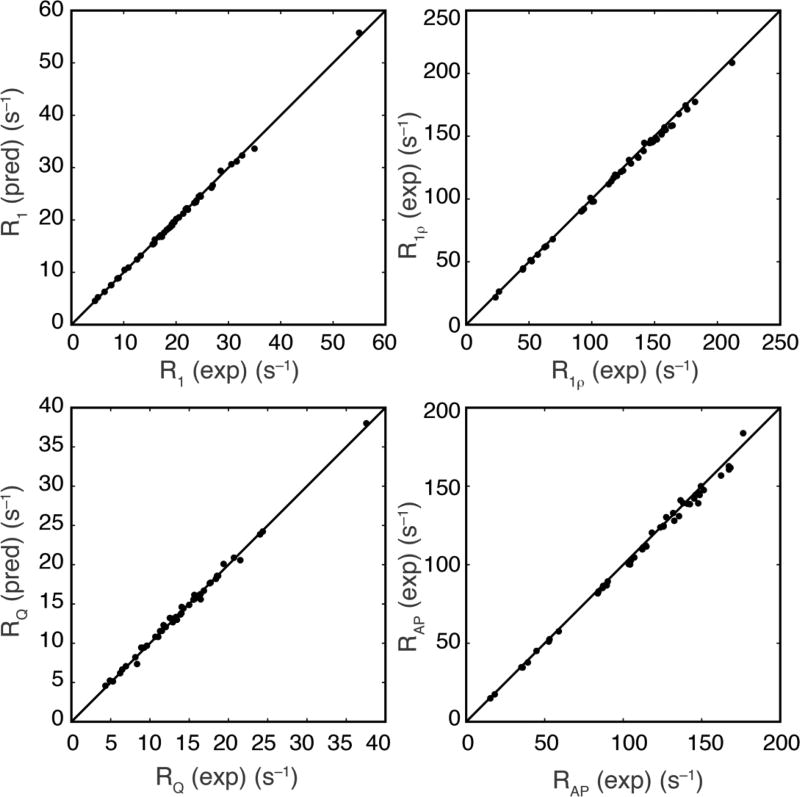
The interpolation results shown in Fig. 7d were tested experimentally by using the experimental data recorded for values of ωD/(2π) = 107.4 MHz and 138.2 MHz to interpolate values of relaxation rate constants for ωD/(2π) = 122.8 MHz. Figure 8 compares the interpolated and measured values of the relaxation rate constants at 122.8 MHz. The root-mean-square percentage deviations between the predicted and measured relaxation rate constants are very similar to the measured experimental uncertainties in the measured rate constants, consistent with the predictions of Fig. 7d and further confirming the accuracy of the proposed method of interpolation.
Figure 8.
Comparison of 2H relaxation rate constants (pred) interpolated and (exp) measured at ωD/(2π) = 122.8 MHz. Interpolation was performed using measured values of the relaxation rate constants with ωD/(2π) = 107.4 MHz and 138.2 MHz. For R1, the slope of a line fitted through the origin was 0.997, the root-mean-square (rms) relative variation was 1.0%. The rms relative uncertainty in the measured values was 1.8%. For R1ρ, the slope of a line fitted through the origin was 0.984, the rms relative variation was 1.5%. The rms relative uncertainty in the measured values was 1.6%. For RQ, the slope of a line fitted through the origin was 0.983, the rms relative variation was 2.2%. The rms relative uncertainty in the measured values was 2.7%. For RAP, the slope of a line fitted through the origin was 0.997, the root-mean-square percent variation was 1.9%. The rms relative uncertainty in the measured values was 2.2%. The rms relative variations between predicted and experimental values shown above were divided by 21/2 to allow direct comparison to relative variation in experimental values.
4. Discussion and Conclusion
NMR spin relaxation methods are powerful approaches for characterizing conformational dynamics of biological macromolecules. Weaknesses of these methods are that the target spectral density function can only be sampled at the discrete eigenfrequencies of the spin system being studied and that model spectral density functions can have many optimizable parameters. Both of these weaknesses are alleviated by acquiring additional relaxation data at multiple static magnetic fields [36].
The present work examined three methods of performing spectral density mapping of 2H relaxation in 13CH2D methyl group isotopomers, which have been termed independent, joint, and joint-interpolated. The latter two approaches make use of a unique feature of 2H quadrupolar relaxation: the number of spectral density values entering into the relaxation equations is reduced if data are acquired at pairs of static magnetic fields that differ by a factor of two. As relatively few such paired fields are available at present (in the current work, only 400 MHz/800 MHz), the joint-interpolation method approximates such pairings, in the current work by interpolating between 400 MHz and 500 MHz to generate relaxation data at 450 MHz for pairing with 900 MHz data. The major advantages of the joint and joint-interpolation methods are the consequent additional increases in the statistical degrees of freedom compared with the independent method.
Comparisons among the three spectral density mapping methods and cross validation with an independent data set indicated that the three approaches were equally accurate; however, the joint-interpolation method yielded an improvement in precision for the final fitted model-free parameters of between 10–15% compared to the independent method and of between 7–11% compared with the joint analysis. These results would make the joint-interpolation method preferable over the other two methods. Notably, no additional data need to be acquired to implement the joint-interpolated method and as more commercial NMR spectrometers with frequencies of 1000 MHz and 1200 MHz become available, additional pairs of fields become accessible, further increasing the power of this method.
Highlights.
2H relaxation rates for E. coli ribonuclease H at four static magnetic fields
Evaluation of three approaches for spectral density mapping of multiple field data
Cross validation with a fifth magnetic field establishes accuracy of all methods
Novel interpolation strategy improves precision of fitted model-free parameters
Acknowledgments
This work was supported by National Institutes of Health grant R01 GM059273 (A. G. P.) and T32 GM008281 (A. H. and P. A. O). Some of the work presented here was conducted at the Center on Macromolecular Dynamics by NMR Spectroscopy located at the New York Structural Biology Center, supported by a grant from the NIH National Institute of General Medical Sciences (P41 GM118302). A.G.P. is a member of the New York Structural Biology Center. The data collected at NYSBC was made possible by a grant from NYSTAR and ORIP/NIH facility improvement grant CO6RR015495. The 700 MHz spectrometer was purchased with funds from NIH grant S10OD018509. The 900 MHz NMR spectrometers were purchased with funds from NIH grant P41GM066354, the Keck Foundation, New York State Assembly, and U.S. Dept. of Defense.
Footnotes
Publisher's Disclaimer: This is a PDF file of an unedited manuscript that has been accepted for publication. As a service to our customers we are providing this early version of the manuscript. The manuscript will undergo copyediting, typesetting, and review of the resulting proof before it is published in its final citable form. Please note that during the production process errors may be discovered which could affect the content, and all legal disclaimers that apply to the journal pertain.
References
- 1.Nussinov R, Jang H, Tsai CJ, Liao TJ, Li S, Fushman D, Zhang J. Intrinsic protein disorder in oncogenic KRAS signaling. Cell. Mol. Life Sci. 2017;74:3245–3261. doi: 10.1007/s00018-017-2564-3. [DOI] [PMC free article] [PubMed] [Google Scholar]
- 2.Csizmok V, Follis AV, Kriwacki RW, Forman-Kay JD. Dynamic protein interaction networks and new structural paradigms in signaling. Chem. Rev. 2016;116:6424–6462. doi: 10.1021/acs.chemrev.5b00548. [DOI] [PMC free article] [PubMed] [Google Scholar]
- 3.Dethoff EA, J C, Mustoe AM, Al-Hashimi HM. Functional complexity and regulation through RNA dynamics. Nature. 2012;482:322–330. doi: 10.1038/nature10885. [DOI] [PMC free article] [PubMed] [Google Scholar]
- 4.Palmer AG. NMR characterization of the dynamics of biomacromolecules. Chem. Rev. 2004;104:3623–3640. doi: 10.1021/cr030413t. [DOI] [PubMed] [Google Scholar]
- 5.Kay LE. New views of functionally dynamic proteins by solution NMR spectroscopy. J. Mol. Biol. 2016;428:323–331. doi: 10.1016/j.jmb.2015.11.028. [DOI] [PubMed] [Google Scholar]
- 6.Narayanan C, Bafna K, Roux LD, Agarwal PK, Doucet N. Applications of NMR and computational methodologies to study protein dynamics. Arch. Biochem. Biophys. 2017;628:71–80. doi: 10.1016/j.abb.2017.05.002. [DOI] [PMC free article] [PubMed] [Google Scholar]
- 7.Millet O, Muhandiram DR, Skrynnikov NR, Kay LE. Deuterium spin probes of sidechain dynamics in proteins. 1. Measurement of five relaxation rates per deuteron in 13C-labeled and fractionally 2H-enriched proteins in solution. J. Am. Chem. Soc. 2002;124:6439–6448. doi: 10.1021/ja012497y. [DOI] [PubMed] [Google Scholar]
- 8.Skrynnikov NR, Millet O, Kay LE. Deuterium spin probes of side-chain dynamics in proteins. 2. Spectral density mapping and identification of nanosecond time-scale side-chain motions. J. Am. Chem. Soc. 2002;124:6449–6460. doi: 10.1021/ja012498q. [DOI] [PubMed] [Google Scholar]
- 9.Sheppard D, Li DW, Bruschweiler R, Tugarinov V. Deuterium spin probes of backbone order in proteins: 2H NMR relaxation study of deuterated carbon alpha sites. J. Am. Chem. Soc. 2009;131:15853–15865. doi: 10.1021/ja9063958. [DOI] [PMC free article] [PubMed] [Google Scholar]
- 10.Tugarinov V, Kay LE. A 2H NMR relaxation experiment for the measurement of the time scale of methyl side-chain dynamics in large proteins. J. Am. Chem. Soc. 2006;128:12484–12489. doi: 10.1021/ja063071s. [DOI] [PubMed] [Google Scholar]
- 11.Vallurupalli P, Kay LE. A suite of 2H NMR spin relaxation experiments for the measurement of RNA dynamics. J. Am. Chem. Soc. 2005;127:6893–6901. doi: 10.1021/ja0427799. [DOI] [PubMed] [Google Scholar]
- 12.Vallurupalli P, Scott L, Hennig M, Williamson JR, Kay LE. New RNA labeling methods offer dramatic sensitivity enhancements in 2H NMR relaxation spectra. J. Am. Chem. Soc. 2006;128:9346–9347. doi: 10.1021/ja0632512. [DOI] [PubMed] [Google Scholar]
- 13.Peng JW, Wagner G. Frequency spectrum of NH bonds in eglin c from spectral density mapping at multiple fields. Biochemistry. 1995;34:16733–16752. doi: 10.1021/bi00051a023. [DOI] [PubMed] [Google Scholar]
- 14.Ishima R, Nagayama K. Quasi-spectral density function analysis for nitrogen-15 nuclei in proteins. J. Magn. Reson., Ser. B. 1995;108:73–76. [Google Scholar]
- 15.Johnson E, Chazin WJ, Rance M. Effects of calcium binding on the side-chain methyl dynamics of calbindin D9k: a 2H NMR relaxation study. J. Mol. Biol. 2006;357:1237–1252. doi: 10.1016/j.jmb.2006.01.031. [DOI] [PubMed] [Google Scholar]
- 16.Ishima R, Petkova AP, Louis JM, Torchia DA. Comparison of methyl rotation axis order parameters derived from model-free analyses of 2H and 13C longitudinal and transverse relaxation rates measured in the same protein sample. J. Am. Chem. Soc. 2001;123:6164–6171. doi: 10.1021/ja0104711. [DOI] [PubMed] [Google Scholar]
- 17.Tadokoro T, Kanaya S. Ribonuclease H: molecular diversities, substrate binding domains, and catalytic mechanism of the prokaryotic enzymes. FEBS J. 2009;276:1482–1493. doi: 10.1111/j.1742-4658.2009.06907.x. [DOI] [PubMed] [Google Scholar]
- 18.Nowotny M. Retroviral integrase superfamily: the structural perspective. EMBO Rep. 2009;10:144–151. doi: 10.1038/embor.2008.256. [DOI] [PMC free article] [PubMed] [Google Scholar]
- 19.Moelling K, Broecker F. The reverse transcriptase-RNase H: from viruses to antiviral defense. Ann. N. Y. Acad. Sci. 2015;1341:126–135. doi: 10.1111/nyas.12668. [DOI] [PubMed] [Google Scholar]
- 20.Hollien J, Marqusee S. Comparison of the folding processes of T. thermophilus and E. coli ribonucleases H. J. Mol. Biol. 2002;316:327–340. doi: 10.1006/jmbi.2001.5346. [DOI] [PubMed] [Google Scholar]
- 21.Butterwick JA, Loria JP, Astrof NS, Kroenke CD, Cole R, Rance M, Palmer AG. Multiple time scale backbone dynamics of homologous thermophilic and mesophilic ribonuclease HI enzymes. J. Mol. Biol. 2004;339:855–871. doi: 10.1016/j.jmb.2004.03.055. [DOI] [PubMed] [Google Scholar]
- 22.Katayanagi K, Miyagawa M, Matsushima M, Ishikawa M, Kanaya S, Ikehara M, Matsuzaki T, Morikawa K. Three-dimensional structure of ribonuclease H from E. coli. Nature. 1990;347:306–309. doi: 10.1038/347306a0. [DOI] [PubMed] [Google Scholar]
- 23.Tugarinov V, Kanelis V, Kay LE. Isotope labeling strategies for the study of high-molecular-weight proteins by solution NMR spectroscopy. Nat. Protoc. 2006;1:749–754. doi: 10.1038/nprot.2006.101. [DOI] [PubMed] [Google Scholar]
- 24.Tugarinov V, Ollerenshaw JE, Kay LE. Probing side-chain dynamics in high molecular weight proteins by deuterium NMR spin relaxation: an application to an 82-kDa enzyme. J. Am. Chem. Soc. 2005;127:8214–8225. doi: 10.1021/ja0508830. [DOI] [PubMed] [Google Scholar]
- 25.Yang W, Hendrickson WA, Kalman ET, Crouch RJ. Expression, purification, and crystallization of natural and selenomethionyl recombinant ribonuclease H from Escherichia coli. J. Biol. Chem. 1990;265:13553–13559. [PubMed] [Google Scholar]
- 26.Mandel AM, Akke M, Palmer AG. Backbone dynamics of Escherichia coli ribonuclease HI: correlations with structure and function in an active enzyme. J. Mol. Biol. 1995;246:144–163. doi: 10.1006/jmbi.1994.0073. [DOI] [PubMed] [Google Scholar]
- 27.Kroenke CD, Loria JP, Lee LK, Rance M, Palmer AG. Longitudinal and transverse 1H-15N dipolar 15N chemical shift anisotropy relaxation interference: Unambiguous determination of rotational diffusion tensors and chemical exchange effects in biological macromolecules. J. Am. Chem. Soc. 1998;120:7905–7915. [Google Scholar]
- 28.Findeisen M, Brand T, Berger S. A 1H-NMR thermometer suitable for cryoprobes. Magn. Reson. Chem. 2007;45:175–178. doi: 10.1002/mrc.1941. [DOI] [PubMed] [Google Scholar]
- 29.Delaglio F, Grzesiek S, Vuister GW, Zhu G, Pfeifer J, Bax A. NMRPipe: a multidimensional spectral processing system based on UNIX pipes. J. Biomol. NMR. 1995;6:277–293. doi: 10.1007/BF00197809. [DOI] [PubMed] [Google Scholar]
- 30.Yamazaki T, Yoshida M, Nagayama K. Complete assignments of magnetic resonances of ribonuclease H from Escherichia coli by double- and triple-resonance 2D and 3D NMR spectroscopies. Biochemistry. 1993;32(21):5656–5669. doi: 10.1021/bi00072a023. [DOI] [PubMed] [Google Scholar]
- 31.Lee W, Tonelli M, Markley JL. NMRFAM-SPARKY: enhanced software for biomolecular NMR spectroscopy. Bioinformatics. 2015;31:1325–1327. doi: 10.1093/bioinformatics/btu830. [DOI] [PMC free article] [PubMed] [Google Scholar]
- 32.Cavanagh J, Fairbrother WJ, Palmer AG, Rance M, Skelton NJ. Protein NMR Spectroscopy: Principles and Practice. 2. Academic Press; Amsterdam; Boston: 2007. [Google Scholar]
- 33.Lipari G, Szabo A. Model-free approach to the interpretation of nuclear magneticresonance relaxation in macromolecules. 1. Theory and range of validity. J. Am. Chem. Soc. 1982;104:4546–4559. [Google Scholar]
- 34.Lipari G, Szabo A. Model-free approach to the interpretation of nuclear magneticresonance relaxation in macromolecules. 2. Analysis of experimental results. J. Am. Chem. Soc. 1982;104:4559–4570. [Google Scholar]
- 35.Lee LK, Rance M, Chazin WJ, Palmer AG. Rotational diffusion anisotropy of proteins from simultaneous analysis of 15N and 13Ca nuclear spin relaxation. J. Biomol. NMR. 1997;9(287–298) doi: 10.1023/a:1018631009583. [DOI] [PubMed] [Google Scholar]
- 36.Gill ML, Byrd RA, Palmer AG. Dynamics of GCN4 facilitate DNA interaction: a model-free analysis of an intrinsically disordered region. Phys. Chem. Chem. Phys. 2016;18:5839–5849. doi: 10.1039/c5cp06197k. [DOI] [PMC free article] [PubMed] [Google Scholar]


