

Abstract
Background
Lassa fever (LF) is a viral hemorrhagic disease endemic in West Africa. There are no large-scale studies from Nigeria, where the virus is most diverse. Virus diversity, coupled with host genetic and environmental factors, may cause differences in pathophysiology. Small-scale studies in Nigeria suggest acute kidney injury (AKI) as an important clinical feature, and may be a significant determinant of survival. To shed more light on these, we retrospectively studied a cohort of 291 RT-PCR positive LF subjects managed at Irrua Specialist Teaching Hospital, (ISTH) Nigeria.
Methods
We conducted a retrospective, observational study of 291 consecutive RT-PCR positive LF patients treated at ISTH between 2011 and 2015. We performed univariate and multivariate statistical analyses, including logistic regression, of the available demographic, clinical, and laboratory variables in order to elucidate the factors associated with patient death.
Findings
Among the 291 patients studied, 284 had known outcomes (died or survived), and 7 were discharged against medical advice. Overall CFR (Case Fatality Rate) was 24% (68/284), with a 1.5-fold increased mortality risk for each 10 years of age (P=0.00017), reaching nearly 40% (22/57) for patients older than 50 years. We found AKI (overall incidence 28%, 81/284) and central nervous system (CNS) manifestations (37%, 104/284) to be important complications of Acute LF in Nigeria. AKI was strongly associated with poor outcome (CFR 60%, 49/81). AKI subjects had higher incidence of proteinuria (82%, 32/39) and hematuria (76%, 29/38), higher mean serum potassium and lower ratio of blood urea nitrogen to creatinine (BUN:Cr), suggesting intrinsic renal damage. Normalization of creatinine levels correlated with recovery. Elevated serum creatinine (OR=1.3, P=0.046), aspartate aminotransferase (OR=1.5, P=0.075), and potassium (OR =3.6, P=0.0024) were independent predictors of death.
Interpretation
Our study presents detailed clinical and laboratory data for Nigerian LF patients and provides strong evidence for intrinsic renal dysfunction in acute LF. Early recognition and treatment of AKI may significantly reduce mortality.
Introduction
Lassa fever (LF) is a viral hemorrhagic disease endemic in West Africa, where it imposes a substantial health burden.1 First described in 1969,2 LF’s causative agent is the Lassa virus (LASV), a member of the Arenaviridae family and a Biosafety Level 4 pathogen (BSL-4). Its main reservoir and primary source of infection is the multimammate mouse (Mastomys natalensis), but the virus also spreads between humans by contact with body fluids of an infected person. An estimated 100,000 to 300,000 people are infected by LASV every year in West Africa, although the overall incidence is likely to be underestimated.3 Most LASV-infected individuals are never diagnosed with LF, due to mild or asymptomatic presentation of the disease. Case Fatality Rates (CFRs) in hospitalized LF patients range between 10 and 20%, and can be much higher in outbreak settings or in individuals at increased risk.4 The only known treatment is the antiviral drug Ribavirin, shown to be most effective in the first 6 days after onset of symptoms.5 No vaccine is available, although there has been progress with human monoclonal antibodies in pre-clinical animal models.6,7
Despite LF’s endemic nature and high mortality, the underlying mechanisms of disease are not fully understood.8 Few large-scale clinical studies have been conducted, and most are limited to Sierra Leone and Liberia despite the vast geographic reach of the virus (see Suppl. Table S1 for a comprehensive list.) These studies show a wide spectrum of clinical severities, from asymptomatic infection to serious multi-organ dysfunction, hemorrhage, and neurological manifestations. Even among acute cases, observations range from limited cell damage in liver and kidneys to more extensive involvement of these organs.9,10 Only one study, from cases in Sierra Leone in the late 1970s, has modeled LF outcome with the aim to help physicians make early prognoses based on clinical features, and it remains the most comprehensive to date.11
Less is known about LF in Nigeria, despite the epidemic risk. The circulating virus is more diverse and genetically distinct from that seen elsewhere. Outbreaks occur in this country frequently; the latest had a reported CFR of 38%.12 Recent sequencing studies have shown that the virus is highly divergent and more diverse than other hemorrhagic fever-causing viruses in the region, with strain variation up to 32%.13 This is comparable with Crimean-Congo Hemorrhagic Fever Virus, the most genetically diverse of the arbovirus family, which reaches 30% sequence difference among isolates.14 In contrast, genetic diversity of Ebola Virus is less than 3% across all sequenced strains, and 5% in Rift Valley Fever Virus.15 LASV’s high diversity might explain the observed variability of its clinical presentation as well as possible regional differences in LF. Earlier studies at Irrua Specialist Teaching Hospital (ISTH),16 revealed that fatal cases consistently had higher blood urea nitrogen (BUN) and serum creatinine (Cr) levels than survivors, and severe systemic disease included acute kidney injury (AKI). However, studies conducted since 1970 across Sierra Leone, Guinea, Liberia, and Nigeria show varying degrees of renal involvement (Suppl. Table S1).
Here we present one of the largest and the most detailed Nigerian LF clinical datasets to date, which includes 291 patients admitted to the LF ward at ISTH between January 2011 and November 2015. The majority of patients originate from Edo State, Nigeria, where ISTH serves as a referral hospital. All patients received Ribavirin treatment and the same supportive care. This dataset includes clinical signs and symptoms before admission and at presentation, vital signs and complications during treatment, and detailed laboratory results (hematology and blood chemistry) at presentation and over the course of the treatment. We derived logistic regression models from this data to quantify the contributions of individual organ involvement to the overall mortality risk in LF. We also investigated the relative contributions of different clinical manifestations to the mortality risk at admission, quantified the incidence of various complications affecting patients, and examined the importance of renal involvement as a feature of LF. Furthermore, we hypothesize that LASV was the direct cause of intrinsic renal damage for a subset of the LF patients in our cohort, and found evidence to support this hypothesis.
Methods
Data collection and management
The study population consists of all consecutive patients with clinical and laboratory records admitted to the LF ward of ISTH in the period January 2011-November 2015. Patients were accepted into the ward after case confirmation by LASV reverse transcriptase polymerase chain reaction (RT-PCR), targeting the glycoprotein complex (GPC) gene using QIAGEN OneStep RT-PCR Kit reagents (Qiagen, no. 210210 or 210212), as reported previously in Asogun et al.16 Patients were diagnosed and clinically tested at ISTH using the sample collection and processing protocol described by Asogun and colleagues. Blood draws were done on the day of presentation for diagnosis and baseline for relevant laboratory parameters, and as required for guiding management decisions. The clinical parameters were measured on the day of presentation and multiple times daily thereafter. Laboratory data was obtained using DAUR BIO-MEDICAL ELECTRONICS SP-2000 spectrophotometer for electrolyte measurements, ERMA INC. PCE-210N automated blood cell counter for hematology, and ELITech Clinical systems SELECTRA PRO S chemistry analyzer.
Demographic information (age, sex, occupation, place of residence, tribe), presentation signs and symptoms (temperature, blood pressure, pulse and respiratory rate, cough, vomiting, diarrhea, weakness, jaundice, etc.), laboratory results (hematology, blood chemistry), and outcome (Survival, Death, or Discharged against Medical Advice) were first recorded on paper forms, later compiled into a password-protected database maintained at ISTH, and finally extracted as de-identified Excel spreadsheets. Researchers at Harvard University and the Broad Institute obtained access to de-identified data under the approved IRB protocols F22362 at Harvard and 1108004625 at MIT.
Data analysis
We conducted univariate correlation analysis of all demographic, clinical and laboratory variables available at presentation to determine the statistical significance (at P<0.05) of the pairwise associations between the variables describing patient’s condition at the time of admission and their outcome (survival or death.) We constructed multivariate logistic regression models to identify independent demographic, clinical, and laboratory factors associated with death in LF, and to stratify patients into risk groups. Since our dataset is not large enough to derive a fully saturated model with all variables as predictors, we applied a variable selection protocol that allowed us to discard redundant variables and to reach a parsimonious model that includes only 7 predictors. Once we obtained such non-redundant set of predictors, we applied multiple imputation to estimate missing values, fitted the regression coefficients using all patients in each imputation as the training set, and generated a single pooled model by averaging the coefficients derived from each imputation. We validated these models using bootstrap sampling, which yielded optimism-corrected Area Under the Curve (AUC), Brier score, calibration error, accuracy, and adjusted McFadden pseudo-R2 statistic. For risk stratification, we defined thresholds for low, medium, and high-risk groups, based on the observed overall and acute CFRs, as follows: <5% probability of death for low risk patients, >5% to <25% for medium risk, and >25% for high risk. These protocols are fully described in the supplementary materials, and their implementation is available at https://github.com/broadinstitute/lassa-isth-code.
For characterizing kidney dysfunction in AKI, we considered all patients who developed this complication during treatment and compared the distributions of the blood urea nitrogen to creatinine ratio (BUN:Cr) between patients with and without history of fluid loss at admission (defined as presenting with diarrhea, bleeding, or vomiting.) This ratio can point to suspected causes for AKI: a ratio greater than 20:1 is indicative of dehydration or hypoperfusion, while a ratio lower than 10:1 could indicate intrinsic renal damage.
In order to understand the influence of treatment on normalizing renal and liver function, we examined the relationship between patient mortality and changes in Cr and aspartate aminotransferase (AST) during treatment. We calculated the CFR of patients in four different groups for each biomarker: (1) patients who had normal levels at presentation and at discharge or death, (2) patients who had elevated levels at both presentation and discharge/death, (3) patients who had elevated levels only at discharge/death, (4) and those with elevated levels only at presentation. We defined normal levels as <2 mg/dl for Cr and <120 IU/L for AST, since these ranges correspond to the upper normal limit (UNL) for Cr, while 120 IU/L is 3xUNL for AST — still considered a mild level and lower than the mean AST in surviving patients (using <40 IU/L as normal level for AST yielded too few patients to perform the analysis.)
Finally, we examined the incidence of complications during the course of the hospitalization and co-infections, and reported data on patient follow-up and sequelae.
Role of the funding source
The sponsors of the study had no role in study design, data collection, data analysis, data interpretation, or writing of the manuscript. The corresponding authors had full access to all the data in the study and had final responsibility for the decision to submit for publication.
Results
Descriptive statistics and univariate analysis
The dataset comprises 291 patients, including 170 males and 121 females, at an average age of 35 years. The overall CFR is 24% (68 deaths among the 284 patients with known outcome.) This is substantially lower than the 69% CFR observed in the Eastern Province of Sierra Leone by Shaffer et al. The differences in mortality across ISTH ‘s catchment area (Figure 1A) are not significant enough to imply any definite geographical pattern, but a notable outlier is a cluster of high CFR (55%, 6/11) around Jalingo, in the northeast of Nigeria, corresponding to a number of seriously ill LF patients transferred to ISTH in 2012.
Figure 1. Geographic distribution of LF cases and mortality as function of age.

(A) map of Nigeria showing the LF cases treated at ISTH between 2011 and 2015, clustered by mutual proximity. The area of the clusters is proportional to the number of cases, and the color coding represents the observed mortality. (B) bar plot representing mortality as a function of patient age. Age was binned in 10-years intervals, with the exception of the 70-90 years bin, since there was only one patient older than 80 years of age. The height of the histogram bars represents the CFR within each age group. The total patient count in each group is represented by the continuous black line. The inset shows the box plot of the age distribution of surviving and fatal cases.
While there is no significant difference in mortality between males and females, there is a marked dependency on age (Figure 1B): CFR is 20% for patients younger than 50 years (46/227), and increases to over 30% for older patients (22/57). This is also a departure from what has been observed in Sierra Leone, where death risk in patients >60 years old is lower. There are only 9 children (≤15 years old), around 3% of the entire cohort, and all of them survived. The previous ISTH study from Asogun reports 10% children among all patients, while incidence among pregnant women (11 out of 120) is consistent with earlier reports.17 However, this study is not community-based, but rather originates from voluntarily hospitalized patients in one location in Nigeria. Therefore, we cannot draw conclusions on prevalence; and the trends in demographics, clinical features and outcomes may vary from year to year.
We identified clinical and laboratory features significantly associated with LF outcome (Tables 1 and 2, Suppl. Figure 3). Severe central nervous system (CNS) symptoms (coma, seizure; irrational talk/behavior, altered sensorium, tremors, and disorientation/confusion: which suggest encephalitis, meningitis, or encephalopathy), face and neck (F/N) swelling, jaundice, bleeding, hematuria, proteinuria, and non-severe CNS symptoms (dizziness, lethargy, drowsiness) are the clinical features associated with outcome at P<0.05. These designations of severe and non-severe CNS features were based on known symptoms and signs of viral encephalitis, meningitis, and encephalopathy, and our previous observations18,19 at ISTH that certain CNS features were associated with excess mortality while others were not. Overall incidence of severe and non-severe CNS manifestations at presentation was 30% (84/284).
Table 1. Clinical variables at presentation, ranked by the P-value of their univariate association with LF outcome.
The binary variables in the table include signs and symptoms at presentation, ordered by increasing P-value. The P-value corresponds to a χ2 test with Yates correction.
| Variable | Overall incidence % | Incidence Surv. % | Incidence Died % | Missing % | P-value | OR 95% CI |
|---|---|---|---|---|---|---|
| Severe CNS1 | 15 (45/284) | 10 (22/216) | 33 (23/68) | 0 (0/291) | <0.001 | 4.5 (2.3, 8.8) |
|
|
||||||
| F/N swelling2 | 11 (33/284) | 8 (18/216) | 22 (15/68) | 0 (0/291) | 0.004 | 3.1 (1.5, 6.6) |
|
|
||||||
| Jaundice | 3 (11/284) | 1 (4/216) | 10 (7/68) | 0 (0/291) | 0.005 | 6.1 (1.7, 21.5) |
|
|
||||||
| Hematuria | 66 (90/136) | 61 (67/109) | 85 (23/27) | 53 (155/291) | 0.02 | 3.6 (1.2, 11.1) |
|
|
||||||
| Proteinuria | 65 (91/138) | 61 (69/112) | 84 (22/26) | 52 (152/291) | 0.04 | 3.4 (1.1, 10.6) |
|
|
||||||
| Bleeding | 25 (72/284) | 22 (48/216) | 35 (24/68) | 0 (0/291) | 0.04 | 1.9 (1.1, 3.4) |
|
|
||||||
| Non-severe CNS | 21 (61/284) | 18 (40/216) | 30 (21/68) | 0 (0/291) | 0.04 | 2.0 (1.1, 3.6) |
|
|
||||||
| Red eyes | 12 (35/284) | 10 (22/216) | 19 (13/68) | 0 (0/291) | 0.06 | 2.1 (1.0, 4.4) |
|
|
||||||
| Headache | 54 (156/284) | 57 (125/216) | 45 (31/68) | 0 (0/291) | 0.09 | 0.6 (0.3, 1.1) |
|
|
||||||
| Diarrhea | 29 (84/284) | 27 (59/216) | 36 (25/68) | 0 (0/291) | 0.17 | 1.5 (0.9, 2.7) |
|
|
||||||
| Vomiting | 63 (179/284) | 65 (141/216) | 55 (38/68) | 0 (0/291) | 0.19 | 0.7 (0.4, 1.2) |
|
|
||||||
| Weakness | 55 (158/284) | 54 (117/216) | 60 (41/68) | 0 (0/291) | 0.40 | 1.3 (0.7, 2.2) |
|
|
||||||
| Abdominal pain | 52 (150/284) | 51 (112/216) | 55 (38/68) | 0 (0/291) | 0.58 | 1.2 (0.7, 2.0) |
|
|
||||||
| Chest pain | 23 (67/284) | 24 (53/216) | 20 (14/68) | 0 (0/291) | 0.62 | 0.8 (0.4, 1.5) |
|
|
||||||
| Sore throat | 38 (109/284) | 38 (84/216) | 36 (25/68) | 0 (0/291) | 0.78 | 0.9 (0.5, 1.6) |
|
|
||||||
| Cough | 30 (87/284) | 31 (67/216) | 29 (20/68) | 0 (0/291) | 0.88 | 0.9 (0.5, 1.7) |
Severe central nervous system features
Face and neck swelling
Table 2. Demographics, vital signs, and lab variables at presentation, ranked by the P-value of their univariate association with LF outcome.
The numerical (decimal or integer-valued) variables comprise demographic (age), vital signs (temperature, blood pressure, pulse and respiratory rate), and laboratory results obtained on the day of presentation. Variables are ranked by P-value (from smallest to largest) within each group. The P-value was obtained with a point biserial correlation test.
| Variable | Mean Survived (95% CI) |
Mean Died (95% CI) |
Normal range | Missing % | P-value | OR (95% CI) |
|---|---|---|---|---|---|---|
| Demographics | ||||||
|
| ||||||
| Age of patient | 33.13 (4.69, 61.58) | 41.25 (7.28, 75.22) |
NA | 0 (2/291) | 0.00017 | 1.4 (1.2, 1.6) |
|
| ||||||
| Vitals at presentation | ||||||
|
| ||||||
| Respiratory Rate | 27.02 (4.39, 49.66) | 28.91 (12.63, 45.18) |
12- 20 | 3 (11/291) | 0.22 | 1.1 (1.0, 1.2) |
|
|
||||||
| Fever before Presentation (days) | 9.64 (0.00, 19.46) | 8.77 (0.00, 17.66) | NA | 9 (27/291) | 0.23 | 0.8 (0.6, 1.1) |
|
|
||||||
| Diastolic Blood Pressure (mmHg) | 75.17 (51.71, 98.64) | 77.09 (41.33, 112.86) |
<80 | 4 (14/291) | 0.33 | 1.1 (0.9, 1.3) |
|
|
||||||
| Pulse Rate | 88.38 (53.78, 122.97) |
89.92 (55.72, 124.13) |
60- 100 | 3 (10/291) | 0.54 | 1.1 (0.8, 1.5) |
|
|
||||||
| Systolic Blood Pressure (mmHg) | 118.72 (85.72, 151.72) |
120.28 (66.50, 174.07) |
<120 | 4 (14/291) | 0.58 | 1.1 (0.8, 1.4) |
|
|
||||||
| Temperature (°C) | 37.82 (35.60, 40.03) | 37.85 (34.92, 40.78) |
36.1-37.2 | 3 (11/291) | 0.84 | 1.0 (0.7, 1.6) |
|
| ||||||
| Max vitals at the end of presentation day | ||||||
|
| ||||||
| Systolic Blood Pressure (mmHg) | 125.11 (78.86, 171.36) | 136.13 (71.99, 200.27) | <120 | 10 (31/291) | 0.004 | 1.6 (1.1, 2.2) |
|
|
||||||
| Diastolic Blood Pressure (mmHg) | 82.03 (54.84, 109.22) | 87.33 (53.20, 121.45) | <80 | 10 (31/291) | 0.015 | 1.6 (1.1, 2.3) |
|
|
||||||
| Pulse Rate | 94.12 (61.01, 127.22) | 99.97 (53.54, 146.39) | 60- 100 | 9 (28/291) | 0.033 | 1.4 (1.0, 1.9) |
|
|
||||||
| Respiratory Rate | 28.66 (6.82, 50.49) | 31.13 (16.73, 45.54) | 12-20 | 10 (30/291) | 0.11 | 1.1 (1.0, 1.3) |
|
|
||||||
| Temperature (°C) | 38.30 (36.12, 40.49) | 38.25 (36.06, 40.45) | 36.1- 37.2 | 10 (30/291) | 0.76 | 0.9 (0.6, 1.4) |
|
| ||||||
| Labs | ||||||
|
| ||||||
| Basic Metabolic Panel | ||||||
|
| ||||||
| BUN3 (mg/dl) | 20.38 (0.00, 69.69) | 54.16 (0.00, 149.07) | 6-20 | 30 (90/291) | <0.0001 | 2.1 (1.5, 2.8) |
|
|
||||||
| K4 (mmol/L) | 3.99 (2.63, 5.35) | 4.84 (2.51, 7.18) | 3.7-5.2 | 34 (100/291) |
<0.0001 | 2.9 (1.9, 4.5) |
|
|
||||||
| Cr5 (mg/dl) | 2.28 (0.00, 8.95) | 6.86 (0.00, 19.42) | 0.8-1.2 | 52 (154/291) | <0.0001 | 1.9 (1.4, 2.6) |
|
|
||||||
| Sodium (mmol/L) | 136.63 (126.42, 146) | 135.45 (122.67, 148) | 135-145 | 34 (99/291) |
0.21 | 0.8 (0.5, 1.2) |
|
|
||||||
| Calcium (mg/dl) | 7.40 (4.35, 10.45) | 8.46 (5.33, 11.59) | 8.5-10.2 | 94 (276/291) |
0.24 | 2.0 (0.6, 6.9) |
|
| ||||||
| CBC | ||||||
|
| ||||||
| White Blood Cell (103/mm3) | 8.54 (0.00, 32.10) | 14.82 (0.00, 40.91) | 4.3- 5.7 | 34 (100/291) |
0.003 | 1.3 (1.0, 1.6) |
|
|
||||||
| Platelet (103/mm3) | 145.23 (0.00, 321.60) | 177.18 (0.00, 360) | 150-450 | 48 (141/291) |
0.083 | 1.9 (0.8, 3.3) |
|
|
||||||
| Lymphocytes (%) | 33.56 (2.19, 64.93) | 29.95 (0.00, 63.82) | 20-40 | 50 (147/291) |
0.28 | 0.8 (0.5, 1.2) |
|
|
||||||
| Granulocytes (%) | 58.94 (29.56, 88.33) | 62.20 (26.52, 97.88) | 40-80 | 53 (156/291) |
0.32 | 1.4 (0.7, 2.5) |
|
|
||||||
| Hematocrit (%) | 36.70 (21.76, 51.64) | 37.56 (20.66, 54.47) | 35-50 | 30 (90/291) |
0.5 | 1.2 (0.8, 1.7) |
|
|
||||||
| Monocytes (%) | 10.60 (0.00, 34.01) | 12.72 (0.00, 44.50) | 2-10 | 66 (193/291) |
0.51 | 1.1 (0.8, 1.4) |
|
|
||||||
| Sed Rate6 (mm/h) | 50.01 (0.00, 114.64) | 55.33 (0.00, 166.15) | 0-30 | 67 (197/291) |
0.58 | 1.2 (0.6, 2.1) |
|
| ||||||
| LFTs | ||||||
|
| ||||||
| AST7 (IU/L) | 142.71 (0.00, 453.98) | 388.97 (0.00, 1325.14) | 10-40 | 66 (194/291) |
0.0002 | 1.5 (1.1, 2.0) |
|
|
||||||
| ALT8 (IU/L) | 90.30 (0.00, 370.11) | 291.43 (0.00, 1202.19) | 10-40 | 63 (184/291) |
0.0008 | 1.2 (1.0, 1.4) |
|
|
||||||
| ALP9 (IU/L) | 72.12 (0.00, 256.84) | 136.81 (0.00, 339.71) | 44-147 | 76 (223/291) |
0.022 | 1.4 (1.0, 2.0) |
|
|
||||||
| Albumin (g/dl) | 3.05 (0.27, 5.83) | 2.22 (0.60, 3.84) | 3.4-5.4 | 72 (210/291) |
0.032 | 0.3 (0.1, 0.6) |
|
|
||||||
| Total Protein (g/dl) | 6.48 (4.06, 8.89) | 6.06 (3.90, 8.22) | 6-8.3 | 73 (215/291) |
0.24 | 0.7 (0.4, 1.2) |
|
| ||||||
| Other | ||||||
|
| ||||||
| Total Bilirubin (mg/dl) | 1.72 (0.00, 13.56) | 2.61 (0.00, 10.02) | 0.3-1.9 | 59 (173/291) |
0.49 | 1.0 (0.9, 1.1) |
Blood urea nitrogen
Pottasium
Creatinine
Erithrocyte sedimentation rate
Aspartate aminotransferase
Alanine aminotransferase
Alkaline Phosphatase
Several laboratory-tested biomarkers were more significantly associated with outcome than the clinical features. BUN and Cr (P<0.0001) are biomarkers for kidney function: a quartile increase in BUN or Cr is associated with a doubling in mortality. Association with serum AST (P<0.0001) is consistent with known liver malfunction in acute LF. Serum electrolyte perturbations, particularly potassium (K) (P<0.0001), can occur through multiple mechanisms and are associated with systemic disease and increased mortality.
Of demographic indicators, only age is statistically associated with outcome at P<0.001. This agrees with previous studies,16 which found no association between outcome and gender, occupation, and other demographic data.
Multivariate regression analysis and outcome predictors
We developed a logistic regression model for outcome (Figure 2) that includes the following predictors: severe CNS, bleeding, jaundice, Cr, AST, K, and patient age (Table 3). This model has an optimism-corrected AUC of 0.86 and an adjusted R2 of 0.45 (Suppl. Table S3). There is no evidence of systematic bias in the incomplete records, as the missing completely at random condition is not rejected at the P=0.05 level, and justifying the imputation procedure (see Detailed Computational Methods in Supplementary Materials.) The model also exhibits good calibration, which measures its ability to predict observed risks. This is depicted in Figure 2B, where the calibration curve of the model falls very close to the diagonal: the average observed risk in each group of patients aggregated by their predicted risk decile intervals (0-10%, 10-20%, etc.) closely matches the observed mortality, with an overestimation for high risk patients. This result supports our use of the model to stratify patients into low, medium, and high-risk groups. Figure 2D illustrates the observed CFRs within each risk group, and Figure 2E shows the CFR for each group as a function of the days of fever before presentation, which quantifies the delay in starting treatment after symptom onset.
Figure 2. Performance of the multivariate logistic regression model of LF outcome.
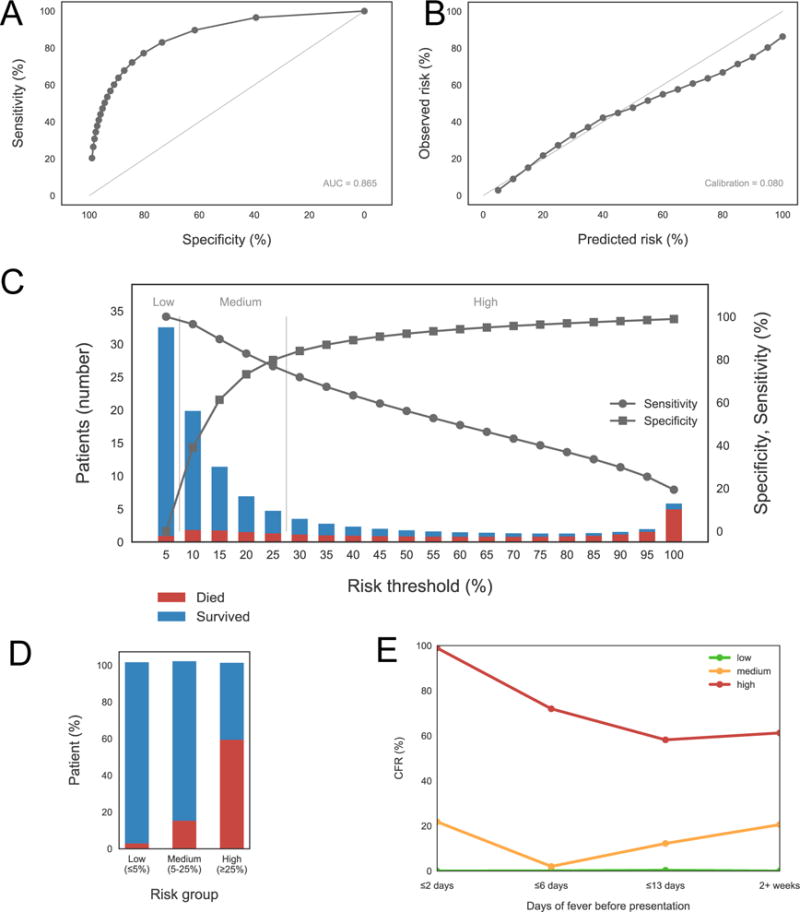
This model includes age, severe central nervous system (CNS) symptoms, bleeding, jaundice, aspartate aminotransferase (AST), creatinine (Cr), and potassium (K) as predictors. (A) Receiver Operator Characteristic (ROC) curve, with Area Under the Curve (AUC) in the lower right corner. (B) calibration curve, with calibration score in the lower right corner. (C) sensitivity/specificity plot showing the patient counts within each risk bin, as predicted by the model, separated between fatal (red) and surviving (blue) cases. The thresholds defining low, medium, and high risks are shown in this plot as well. (D) bar plot depicting the percentage of fatal and surviving cases in each risk group, as defined by the thresholds shown in the bottom (same as those in the sensitivity/specificity plot). (E) mortality as a function of the days of fever before presentation (DOFBP), for DOFBP < 3, up to 6 days, up to 13 days, and more than 2 weeks, for each risk group as defined in the previous plots.
Table 3. Multivariate regression model for LF outcome, pooled from the models fitted with multiple imputation.
It shows the coefficients, odds-ratios, and P-values for each term in the logistic regression model including patient age, presence of severe central nervous system (CNS) symptoms, bleeding, and jaundice at presentation, and aspartate aminotransferase (AST), creatinine (Cr), and potassium (K) levels measured in the first laboratory test performed the day of admission. The pooling aggregated 100 models generated from 100 multiple imputation datasets.
| Variable | Coefficient (95% CI) | OR (95% CI) | P-value |
|---|---|---|---|
| Age | 0.043 (0.018, 0.069) | 1.54 (1.38, 1.81) | 0.0011 |
|
|
|||
| Severe CNS10 | 1.012 (−0.098, 2.122) | 2.75 (1.37, 5.74) | 0.074 |
|
|
|||
| Bleeding | 0.898 (−0.005, 1.802) | 2.46 (1.69, 3.97) | 0.05 |
|
|
|||
| Jaundice | 2.029 (0.057, 4.001) | 7.61 (0.72, 22.97) | 0.044 |
|
|
|||
| AST11 | 0.003 (0.000, 0.006) | 1.49 (0.74, 2.53) | 0.075 |
|
|
|||
| Cr12 | 0.146 (0.002, 0.290) | 1.34 (1.07, 1.74) | 0.046 |
|
|
|||
| K13 | 0.923 (0.332, 1.514) | 3.64 (2.22, 6.45) | 0.0024 |
|
|
|||
Severe central nervous system features
Aspartate aminotransferase
Creatinine
Potassium
In this model, AST, Cr, and K levels are all independent predictors of outcome, and highlight the role of liver and renal dysfunction and electrolyte disturbance in LF mortality. The fact that Cr is still significant after controlling for the remaining covariates suggests that kidney dysfunction may contribute to LF mortality through mechanisms independent of other manifestations of LF, such as liver disease and overall dehydration.
Complications and importance of acute kidney injury
A number of complications during hospitalization are associated with reduced likelihood of recovery (Figure 3A). Among those, AKI has the highest overall incidence (28%, 81/284) and is strongly correlated with mortality (OR=15, P<10−6); furthermore the CFR was 60% (49/81) among patients who developed AKI. Severe CNS complications, most notably encephalopathy, also show high incidence (13%, 39/284) and strong correlation with death (OR=15, P<10−6); the CFR was 74% (29/39) in patients with severe CNS complications. Inclusion of all CNS clinical features observed during hospitalization brings the overall incidence of CNS manifestations at presentation or during treatment to 37% (104/284), highlighting their importance in the clinical course of LF in Nigeria.
Figure 3. Incidence of complications, including acute kidney injury, and laboratory biomarkers indicative of intrinsic renal involvement in LF.

(A) bar plot ranking complications in decreasing order of P-value of association with outcome. Incidence of each complication is shown separately for all, surviving, and fatal cases. (B) distributions of BUN:Cr for all patients who developed AKI with and without history of fluid loss (as measured by presence of diarrhea, bleeding, or vomiting at some point during treatment.) Each light-colored curve was obtained from a single imputed dataset from a total of 50 multiple imputations, while the solid curves represent the distributions over all imputations aggregated together. The aggregate densities are significantly different at P<0.001. (C) Fractions of surviving and fatal cases, plotted as a function of Cr, and AST levels (normal/high) at admission and at discharge or death. Normal levels are defined as <2 mg/dl for Cr and <120 IU/L for AST.
Some patients affected by AKI with rising BUN or Cr levels and/or presence of uremia received hemodialysis in order to replace renal function. Mortality among patients with AKI who received dialysis was lower (56%, 30/54) than among those who did not (70%, 19/27), but still higher than the average CFR of 24%. Geographical distribution of AKI incidence is not uniform (Suppl. Figure S7) and showed clusters of high incidence (>40%), but the pattern was not statistically significant with the current sample size.
The high prevalence of AKI and its strong correlation with fatal outcome indicates the central importance of renal involvement in LF. The next two sub-sections provide further results and explore the nature of renal involvement in more detail.
Evidence for intrinsic renal damage
We observed that patients who developed AKI at some point during treatment but did not present with a clinical history of fluid loss (inferred from occurrence of diarrhea, vomiting, and bleeding at admission) had a lower BUN:Cr at presentation (Figure 3B), consistent with but not sufficient to demonstrate intrinsic renal damage. However, this possibility is supported by the following additional evidence: (a) AKI diagnosis was by ISTH nephrologists using established clinical and laboratory criteria. (b) The presence of LASV has been demonstrated in the urine of some of the patients with clinical and laboratory evidence of acute renal disease during acute LF. (c) Almost all patients with AKI presented with oliguria or anuria. (d) The majority of patients with AKI had urine that is dark, coke-colored or bloody, the color of the urine remaining unchanged in the majority of the patients even after adequate rehydration with intravenous fluids in the first few days after admission. All patients with LF were routinely rehydrated with IV fluids (an average of 3L in 24hrs) on day of presentation. (e) The majority of the patients with AKI had proteinuria and/or hematuria on urine analysis, 82% (32/39) and 76% (29/38), respectively, and higher levels of serum K (4.63±1.04 mmol/L) than patients without AKI (3.97±0.75 mmol/L, P<0.0001). (f) The blood pressures and pulse rates of our patients with AKI were not consistent with hypovolemic states (Suppl. Figure S8). (g) Some AKI patients had renal ultra-sound performed showing features suggestive of acute renal parenchymal injury. (h) Several AKI patients had severe renal impairment requiring hemodialysis. (i) AKI patients who were managed by hemodialysis or otherwise treated conservatively and survived had their renal function normalized, with none progressing to chronic kidney disease (CKD) on follow-up. This finding shows that our patients’ renal disease was not due to nephropathy-causing conditions such as HIV, hypertension and diabetes. History (including family history of kidney disease), as well as clinical and laboratory evaluation, excluded common conditions that cause CKD. (j). Gentamicin or other known nephrotoxic drugs were not administered on the patients, and all of them had Ribavirin.
Cr and AST levels and mortality
We examined the biomarkers Cr and AST at presentation and at discharge or death, grouping patients depending on whether the biomarker was unchanged over time (i.e., remained normal or elevated), or normal at one time and elevated at the other time. The CFR in each of the four resulting groups is shown in Figure 3C. Patients with normal Cr at the end of treatment had no fatal cases, indicating that either absence of kidney dysfunction altogether or success in normalizing renal function is associated with a marked decrease in mortality (0%). In contrast, mortality was very high (62%, 16/26) for patients who presented with elevated Cr levels that do not improve during treatment.
High AST levels can have several causes, but they are consistent with liver involvement in LF according to other indicators in our data –high alanine aminotransferase (ALT) and alkaline phosphatase (ALP) levels, and absence of skeletal muscle injury. We see that mortality among patients with elevated AST levels both at presentation and discharge/death was 25% (3/12), while it was 11% (1/9) for patients with normal AST levels in the two instances. This is a difference of only 14%, considerably smaller than the +60% we observe in Cr.
These results suggest that recovery of renal function is critical for survival in LF. The normalization of Cr levels has the clearest association with survival in the cases where we can examine levels both at admission and discharge/death. We currently do not have similar evidence of recovery of liver function, as measured by AST.
Co-infections
Patients were routinely screened for malaria at referring hospitals and at ISTH. Almost all patients received antimalarial treatment before presenting to ISTH, and at ISTH if blood smear showed evidence of malaria parasitemia. About a third of hospitalized LF patients were co-infected with malaria, and the presence of malaria did not significantly influence outcome.20 Patients who were pregnant were screened for HIV routinely; those with severe diseases such as CNS involvement, bleeding (especially those requiring blood transfusion), and AKI requiring hemodialysis, were routinely screened for HIV, hepatitis B and C viruses. Other patients considered to be at high risk for HIV or Hepatitis B or C infection were screened for these viruses as well. We found very low incidence of these diseases (e.g.: 4 HIV cases in the entire cohort), with no significant effect on outcome.
Patient follow-up and sequelae
Survivors were followed up in ISTH’s follow-up care clinics. Patients with AKI who required dialysis were followed-up for at least 3 months; renal function remained normal in all cases, and none had progressed to CKD; surviving patients in this cohort with CNS involvement were followed up, some for as long as 3 to 18 months, and none showed long-term neurological sequelae. In fact, one of the patients who had LASV in her cerebrospinal fluid (CSF) was followed up for over 24 months, and no long-term neurological complication was observed. Regarding hearing loss in hospitalized LF patients in our center, Ibekwe et al.21 put the incidence of early-onset sensorineural hearing loss in LF at 13.5%. Some of these patients did not recover their hearing and had permanent hearing loss.
Discussion
Our study introduces the most complete clinical and laboratory dataset of LF patients available to date, describes logistic regression models of patient outcome, identifies independent predictors of death, and characterizes the involvement of specific organs in the pathophysiology of LF. Notably, this is the largest clinical dataset from Nigeria, where LASV is most diverse and where annual LF outbreaks are observed. Given the wide variability of clinical manifestations of LF and the paucity of detailed clinical data, there is a great need for such systematic data collection and application of rigorous modeling and machine learning approaches. This is achievable; unlike other hemorrhagic fever diseases, such as Ebola, LF’s high incidence and endemic nature enable such critical characterization outside of an outbreak setting.
Although our regression model is yet to be validated, it is worth noting how the risk stratification by the model shows a decrease in effectiveness of Ribavirin treatment after 6 days from disease onset, corroborating previous findings.5 Mortality for medium-risk patients is only 2% when treatments starts within the first week from onset, but increases to 12% in the second week, and to 20% after two weeks. These results are sound reminders that even in mild cases, Ribavirin should be administered as soon as possible.
More importantly, our model implies that hepatic and renal involvement, quantified by AST and Cr levels respectively, are independent predictors of outcome in this Nigerian cohort. Even though AST, together with ALT, are measures of liver cell injury, caution is needed in interpreting elevated levels. Serum aminotransferases can originate from non-hepatic sources such as skeletal muscle, particularly when AST is higher than ALT.22 McCormick in fact observed that levels of AST in his data were four times as high as those of ALT,11 suggesting that the origin of the AST may not have been the liver. We see a lower AST/ALT ratio of 1.5, which is not consistent with ongoing acute muscle injury but is compatible with LF diagnosis and hepatic involvement by LASV. Also, hepatocyte-affecting diseases cause disproportionate elevations of the AST and ALT levels compared with the ALP level, which is what we observe in our data (Table 2).
We further find that patients who developed AKI at some point during treatment but did not present with a clinical history of intravascular volume loss (inferred from lack of diarrhea, vomiting, and bleeding at admission) had a lower BUN:Cr at presentation. This result suggests that there is a subset of LF patients for whom kidney injury is not explained by pre-renal disease. These patients also have higher rates of proteinuria and hematuria, consistent with intrinsic renal damage. Possible mechanisms include direct kidney involvement by LASV, systemic immune response to infection, or LASV-induced vascular pathology. There is a plausible molecular basis for intrinsic kidney damage caused by LASV: genes in the coagulation pathway are differently expressed in LASV-exposed blood mononuclear cells,8 including Heparin-binding epidermal growth factor–like growth factor (HB-EGF). It has been shown in animal and in-vitro models that up-regulation of HB-EGF results in glomerulonephritis and reduced renal function.23,24 Despite this supporting evidence, identifying the etiology of kidney injury based on currently available data is challenging, as BUN:Cr is not sensitive for pre-renal and clinical assessment of volume status and fluid loss is unreliable. These trends should be explored with additional tests, including urine electrolyte and sediment, and renal histological studies.
These findings on the possible causes of AKI have implications in relation to treatment for patients experiencing acute renal dysfunction. AKI is the complication most strongly associated with death and, as we discussed above, may be caused by LASV’s direct damage to kidney cells. Therefore, adequate rehydration therapy and other measures aiming at normalization of intravascular volume may not be sufficient for recovery of renal function. Hemodialysis does lower mortality among AKI patients from 70% to 56%, but it is still high when compared to the overall CFR. Recent studies on early predictors of AKI,25,26 such as up-regulated (NGAL, KIM-1)27 and cycle arrest proteins (TIMP-2, IGFBP7),27 suggest that modeling could benefit from inclusion of these biomarkers. More importantly, clinicians would be able to anticipate renal involvement so that appropriate interventions could be performed earlier in the clinical course. However, incorporating these new predictors into the models and clinical protocols would require additional laboratory tests, which may not be possible at present.
Our results taken together paint a detailed picture of the course of LF in Nigeria, and how it could be distinct from regions affected by differentiated clades of LASV. The most recent study of comparable size outside Nigeria does not report kidney disease.4 In contrast, renal involvement plays a decisive role in the LF cases treated at ISTH. Although the importance of kidney dysfunction has been noted before in smaller studies, it has never been systematically characterized in a large cohort such as this. Our data does not include quantitative PCR nor sequencing information, and therefore we were not able to study the association between viral load and variants in LASV sequence with phenotypic manifestations of the disease, such as mortality and AKI. However, earlier publications13,16 on LF from the same study site allow us to partially fill this gap. Asogun et al.’s semi-quantitative PCR data from a 2008-2010 ISTH cohort involving the same geographical area shows that LF samples with higher virus load correlate with patient fatality (P<0.001).
Molecular epidemiology carried out by both Asogun et al.16 and Andersen et al.13 (with the latter having sequenced 52 patient samples in our cohort, see Suppl. Table S4) suggests that Nigerian sequences have high levels of nucleotide diversity, with strain variation between 32% and 25%, depending on the region of the LASV genome under consideration. Nigerian LASV clusters in three major clades,13 with one of those clades containing the sequences originating from patients from Edo State, and further subdividing into three separate clusters.16 These previous data support the view that LASV is divergent, and particularly so in the Edo State region. Recent analyses point to the presence of novel sub-lineages and the spread of virus in the southern part of Nigeria,28 and human infection as the result of independent transmissions from a genetically diverse reservoir in the animal host.13 It is possible that these LASV strains are associated with increased incidence of intrinsic renal damage and perhaps other clinical manifestations. However, there are many potential causes for the variable clinical manifestations and severity, including not only LASV strain heterogeneity, but also human genetic predisposition29 and uneven access to medical care.30
Limitations of study
The main limitations of this study consist of its single-site nature, incompleteness of some laboratory records, and lack of quantitative PCR and sequencing data. Therefore, more and better data is critical to independently validate our models across a range of study sites, to further characterize the pathophysiology of LASV, and to examine the impact of human and LASV genome variation and environmental factors. Systematic data collection and application of machine learning approaches can lead to important insights into clinical manifestation of LF, effectiveness of treatment, and accurate prediction of the course of disease. We are currently working with partners and other institutions in West Africa to deploy better mechanisms for clinical and laboratory data collection, which will provide up-to-date data for predictive modeling, and to incentivize clinical staff in the field to collect high quality patient records. These efforts are fundamental to understanding the symptomatology and effectiveness of available clinical care, and ultimately to obtaining actionable knowledge that can be used for better detection, containment, and treatment.
Supplementary Material
Research in Context.
Evidence before this study
Despite the endemic nature and high mortality of Lassa fever (LF) in West Africa, few large-scale, retrospective clinical studies are available, with none from Nigeria, where the virus is most diverse and outbreaks occur very frequently. Between September, 2015 and June 2017, we conducted several literature searches on PubMed and Google Scholar using the following keywords in various combinations: “Lassa fever”, “clinical manifestation”, “retrospective study”, “case-control”, “case report”, “epidemiology”, and “pathogenesis”, “kidney”, “liver”, “organ involvement”. We examined the citations in the found literature for additional materials. These searches yielded some 30 papers dating from 1970 until the present. Only two studies included more than 200 confirmed LF cases, one from Sierra Leone (with data collected between 1977 and 1979) and the other from Liberia (1980-86). This situation indicates a gap in up-to-date medical knowledge of this disease, particularly in Nigeria.
Added value of this study
Our observational cohort study was conducted on the most comprehensive Nigerian LF clinical datasets to date, which includes 291 patients admitted to the LF ward at Irrua Specialist Teaching Hospital (ISTH) in Edo State, Nigeria, between 2011 and 2015. This dataset includes clinical signs and symptoms before admission and at presentation, vital signs and complications during treatment, and detailed laboratory results (hematology and blood chemistry) at presentation and during treatment. Our new findings are supported by earlier reports from ISTH, but those were conducted on smaller cohorts with less laboratory data. Furthermore, and more importantly, we found consistent evidence of intrinsic acute kidney injury (AKI) in LF, an important contributor to severe illness and increased mortality.
Implications of all available evidence
The importance of kidney injury in the prognosis of LF suggests that anticipating renal involvement earlier in the clinical course could lead to more effective interventions during treatment. Also, these results provide a detailed picture of LF manifestation in a large cohort of Nigerian patients, and how its pathophysiology could be distinct from regions affected by other strains of the Lassa virus.
Acknowledgments
Funding Sources
The German Research Foundation, the German Center for Infection Research, Howard Hughes Medical Institute, the US National Institutes of Health, and the World Bank.
Footnotes
Contributors
Peter Okokhere: patient management, study design, data collection, data interpretation, literature search, writing
Andres Colubri: tool development, data analysis, data interpretation, literature search, writing, figures
Shervin Tabrizi: data interpretation, editing
Elizabeth Chin: data analysis, data interpretation, literature search
Ehi Ediale, Sara Asad: data analysis
Chukwuemeka Azubike, Christopher Iruolagbe, Omoregie Osazuwa, Mojeed Rafiu, Rebecca Atafo, Sylvanus Okogbenin: patient management, data collection, literature search
Donatus Adomeh, Ikponmwosa Odia, Chris Aire, Meike Pahlman, Beate Becker-Ziaja: laboratory tests, data collection, data analysis
Danny Asogun: project supervision, literature review
Terrence Fradet: tool development
Ben Fry: tool development, project supervision
Stephen F. Schaffner: writing, editing
Christian Happi: project supervision, writing
George Akpede: project supervision
Stephan Günther: project supervision
Pardis Sabeti: project supervision, data interpretation, writing
Conflicts of Interest
All authors declare not having any conflicts of interest.
References
- 1.Grant DS, Khan H, Schieffelin J, Bausch DG. Chapter 4 - Lassa Fever Emerging Infectious Diseases. Amsterdam: Academic Press; 2014. pp. 37–59. [Google Scholar]
- 2.Frame JD, Baldwin JM, Jr, Gocke DJ, Troup JM. Lassa fever, a new virus disease of man from West Africa. I. Clinical description and pathological findings. Am J Trop Med Hyg. 1970;19(4):670–6. doi: 10.4269/ajtmh.1970.19.670. [DOI] [PubMed] [Google Scholar]
- 3.Safronetz D, Sogoba N, Diawara SI, et al. Annual Incidence of Lassa Virus Infection in Southern Mali. The American Journal of Tropical Medicine and Hygiene. 2017;96(4):944–6. doi: 10.4269/ajtmh.16-0821. [DOI] [PMC free article] [PubMed] [Google Scholar]
- 4.Shaffer JG, Grant DS, Schieffelin JS, et al. Lassa Fever in Post-Conflict Sierra Leone. PLOS Neglected Tropical Diseases. 2014;8(3):e2748. doi: 10.1371/journal.pntd.0002748. [DOI] [PMC free article] [PubMed] [Google Scholar]
- 5.McCormick JB, King IJ, Webb PA, et al. Lassa Fever: Effective Therapy with Ribavirin. New England Journal of Medicine. 1986;314(1):20–6. doi: 10.1056/NEJM198601023140104. [DOI] [PubMed] [Google Scholar]
- 6.Mire CE, Cross RW, Geisbert JB, et al. Human-monoclonal-antibody therapy protects nonhuman primates against advanced Lassa fever. Nature Medicine. 2017;23:1146. doi: 10.1038/nm.4396. [DOI] [PMC free article] [PubMed] [Google Scholar]
- 7.Robinson JE, Hastie KM, Cross RW, et al. Most neutralizing human monoclonal antibodies target novel epitopes requiring both Lassa virus glycoprotein subunits. Nature Communications. 2016;7:11544. doi: 10.1038/ncomms11544. [DOI] [PMC free article] [PubMed] [Google Scholar]
- 8.Zapata JC, Salvato MS. Genomic profiling of host responses to Lassa virus: therapeutic potential from primate to man. Future virology. 2015;10(3):233–56. doi: 10.2217/fvl.15.1. [DOI] [PMC free article] [PubMed] [Google Scholar]
- 9.McCormick JB, Fisher-Hoch SP. Lassa fever. Current topics in microbiology and immunology. 2002;262:24. doi: 10.1007/978-3-642-56029-3_4. [DOI] [PubMed] [Google Scholar]
- 10.Yun NE, Walker DH. Pathogenesis of Lassa Fever. Viruses. 2012;4(10):2031. doi: 10.3390/v4102031. [DOI] [PMC free article] [PubMed] [Google Scholar]
- 11.McCormick JB, King IJ, Webb PA, et al. A Case-Control Study of the Clinical Diagnosis and Course of Lassa Fever. Journal of Infectious Diseases. 1987;155(3):445–55. doi: 10.1093/infdis/155.3.445. [DOI] [PubMed] [Google Scholar]
- 12.Zwizwai R. Infection disease surveillance update. The Lancet Infectious Diseases. 2016;16(2):157. doi: 10.1016/S1473-3099(16)00023-2. [DOI] [PubMed] [Google Scholar]
- 13.Andersen Kristian G, Shapiro BJ, Matranga Christian B, et al. Clinical Sequencing Uncovers Origins and Evolution of Lassa Virus. Cell. 2015;162(4):738–50. doi: 10.1016/j.cell.2015.07.020. [DOI] [PMC free article] [PubMed] [Google Scholar]
- 14.Bente DA, Forrester NL, Watts DM, McAuley AJ, Whitehouse CA, Bray M. Crimean-Congo hemorrhagic fever: History, epidemiology, pathogenesis, clinical syndrome and genetic diversity. Antiviral Research. 2013;100(1):159–89. doi: 10.1016/j.antiviral.2013.07.006. [DOI] [PubMed] [Google Scholar]
- 15.Bird BH, Khristova ML, Rollin PE, Ksiazek TG, Nichol ST. Complete Genome Analysis of 33 Ecologically and Biologically Diverse Rift Valley Fever Virus Strains Reveals Widespread Virus Movement and Low Genetic Diversity due to Recent Common Ancestry. Journal of Virology. 2007;81(6):2805–16. doi: 10.1128/JVI.02095-06. [DOI] [PMC free article] [PubMed] [Google Scholar]
- 16.Asogun DA, Adomeh DI, Ehimuan J, et al. Molecular diagnostics for lassa fever at Irrua specialist teaching hospital, Nigeria: lessons learnt from two years of laboratory operation. PLoS Negl Trop Dis. 2012;6(9):e1839. doi: 10.1371/journal.pntd.0001839. [DOI] [PMC free article] [PubMed] [Google Scholar]
- 17.Okogbenin SA, Asogun D, Akpede G, Okokhere P, Gunther S, Happi C. New lessons from a case series review of Lassa fever in pregnancy. International Journal of Infectious Diseases. 2010;14:e380. [Google Scholar]
- 18.Okokhere PO, Bankole IA, Akpede GO. Central nervous system manifestations of lassa fever in Nigeria and the effect on mortality. Journal of the Neurological Sciences. 2013;333:e604. [Google Scholar]
- 19.Okokhere PO, Bankole IA, Iruolagbe CO, et al. Aseptic Meningitis Caused by Lassa Virus: Case Series Report. Case Reports in Neurological Medicine. 2016;2016:4. doi: 10.1155/2016/1978461. [DOI] [PMC free article] [PubMed] [Google Scholar]
- 20.Okokhere P, Asogun D, Okogbenin SA. The effect of malaria on the outcome of Lassa Fever. International Journal of Infectious Diseases. 2010;14:e333. [Google Scholar]
- 21.Ibekwe TS, Okokhere PO, Asogun D, et al. Early-onset sensorineural hearing loss in Lassa fever. European Archives of Oto-Rhino-Laryngology. 2011;268(2):197–201. doi: 10.1007/s00405-010-1370-4. [DOI] [PubMed] [Google Scholar]
- 22.Nathwani RA, Pais S, Reynolds TB, Kaplowitz N. Serum alanine aminotransferase in skeletal muscle diseases. Hepatology. 2005;41(2):380–2. doi: 10.1002/hep.20548. [DOI] [PubMed] [Google Scholar]
- 23.Zapata B, Fernández-Alemán J, Idri A, Toval A. Empirical Studies on Usability of mHealth Apps: A Systematic Literature Review. Journal of Medical Systems. 2015;39(2):1–19. doi: 10.1007/s10916-014-0182-2. [DOI] [PubMed] [Google Scholar]
- 24.Feng L, Garcia GE, Yang Y, et al. Heparin-binding EGF-like growth factor contributes to reduced glomerular filtration rate during glomerulonephritis in rats. The Journal of Clinical Investigation. 2000;105(3):341–50. doi: 10.1172/JCI2869. [DOI] [PMC free article] [PubMed] [Google Scholar]
- 25.de Geus HRH, Betjes MG, Bakker J. Biomarkers for the prediction of acute kidney injury: a narrative review on current status and future challenges. Clinical Kidney Journal. 2012;5(2):102–8. doi: 10.1093/ckj/sfs008. [DOI] [PMC free article] [PubMed] [Google Scholar]
- 26.McCullough PA, Shaw AD, Haase M, et al. Diagnosis of Acute Kidney Injury Using Functional and Injury Biomarkers: Workgroup Statements from the Tenth Acute Dialysis Quality Initiative Consensus Conference. ADQI Consensus on AKI Biomarkers and Cardiorenal Syndromes. 2013;182:13–29. doi: 10.1159/000349963. [DOI] [PubMed] [Google Scholar]
- 27.Koyner JL, Vaidya VS, Bennett MR, et al. Urinary Biomarkers in the Clinical Prognosis and Early Detection of Acute Kidney Injury. Clinical Journal of the American Society of Nephrology: CJASN. 2010;5(12):2154–65. doi: 10.2215/CJN.00740110. [DOI] [PMC free article] [PubMed] [Google Scholar]
- 28.Ehichioya DU, Hass M, Becker-Ziaja B, et al. Current Molecular Epidemiology of Lassa Virus in Nigeria. Journal of Clinical Microbiology. 2011;49(3):1157–61. doi: 10.1128/JCM.01891-10. [DOI] [PMC free article] [PubMed] [Google Scholar]
- 29.Andersen KG, Shylakhter I, Tabrizi S, Grossman SR, Happi CT, Sabeti PC. Genome-wide scans provide evidence for positive selection of genes implicated in Lassa fever. Philosophical Transactions of the Royal Society of London B: Biological Sciences. 2012;367(1590):868–77. doi: 10.1098/rstb.2011.0299. [DOI] [PMC free article] [PubMed] [Google Scholar]
- 30.Ajayi NA, Nwigwe CG, Azuogu BN, et al. Containing a Lassa fever epidemic in a resource-limited setting: outbreak description and lessons learned from Abakaliki, Nigeria (January–March 2012) International Journal of Infectious Diseases. 2013;17(11):e1011–e6. doi: 10.1016/j.ijid.2013.05.015. [DOI] [PubMed] [Google Scholar]
Associated Data
This section collects any data citations, data availability statements, or supplementary materials included in this article.